Detailed Analysis: Sources, Methods, and Impact of Arsenic in Air
VerifiedAdded on 2023/04/21
|8
|2883
|378
Report
AI Summary
This report provides a detailed analysis of arsenic in air, examining both natural and man-made sources such as the earth's crust, volcanic eruptions, industrial activities, and the use of pesticides. It highlights the significance of arsenic contamination in New Zealand, attributing it to both anthropogenic and geogenic factors, including pesticide use, timber treatment, and geothermal activity. The report explores two primary methods for arsenic analysis: Anodic Stripping Voltammetry (ASV) and Atomic Absorption Spectrometry (AAS), recommending AAS for its cost-effectiveness, accessibility, sensitivity, and accuracy. It also discusses the toxicity of arsenic, detailing its adverse health effects, including skin lesions, cancers, and cardiovascular diseases. The study concludes that implementing AAS in regions like Canterbury is crucial for effective monitoring and mitigation of airborne arsenic concentrations. Desklib provides access to similar reports and study resources for students.
1
Analysis of Arsenic in Air
Name
Department
City, State and Zip code
Email
Month/date/2019
Executive Summary
The sources of arsenic include natural sources and man-made sources. The man-made
sources include application of fertilizers, herbicides, and pesticides. Mining, and burning of
charcoals are also human activities that result to emission of arsenic to the atmosphere. The
natural sources of arsenic include the earth crust, volcanic actions, and sea-living organisms.
Arsenic level is a concern in New Zealand. The two methods of analyzing arsenic composition in
air include atomic absorption spectrometry (AAS) and Anodic Stripping Voltammetry (ASV).
AAS is the most recommended method of sampling and analyzing airborne conditions in arsenic
because it is cost effective, accessible, more sensitive and accurate.
Introduction
This report has been prepared to determine the current data and knowledge about the
composition of arsenic in the atmospheric air. Within the report, the chemistry of atmosphere and
the various sources of arsenic emissions have been included. The report also contains the effects
of arsenic on human health, the sources of arsenic in air, and the importance of these sources
have also been considered. Through the report, the author has also analyzed two methods of
sampling and analyzing arsenic composition in air, after which the most appropriate method has
been recommended.
Sources of Arsenic in Air
The sources of arsenic in air can be grouped into two categories; natural sources and
man-made sources. The most common and abundant natural source of arsenic in air is the earth’s
Analysis of Arsenic in Air
Name
Department
City, State and Zip code
Month/date/2019
Executive Summary
The sources of arsenic include natural sources and man-made sources. The man-made
sources include application of fertilizers, herbicides, and pesticides. Mining, and burning of
charcoals are also human activities that result to emission of arsenic to the atmosphere. The
natural sources of arsenic include the earth crust, volcanic actions, and sea-living organisms.
Arsenic level is a concern in New Zealand. The two methods of analyzing arsenic composition in
air include atomic absorption spectrometry (AAS) and Anodic Stripping Voltammetry (ASV).
AAS is the most recommended method of sampling and analyzing airborne conditions in arsenic
because it is cost effective, accessible, more sensitive and accurate.
Introduction
This report has been prepared to determine the current data and knowledge about the
composition of arsenic in the atmospheric air. Within the report, the chemistry of atmosphere and
the various sources of arsenic emissions have been included. The report also contains the effects
of arsenic on human health, the sources of arsenic in air, and the importance of these sources
have also been considered. Through the report, the author has also analyzed two methods of
sampling and analyzing arsenic composition in air, after which the most appropriate method has
been recommended.
Sources of Arsenic in Air
The sources of arsenic in air can be grouped into two categories; natural sources and
man-made sources. The most common and abundant natural source of arsenic in air is the earth’s
Paraphrase This Document
Need a fresh take? Get an instant paraphrase of this document with our AI Paraphraser
2
crust. The earth crust exists in various minerals while arsenopyrate being the most common one.
The other natural source of arsenic air is volcanic eruptions. The solid and liquid forms of
arsenic salts also generate arsenic that contains vapor (Huang, 2014). This is also a natural source
of arsenic in air. In certain parts of the world, for example, in Taiwan, Bangladesh, and India, the
groundwater that is used for drinking purposes is a natural source of inorganic arsenic that
originates from the geological actions. The sea-living organisms are also important sources of
organic arsenic compounds that are comprising of carbon atoms. On the other hand, arsenic
trioxide is one of the man-made source of elemental arsenic. Smelting operations on the metals is
the major source of the arsenic trioxide. Moreover, human activities such as mining, and burning
of fossil fuels significantly generate arsenic compounds in the air. The other man-made source of
arsenic is the pesticides.
Sources of arsenic important to New Zealand air.
High arsenic concentration in New Zealand’s ecosystem owes its origin to both
anthropogenic and geogenic sources (Robinson et al., 2006). The primary sources of
innumerable arsenic-contaminated sites in New Zealand results from human activities. The use
of pesticides, fertilizers and herbicides increases arsenic concentration. Extensive application of
pesticides in horticulture is known to increase arsenates and arsenites such as zinc, lead,
magnesium, calcium and Paris green in orchards. This leads to soil arsenic contamination ().
Application of sodium arsenite in controlling aquatic weeds is also known to add arsenic
concentration in New Zealand lakes (Huang, 2014). Large arsenic concentrations have also been
recorded to result from extensive use of arsenic pesticides in controlling ticks, lice and fleas in
cattle and sheep dips. This practice contaminated about 20000 sites in New Zealand (Robinson et
al., 2006). Historically, cattle dips have arsenic concentration of up to 2282 mg/kg occurring at
up to 20-40cm depth (Bolan and Thiagarajan, 2015). These effects are not limited to soil
contamination alone. Natural process such as wind action, air currents, weathering and other
forms of dispersal transfers these arsenic compositions to air leading air contamination.
The use of copper chromium arsenic (CCA) is another human activity that leads to
arsenic contamination in New Zealand. Consequently, majority of the areas associated with
timber industries in New Zealand or areas where timber is used are relatively more contaminated
with arsenic. Effluents from timber treatment is considered to be a major source of arsenic
3
contamination in both terrestrial and aquatic environments (Bolan and Thiagarajan, 2015). The
contaminated sites in this case ranges from timber dumb sites to playgrounds where timber are
used for construction. When the treated timber or coal is used as a heating sources which is
common during winter in urban areas, the emitted smock contains large concentration of arsenic.
Natural processes such as geothermal activities also contribute to arsenic contamination
in New Zealand. Geothermal areas of Taupo for instance have relatively smaller contribution to
air contamination compared water and soil contamination (Pandey and Bhatt, 2015). These
processes increase arsenic concentration of water ways that passes through these areas for
example water ways situated in North island of New Zealand
.
Methods for collection of Samples for Arsenic Analysis
1. Determination of particulate and Gaseous Arsenic Emissions
The use of this method requires one to apply the knowledge in other test methods since it
does not involve all the specifications of sampling and analysis. The method is mostly applied
when determining the inorganic emissions. These emissions are determined from the stationary
sources(Priyanka, 2019).The procedure of the method involves isokinetic withdrawal of the
particulate and gaseous emissions of As from the specified sources. Thereafter, the emissions are
collected on the specified glass mat filters and in water. Atomic absorption spectrophotometry
(AAS) is the method of analyzing the collected arsenic.
2. The second method involves drawing of a definite volume of air a given membrane filter.
The filter is always located within the sample head of a system of total dust sampling. The
definite volume of air is drawn by the use of a suitable pumping mechanism. The most
appropriate and recommended flow rate for this method is 10 L/min since this volumetric
flow rate explicitly defines the inhalable dust (Lodge, 2017). The sample is then taken through
acid digestion and analyzed by the method of graphite furnace atomic absorption
spectrometry. On the other hand, auto-sampler is used to prepare the calibration solutions by
diluting it through a constant injection of specific volume with a lower range of
measurement. The blank value method is used to determine the qualification limit.
⊘ This is a preview!⊘
Do you want full access?
Subscribe today to unlock all pages.
Trusted by 1+ million students worldwide
4
The Methods of Analyzing Arsenic in Air
1. Anodic Stripping Voltammetry (ASV)
The method involves setting up ASV instrumentation following the specifications of the
manufacturer. Thereafter, the electrode is thoroughly cleaned before adding the GCE and the
gold film is deposited on the GCE electrode condition. 5ml of hydrochloric acid is added to the
25ml (working standard). The electrode is immersed and the responses are recorded. The
recorded responses are used to construct a calibration curve. The sample concentration is
calculated by comparing the responses of the sample to the calibration curve (Ruchi and Amit,
2019). The mid-range check standard is analyzed by verifying the GCE operations and the its
recovery. If recovery if found within a range of plus or minus 10%, then it would be important to
renew the gold film and clean the GCE. Then the mid-range check standard is verified. If the
recovery does not fall within the range of plus or minus 10%, then the sample is taken for
analysis. However, if it falls within the plus or minus 10% recovery range for the second time,
then the sample is taken back to the stage where addition of 5ml hydrochloric acid takes place.
2. Atomic Absorption Spectrometry
This method of analyzing arsenic composition in air starts by placing the aliquot of the
digested sample in a beaker and then adding the concentrated sulphuric (VI) and nitric acid and
evaporating the sample. If the sample chars, then the next step is to adding the nitric (V) acid to
complete the digestion. However, if the sample does not char, then heat is turned off, the sample
is cooled and more nitric (V) is added to the sample. After the addition of the nitric (V) acid, the
sample is cooled and water is added. After which, the sample is evaporated and cooled. The
digested sample is transferred to a flask and the concentrated hydrochloric acid is added to bring
the sample to a volume (Ruchi and Amit, 2019). The standards are also prepared and transferred to
the flask to bring the solution to desired volume. Matrix interference is detected in order to
proceed to the next step. If the matrix interference is not detected, then the prepared sample is
added to the flask to bring the component to a desired volume and used as blank. The solution
prepared is used as a blank. A portion of the digested sample is transferred to a reaction vessel.
KI and SnCl solutions are added the sample in the reaction vessel after which the metal is
reduced to its lowest oxidation state. The vessel is attached to the gas glassware and the dropper
is filled with zinc slurry and using 193.7 nm wavelength and a background correction to operate
Paraphrase This Document
Need a fresh take? Get an instant paraphrase of this document with our AI Paraphraser
5
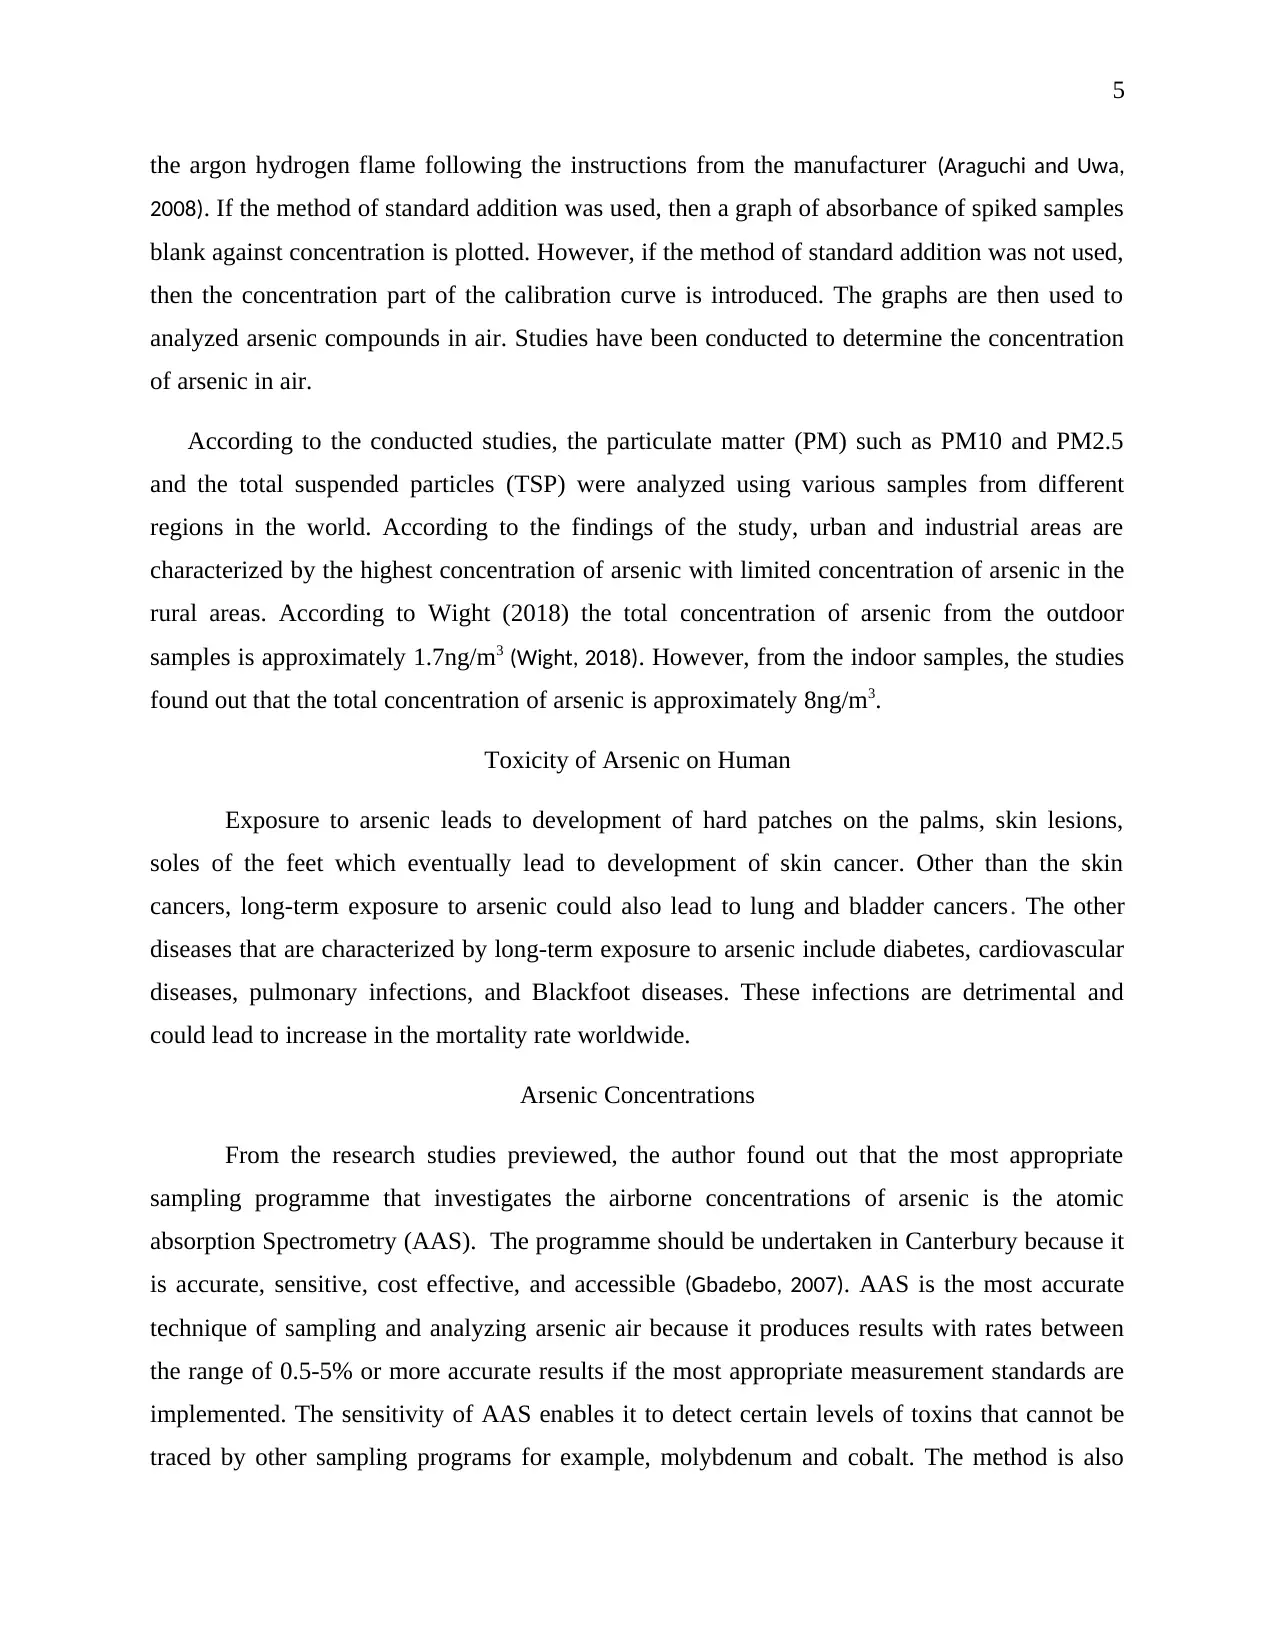
the argon hydrogen flame following the instructions from the manufacturer (Araguchi and Uwa,
2008). If the method of standard addition was used, then a graph of absorbance of spiked samples
blank against concentration is plotted. However, if the method of standard addition was not used,
then the concentration part of the calibration curve is introduced. The graphs are then used to
analyzed arsenic compounds in air. Studies have been conducted to determine the concentration
of arsenic in air.
According to the conducted studies, the particulate matter (PM) such as PM10 and PM2.5
and the total suspended particles (TSP) were analyzed using various samples from different
regions in the world. According to the findings of the study, urban and industrial areas are
characterized by the highest concentration of arsenic with limited concentration of arsenic in the
rural areas. According to Wight (2018) the total concentration of arsenic from the outdoor
samples is approximately 1.7ng/m3 (Wight, 2018). However, from the indoor samples, the studies
found out that the total concentration of arsenic is approximately 8ng/m3.
Toxicity of Arsenic on Human
Exposure to arsenic leads to development of hard patches on the palms, skin lesions,
soles of the feet which eventually lead to development of skin cancer. Other than the skin
cancers, long-term exposure to arsenic could also lead to lung and bladder cancers. The other
diseases that are characterized by long-term exposure to arsenic include diabetes, cardiovascular
diseases, pulmonary infections, and Blackfoot diseases. These infections are detrimental and
could lead to increase in the mortality rate worldwide.
Arsenic Concentrations
From the research studies previewed, the author found out that the most appropriate
sampling programme that investigates the airborne concentrations of arsenic is the atomic
absorption Spectrometry (AAS). The programme should be undertaken in Canterbury because it
is accurate, sensitive, cost effective, and accessible (Gbadebo, 2007). AAS is the most accurate
technique of sampling and analyzing arsenic air because it produces results with rates between
the range of 0.5-5% or more accurate results if the most appropriate measurement standards are
implemented. The sensitivity of AAS enables it to detect certain levels of toxins that cannot be
traced by other sampling programs for example, molybdenum and cobalt. The method is also
6
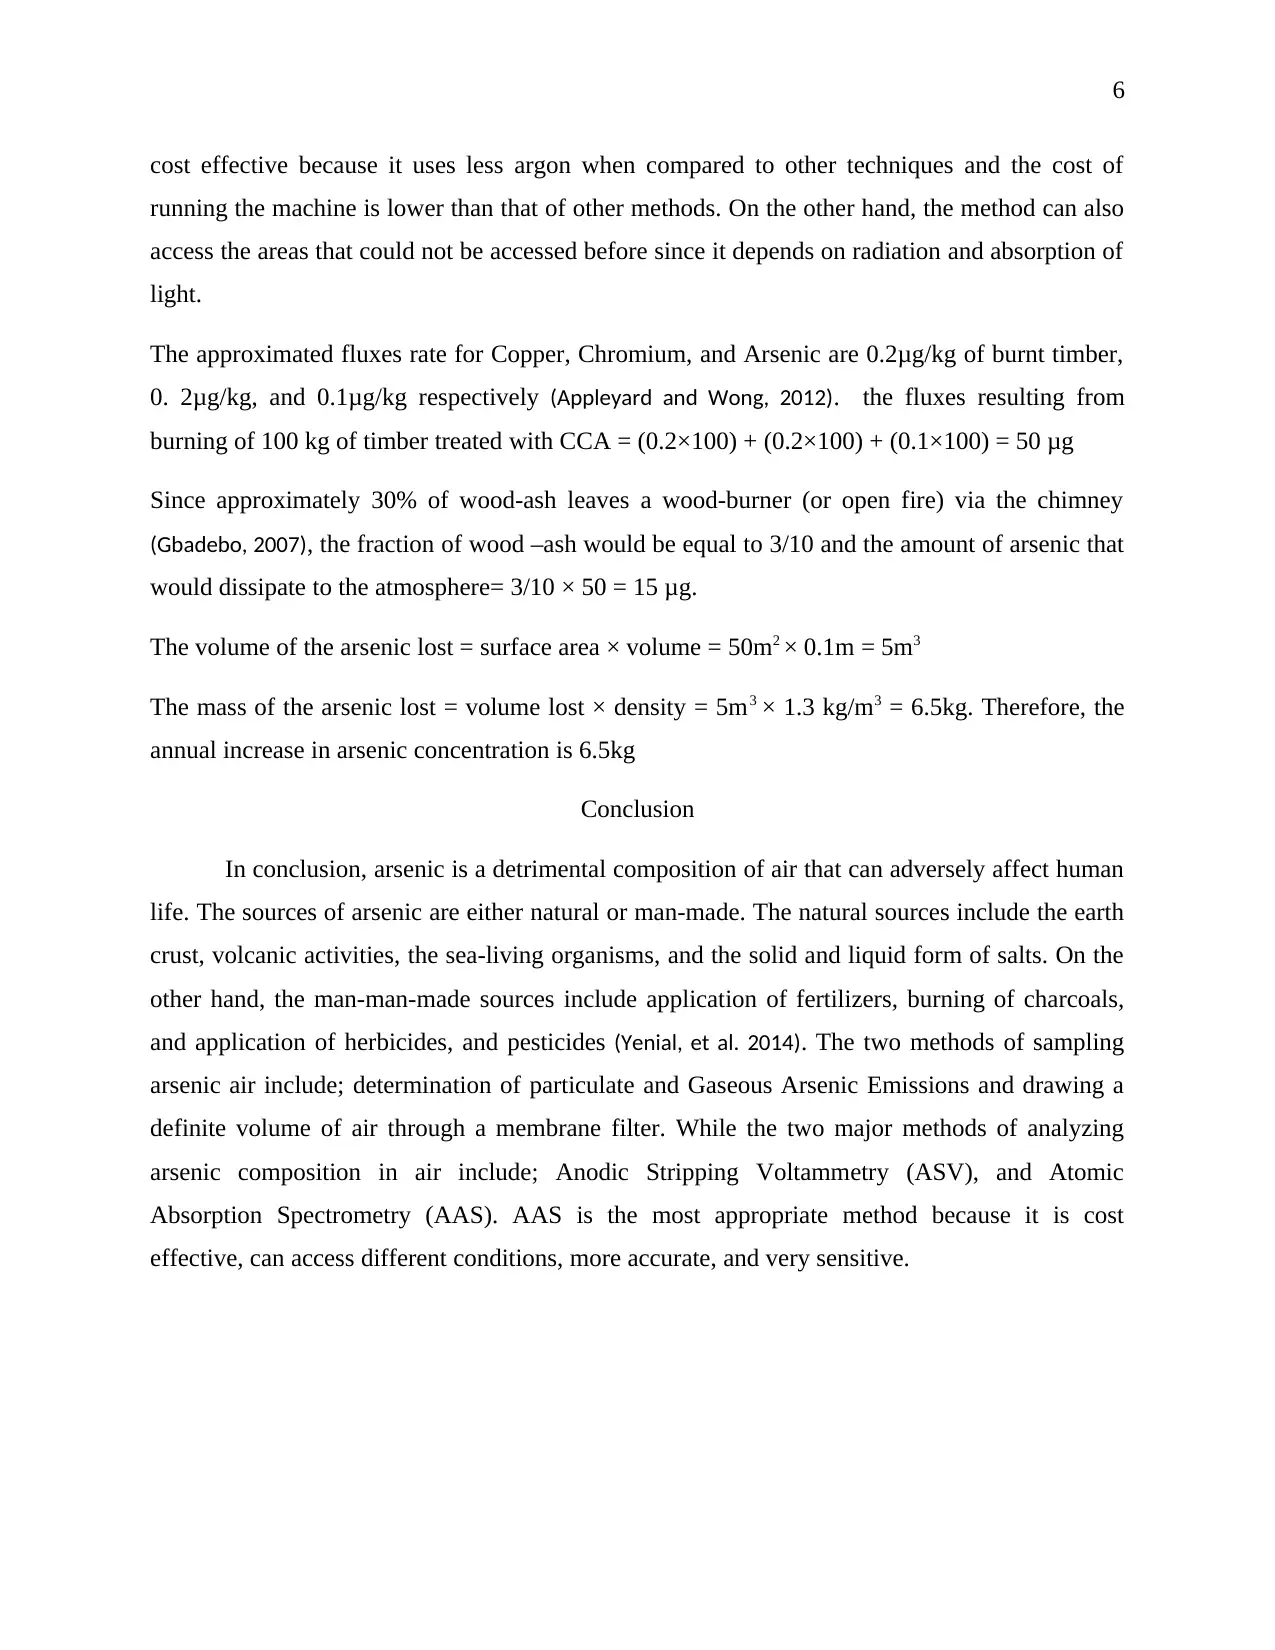
cost effective because it uses less argon when compared to other techniques and the cost of
running the machine is lower than that of other methods. On the other hand, the method can also
access the areas that could not be accessed before since it depends on radiation and absorption of
light.
The approximated fluxes rate for Copper, Chromium, and Arsenic are 0.2μg/kg of burnt timber,
0. 2μg/kg, and 0.1μg/kg respectively (Appleyard and Wong, 2012). the fluxes resulting from
burning of 100 kg of timber treated with CCA = (0.2×100) + (0.2×100) + (0.1×100) = 50 μg
Since approximately 30% of wood-ash leaves a wood-burner (or open fire) via the chimney
(Gbadebo, 2007), the fraction of wood –ash would be equal to 3/10 and the amount of arsenic that
would dissipate to the atmosphere= 3/10 × 50 = 15 μg.
The volume of the arsenic lost = surface area × volume = 50m2 × 0.1m = 5m3
The mass of the arsenic lost = volume lost × density = 5m3 × 1.3 kg/m3 = 6.5kg. Therefore, the
annual increase in arsenic concentration is 6.5kg
Conclusion
In conclusion, arsenic is a detrimental composition of air that can adversely affect human
life. The sources of arsenic are either natural or man-made. The natural sources include the earth
crust, volcanic activities, the sea-living organisms, and the solid and liquid form of salts. On the
other hand, the man-man-made sources include application of fertilizers, burning of charcoals,
and application of herbicides, and pesticides (Yenial, et al. 2014). The two methods of sampling
arsenic air include; determination of particulate and Gaseous Arsenic Emissions and drawing a
definite volume of air through a membrane filter. While the two major methods of analyzing
arsenic composition in air include; Anodic Stripping Voltammetry (ASV), and Atomic
Absorption Spectrometry (AAS). AAS is the most appropriate method because it is cost
effective, can access different conditions, more accurate, and very sensitive.
⊘ This is a preview!⊘
Do you want full access?
Subscribe today to unlock all pages.
Trusted by 1+ million students worldwide
7
References
Appleyard, S., & Wong, S. (2012). Groundwater contamination by arsenic in a suburban setting
in Perth, Western Australia. Arsenic in the Environment - Proceedings, 533-536.
Araguchi, H., & Uwa, K. (2008). Chapter 4b Marine Analysis By Atomic Absorption
Spectrometry. Techniques and Instrumentation in Analytical Chemistry, 95-122.
Bolan, N. S., & Thiagarajan, S. (2015). Retention and plant availability of chromium in soils as
affected by lime and organic matter amendments. Soil Research, 39(5), 1091.
Gbadebo, A. M. (2007). Arsenic concentration in selected soils around Abeokuta, southwestern
Nigeria. Trace Metals and other Contaminants in the Environment, 257-267.
Huang, J. (2014). Impact of Microorganisms on Arsenic Biogeochemistry: A Review. Water,
Air, & Soil Pollution, 225(2).
Lodge, J. P. (2017). Determination of Arsenic Content of Atmospheric Particulate Matter.
Methods of Air Sampling and Analysis, 361-364.
Pandey, N., & Bhatt, R. (2015). Arsenic Removal and Biotransformation Potential of
Exiguobacterium Isolated From an Arsenic-Rich Soil of Chhattisgarh, India. CLEAN -
Soil, Air, Water, 44(2), 211-218.
Priyanka, K. (2019). Effects of air pollution on human health. Air pollution: sources, impacts
and controls, 135-150.
Robinson, B., Kim, N., Marchetti, M., Moni, C., Schroeter, L., Van den Dijssel, C., …
Clothier, B. (2006). Arsenic hyperaccumulation by aquatic macrophytes in the Taupo
Volcanic Zone, New Zealand. Environmental and Experimental Botany, 58(1-3), 206-
215.
Ruchi, S., & Amit, K. (2019). Air pollution control: policies and legislations. Air pollution:
sources, impacts and controls, 198-215.
Wight, G. D. (2018). Air Sampling Methods for Gaseous Pollutants. Fundamentals of Air
Sampling, 99-110.
Yenial, Ü., Bulut, G., & Ali Sirkeci, A. (2014). Arsenic Removal by Adsorptive Flotation
Methods. CLEAN - Soil, Air, Water, 42(11), 1567-1572.
Paraphrase This Document
Need a fresh take? Get an instant paraphrase of this document with our AI Paraphraser

8
1 out of 8

Your All-in-One AI-Powered Toolkit for Academic Success.
+13062052269
info@desklib.com
Available 24*7 on WhatsApp / Email
![[object Object]](/_next/static/media/star-bottom.7253800d.svg)
Unlock your academic potential
Copyright © 2020–2026 A2Z Services. All Rights Reserved. Developed and managed by ZUCOL.