Detailed Analysis of Shoe Prices in Asian Market for Market Entry
VerifiedAdded on 2022/11/17
|15
|2443
|304
Report
AI Summary
This report analyzes the Asian shoe market to provide insights for an Australian shoe company planning to enter the market. The data is organized by gender and country of production, and analyzed using descriptive statistics, two-sample t-tests, one-way ANOVA, and linear regression. The results indicate significant price differences based on the country of production and highlight cost as a major factor in pricing. The report advises the Australian company to minimize costs and consider competition from low-priced shoes from China and Singapore. It also discusses the statistical significance of price variations based on gender and country, confirming that prices vary significantly by country but not necessarily by gender. The regression analysis reveals a positive linear relationship between production cost and sales price, which suggests that higher production costs lead to higher sales prices in the Asian market.

ANALYSIS OF SHOE PRICES IN ASIAN MARKET
Name
Course
Date
Name
Course
Date
Paraphrase This Document
Need a fresh take? Get an instant paraphrase of this document with our AI Paraphraser
1
1. Executive Summary
The study aims at analyzing the Asian Shoe market to provide an insight for the Australian
shoe company planning to venture into the market. The data was organized in terms of gender
and country of production. Descriptive statistics, two sample t-test, one-way ANOVA and
linear regression were used in the analysis. The results show that there is difference in price
for shoes from the three countries. Also, cost is a major factor in pricing of shoes in the
market. Therefore, the Australian company should minimize the cost and check the expected
competition from the low-priced shoes from China and Singapore.
2
2. Table of Contents
1. Executive Summary.....................................................................................................................1
2. Table of Contents.........................................................................................................................2
3. Business Problem.........................................................................................................................3
4. Statistical Problem.......................................................................................................................3
5. Analysis........................................................................................................................................3
5.1. Part 1....................................................................................................................................3
5.1.1. Descriptive Statistic for Price Based on Gender........................................................3
5.1.2. Descriptive Statistic for Price Based on Country of Production..............................5
5.2. Part 2....................................................................................................................................6
5.2.1. Two Sample T-test for Price Based on Gender..........................................................6
5.2.2. Test of Mean Price Difference between Countries of Production............................7
5.2.3. Scatter Plot for Price Against Cost.............................................................................8
5.2.4. Simple Linear Regression for Price and Cost data....................................................8
6. General Conclusion...................................................................................................................10
7. Bibliography................................................................................................................................11
8. Appendix.....................................................................................................................................12
⊘ This is a preview!⊘
Do you want full access?
Subscribe today to unlock all pages.
Trusted by 1+ million students worldwide
3
3. Business Problem
To identify the business gap in the Asian shoe market based on price, gender, cost and
country of production.
4. Statistical Problem
To use two-sample t-test, and one-way ANOVA to establish difference in the average
price for gender and country of production. Regression analysis to establish relationship
between cost and price of shoes.
5. Analysis
5.1. Part 1
The section presents the answers to descriptive statistics and boxplots for the price data.
5.1.1. Descriptive Statistic for Price Based on Gender
The analysis was performed in Excel software and only the relevant outputs are
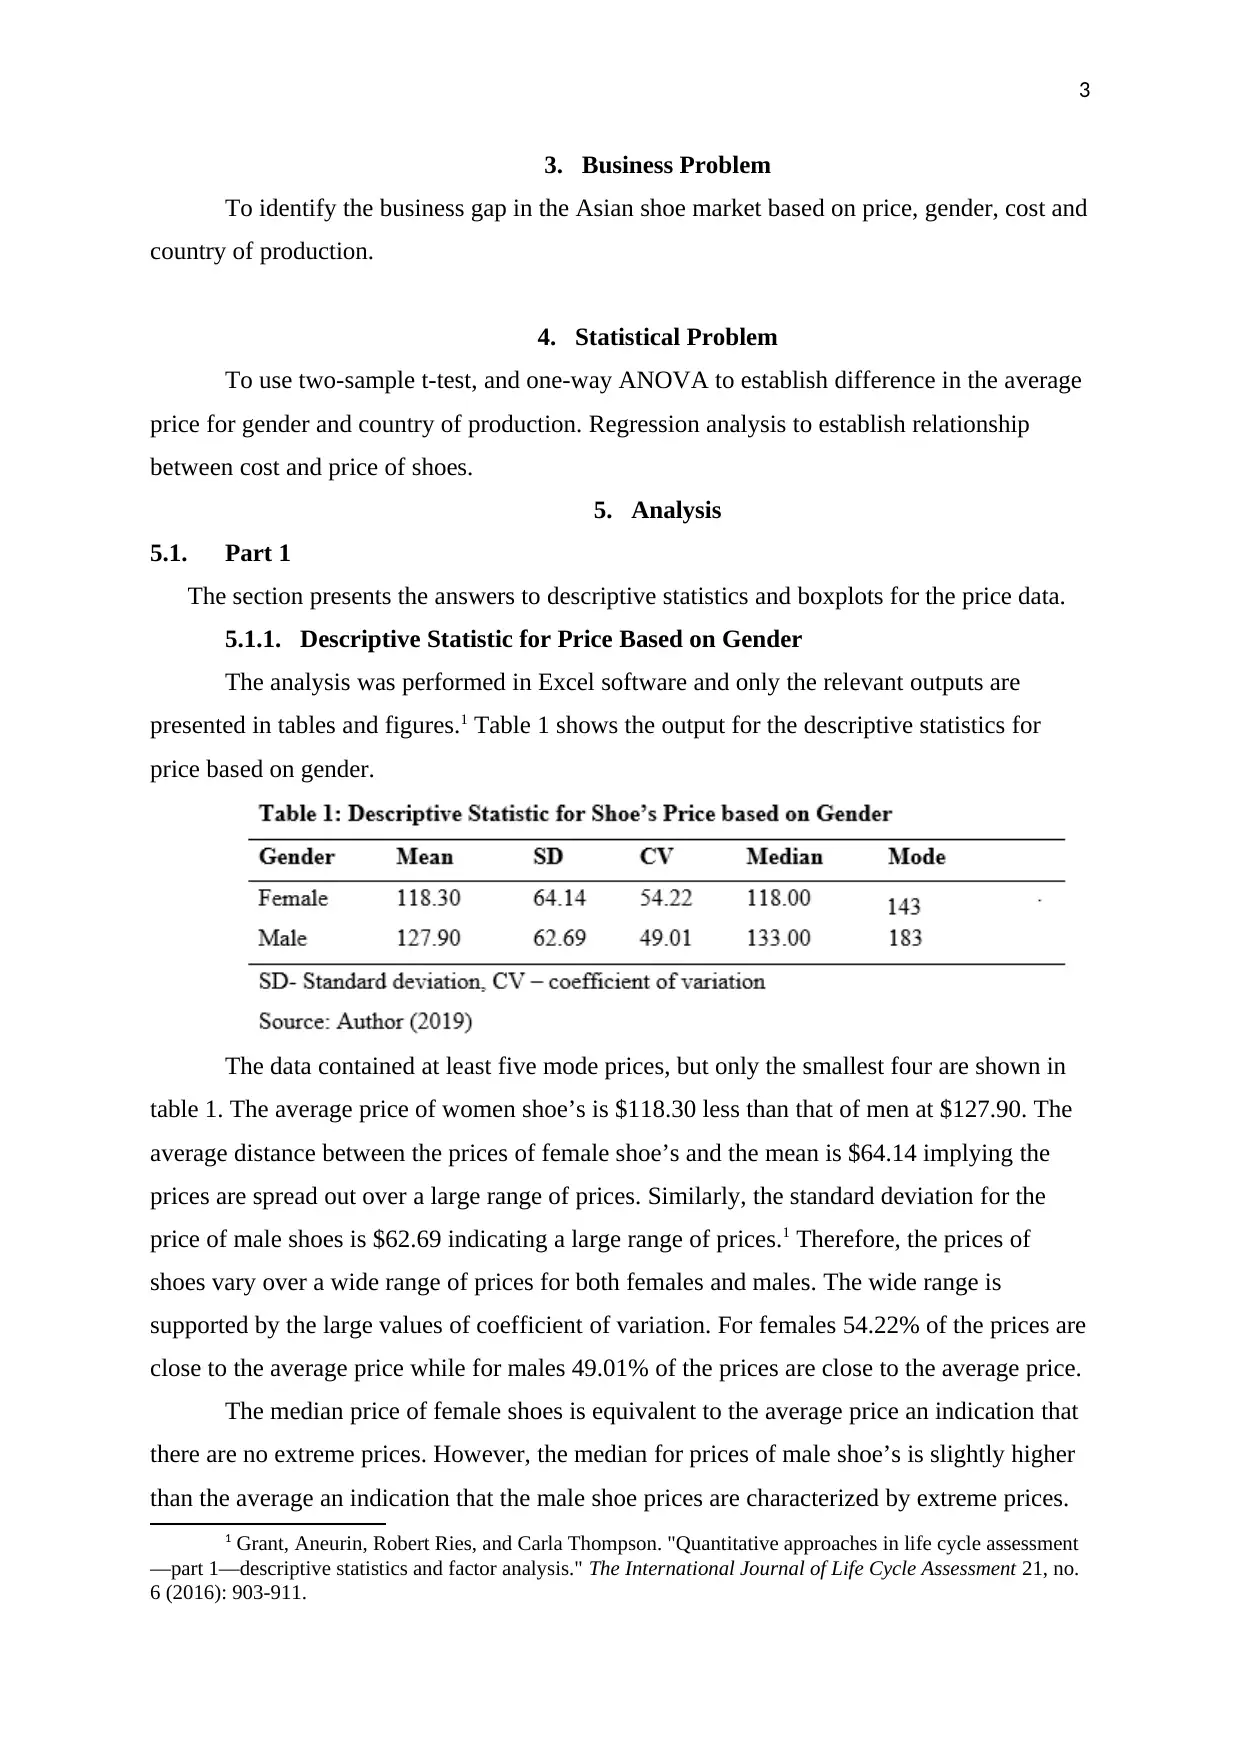
presented in tables and figures.1 Table 1 shows the output for the descriptive statistics for
price based on gender.
The data contained at least five mode prices, but only the smallest four are shown in
table 1. The average price of women shoe’s is $118.30 less than that of men at $127.90. The
average distance between the prices of female shoe’s and the mean is $64.14 implying the
prices are spread out over a large range of prices. Similarly, the standard deviation for the
price of male shoes is $62.69 indicating a large range of prices.1 Therefore, the prices of
shoes vary over a wide range of prices for both females and males. The wide range is
supported by the large values of coefficient of variation. For females 54.22% of the prices are
close to the average price while for males 49.01% of the prices are close to the average price.
The median price of female shoes is equivalent to the average price an indication that
there are no extreme prices. However, the median for prices of male shoe’s is slightly higher
than the average an indication that the male shoe prices are characterized by extreme prices.
1 Grant, Aneurin, Robert Ries, and Carla Thompson. "Quantitative approaches in life cycle assessment
—part 1—descriptive statistics and factor analysis." The International Journal of Life Cycle Assessment 21, no.
6 (2016): 903-911.
3. Business Problem
To identify the business gap in the Asian shoe market based on price, gender, cost and
country of production.
4. Statistical Problem
To use two-sample t-test, and one-way ANOVA to establish difference in the average
price for gender and country of production. Regression analysis to establish relationship
between cost and price of shoes.
5. Analysis
5.1. Part 1
The section presents the answers to descriptive statistics and boxplots for the price data.
5.1.1. Descriptive Statistic for Price Based on Gender
The analysis was performed in Excel software and only the relevant outputs are
presented in tables and figures.1 Table 1 shows the output for the descriptive statistics for
price based on gender.
The data contained at least five mode prices, but only the smallest four are shown in
table 1. The average price of women shoe’s is $118.30 less than that of men at $127.90. The
average distance between the prices of female shoe’s and the mean is $64.14 implying the
prices are spread out over a large range of prices. Similarly, the standard deviation for the
price of male shoes is $62.69 indicating a large range of prices.1 Therefore, the prices of
shoes vary over a wide range of prices for both females and males. The wide range is
supported by the large values of coefficient of variation. For females 54.22% of the prices are
close to the average price while for males 49.01% of the prices are close to the average price.
The median price of female shoes is equivalent to the average price an indication that
there are no extreme prices. However, the median for prices of male shoe’s is slightly higher
than the average an indication that the male shoe prices are characterized by extreme prices.
1 Grant, Aneurin, Robert Ries, and Carla Thompson. "Quantitative approaches in life cycle assessment
—part 1—descriptive statistics and factor analysis." The International Journal of Life Cycle Assessment 21, no.
6 (2016): 903-911.
Paraphrase This Document
Need a fresh take? Get an instant paraphrase of this document with our AI Paraphraser
4
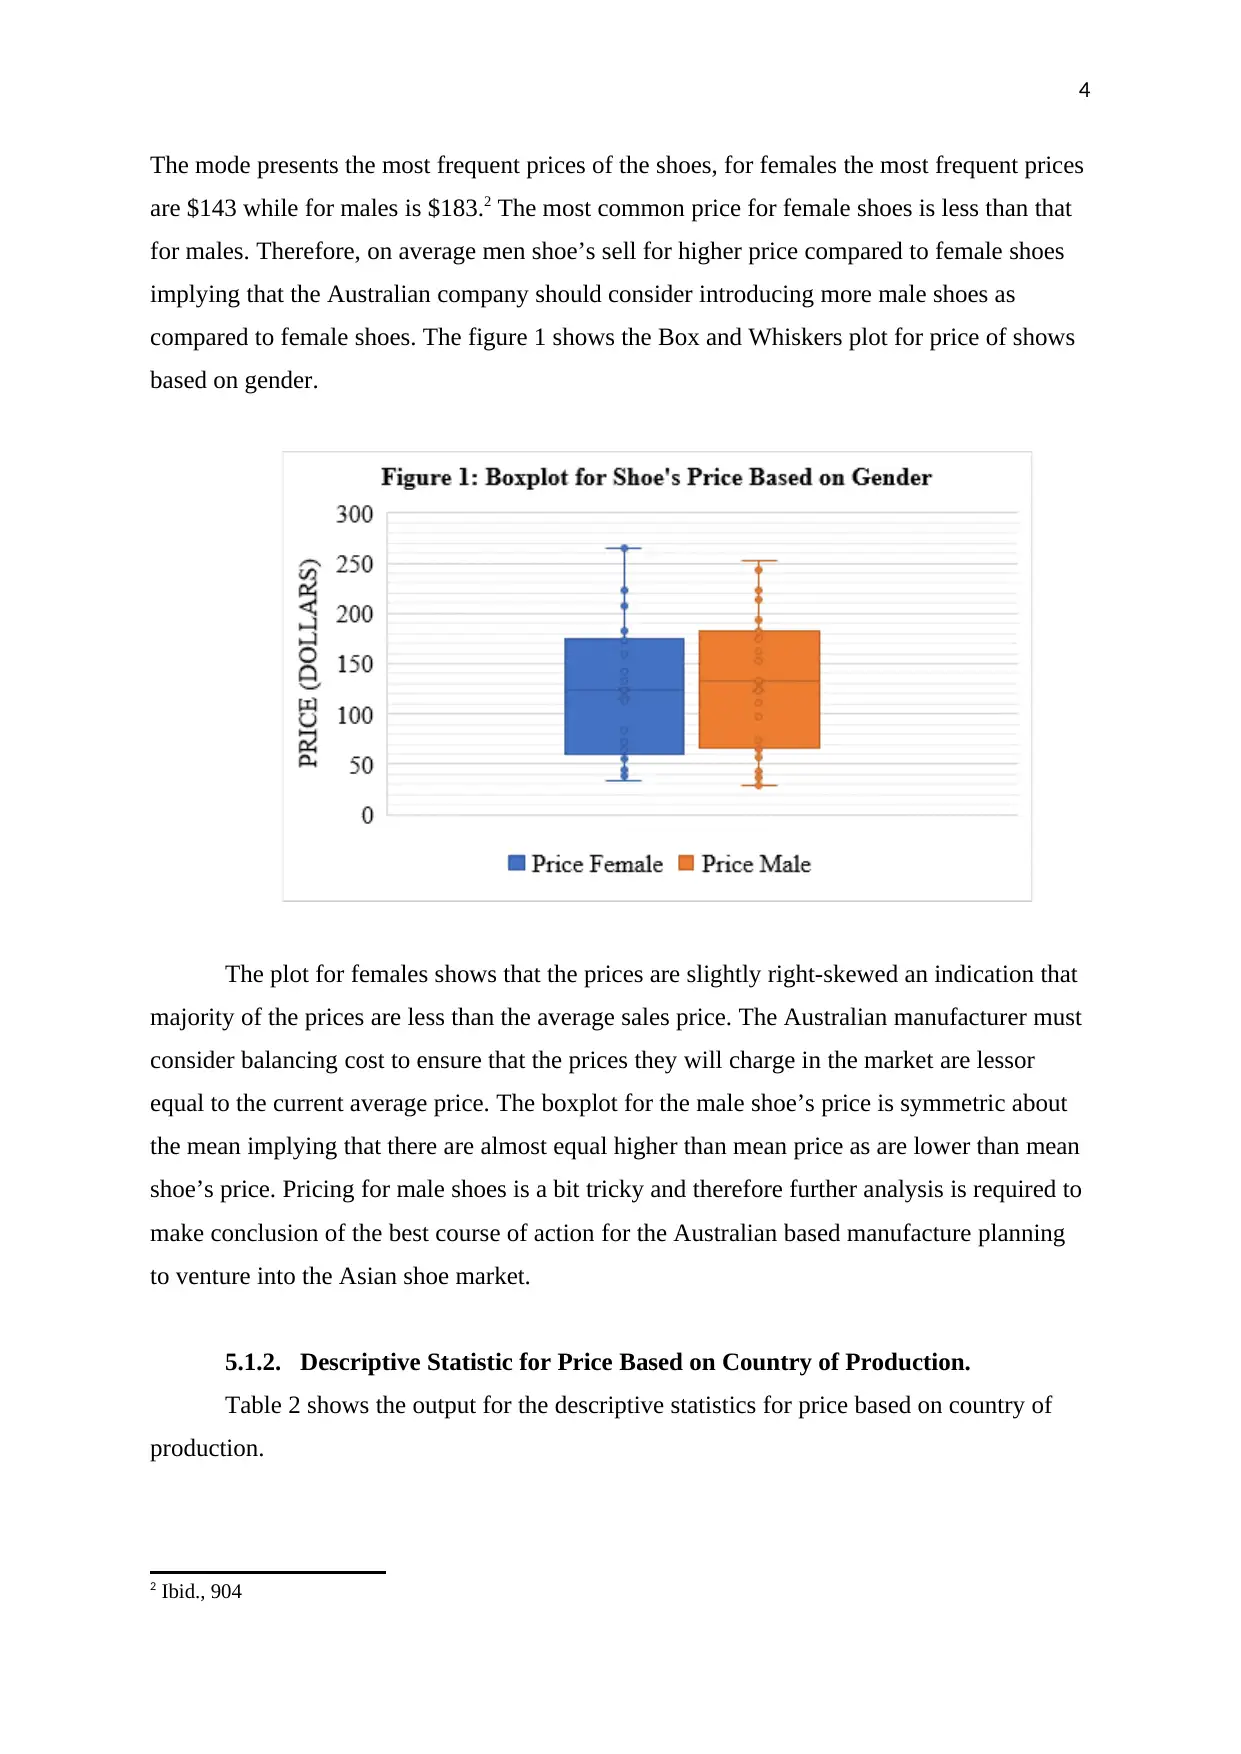
The mode presents the most frequent prices of the shoes, for females the most frequent prices
are $143 while for males is $183.2 The most common price for female shoes is less than that
for males. Therefore, on average men shoe’s sell for higher price compared to female shoes
implying that the Australian company should consider introducing more male shoes as
compared to female shoes. The figure 1 shows the Box and Whiskers plot for price of shows
based on gender.
The plot for females shows that the prices are slightly right-skewed an indication that
majority of the prices are less than the average sales price. The Australian manufacturer must
consider balancing cost to ensure that the prices they will charge in the market are lessor
equal to the current average price. The boxplot for the male shoe’s price is symmetric about
the mean implying that there are almost equal higher than mean price as are lower than mean
shoe’s price. Pricing for male shoes is a bit tricky and therefore further analysis is required to
make conclusion of the best course of action for the Australian based manufacture planning
to venture into the Asian shoe market.
5.1.2. Descriptive Statistic for Price Based on Country of Production.
Table 2 shows the output for the descriptive statistics for price based on country of
production.
2 Ibid., 904
5
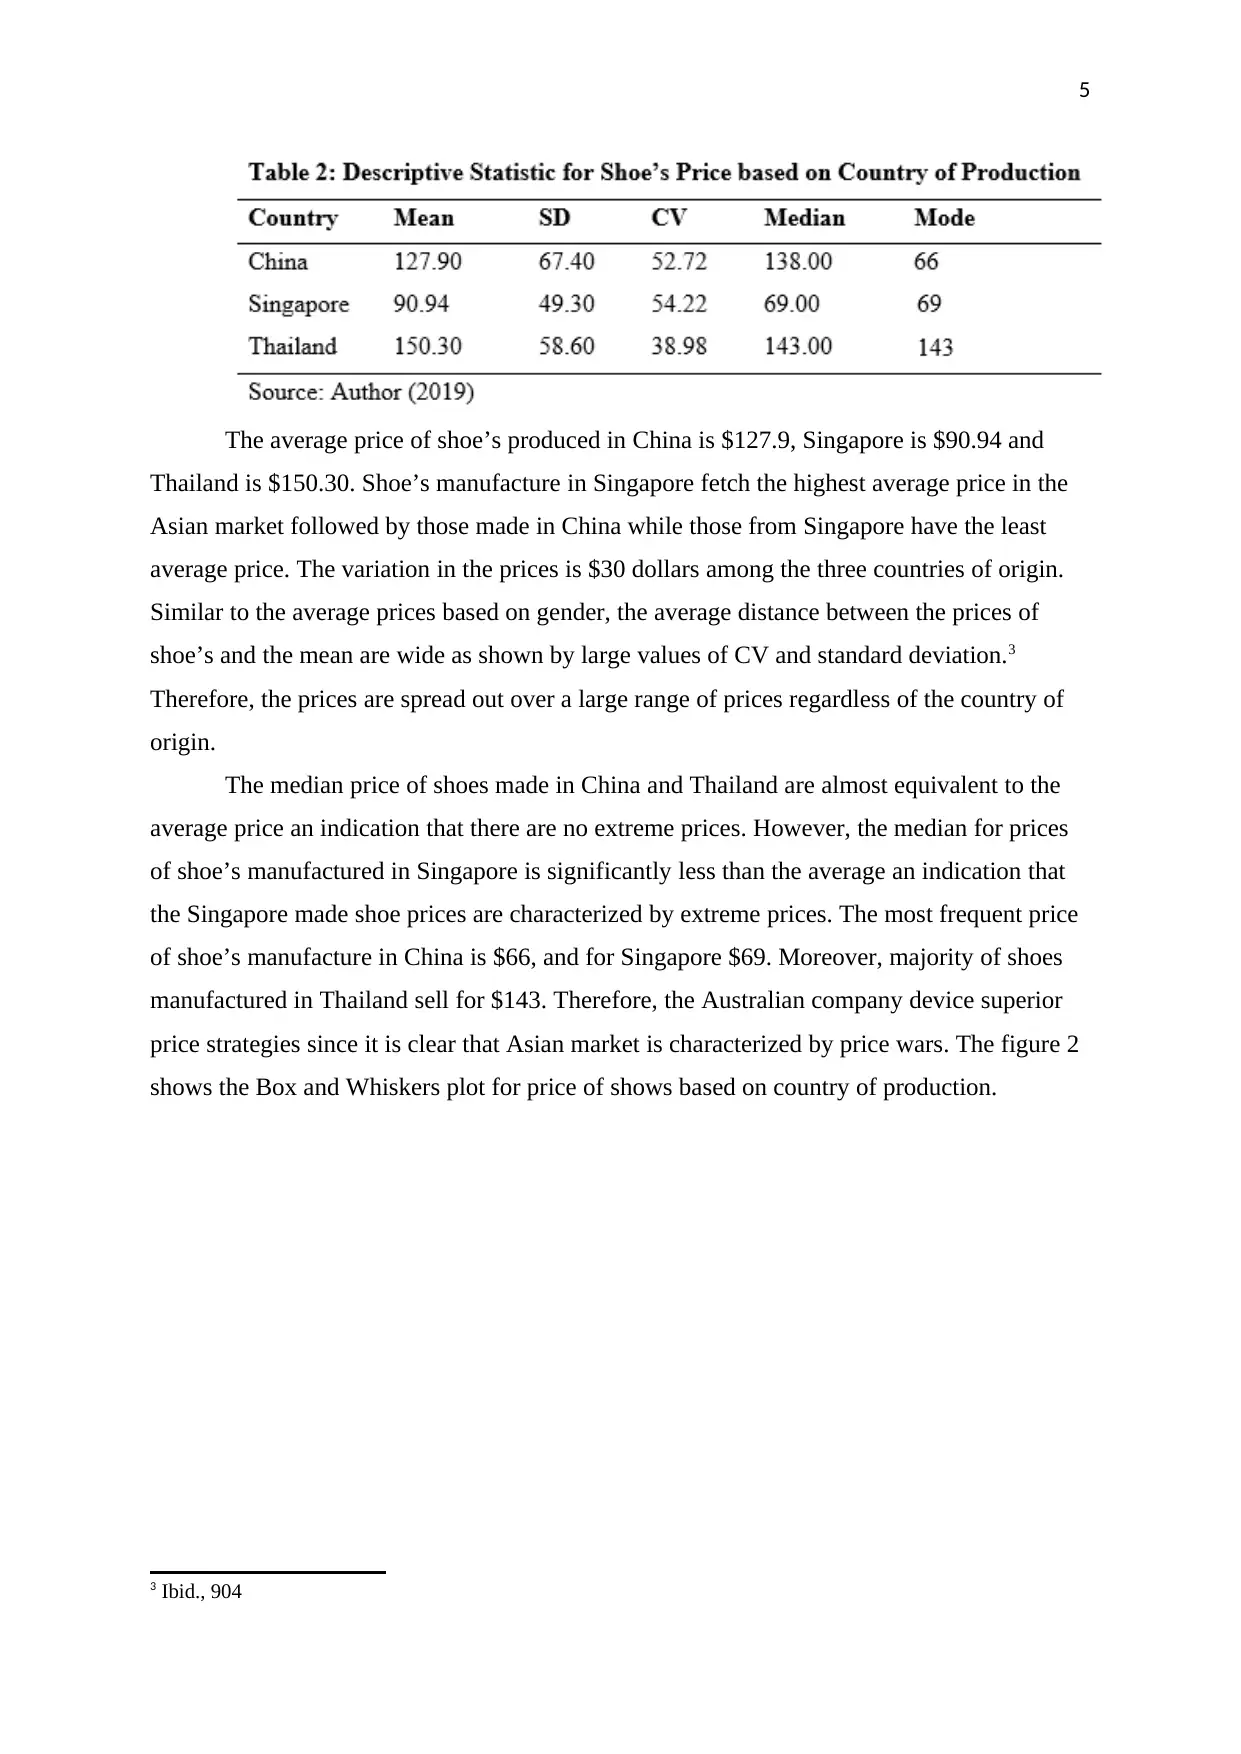
The average price of shoe’s produced in China is $127.9, Singapore is $90.94 and
Thailand is $150.30. Shoe’s manufacture in Singapore fetch the highest average price in the
Asian market followed by those made in China while those from Singapore have the least
average price. The variation in the prices is $30 dollars among the three countries of origin.
Similar to the average prices based on gender, the average distance between the prices of
shoe’s and the mean are wide as shown by large values of CV and standard deviation.3
Therefore, the prices are spread out over a large range of prices regardless of the country of
origin.
The median price of shoes made in China and Thailand are almost equivalent to the
average price an indication that there are no extreme prices. However, the median for prices
of shoe’s manufactured in Singapore is significantly less than the average an indication that
the Singapore made shoe prices are characterized by extreme prices. The most frequent price
of shoe’s manufacture in China is $66, and for Singapore $69. Moreover, majority of shoes
manufactured in Thailand sell for $143. Therefore, the Australian company device superior
price strategies since it is clear that Asian market is characterized by price wars. The figure 2
shows the Box and Whiskers plot for price of shows based on country of production.
3 Ibid., 904
⊘ This is a preview!⊘
Do you want full access?
Subscribe today to unlock all pages.
Trusted by 1+ million students worldwide
6
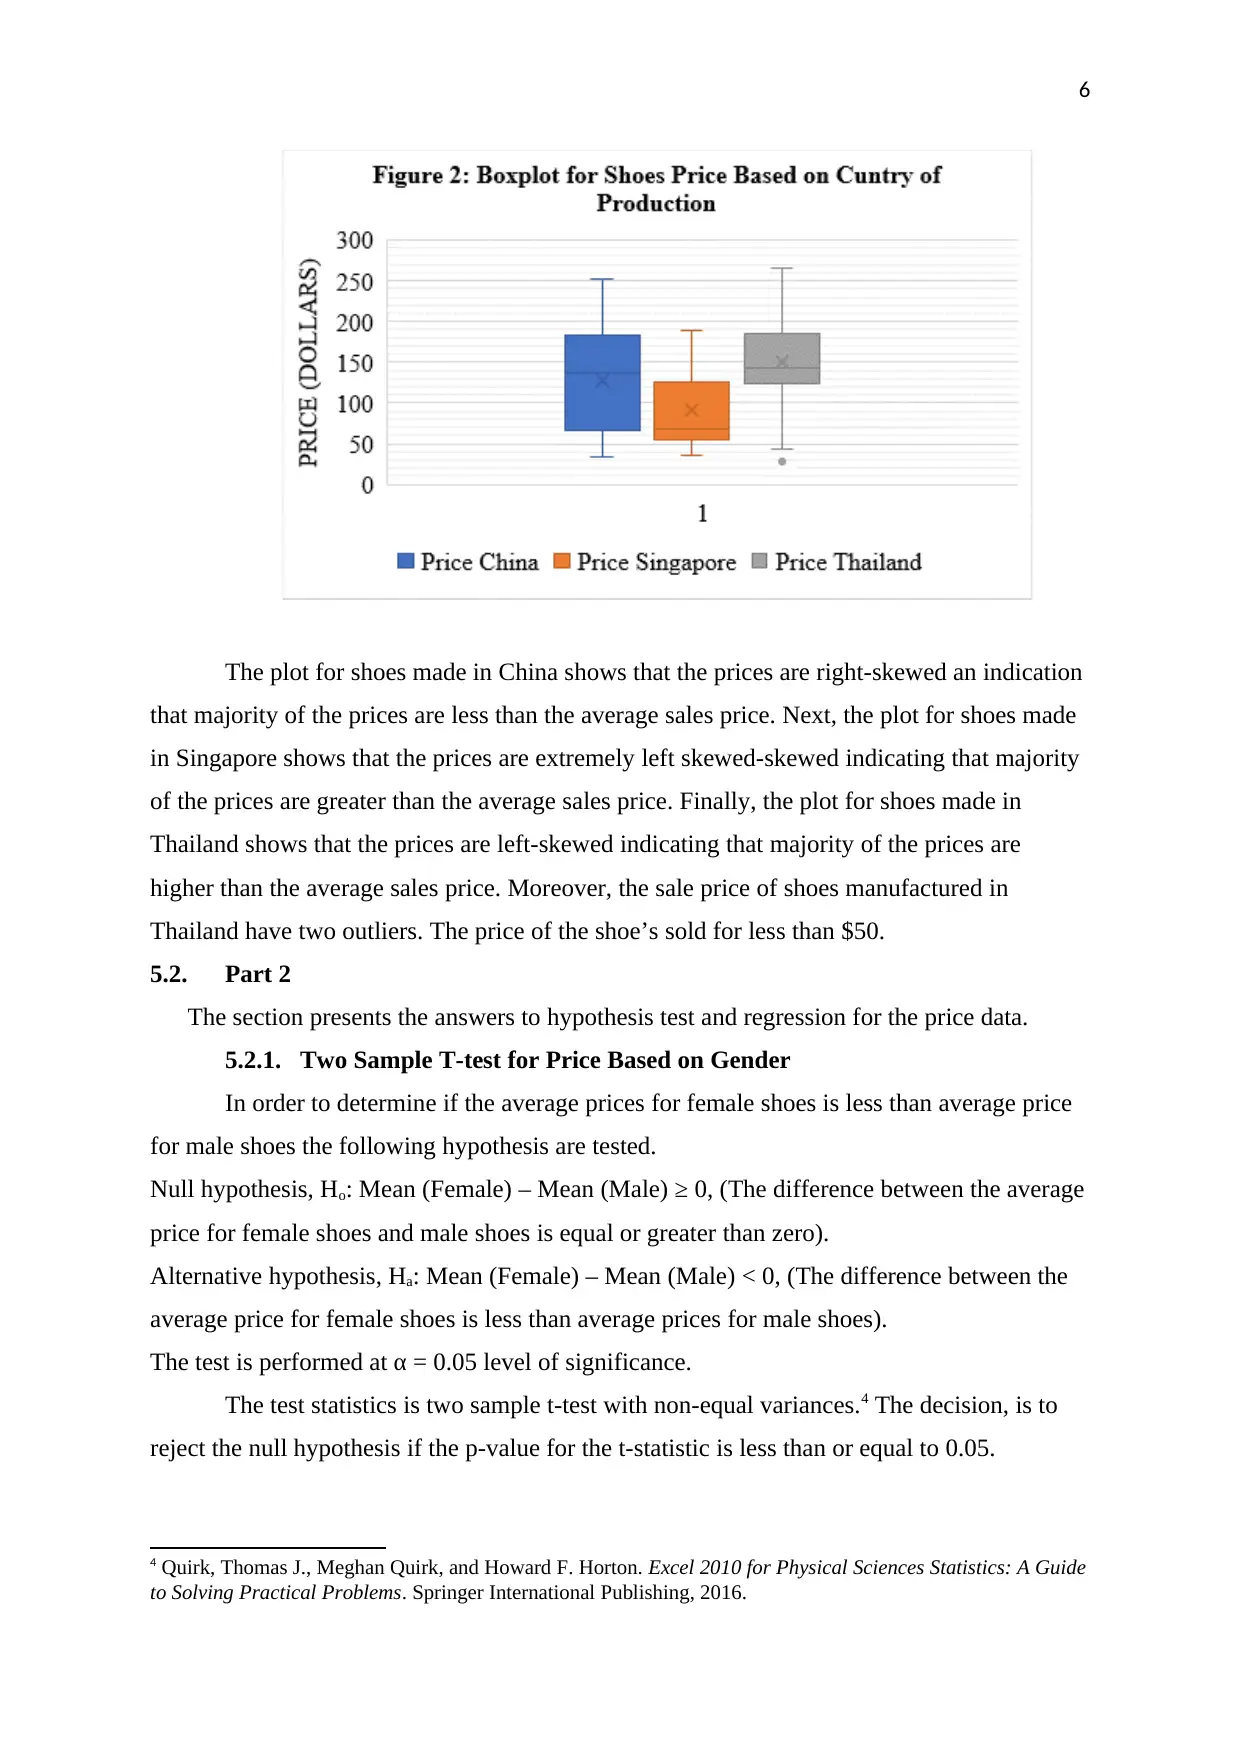
The plot for shoes made in China shows that the prices are right-skewed an indication
that majority of the prices are less than the average sales price. Next, the plot for shoes made
in Singapore shows that the prices are extremely left skewed-skewed indicating that majority
of the prices are greater than the average sales price. Finally, the plot for shoes made in
Thailand shows that the prices are left-skewed indicating that majority of the prices are
higher than the average sales price. Moreover, the sale price of shoes manufactured in
Thailand have two outliers. The price of the shoe’s sold for less than $50.
5.2. Part 2
The section presents the answers to hypothesis test and regression for the price data.
5.2.1. Two Sample T-test for Price Based on Gender
In order to determine if the average prices for female shoes is less than average price
for male shoes the following hypothesis are tested.
Null hypothesis, Ho: Mean (Female) – Mean (Male) ≥ 0, (The difference between the average
price for female shoes and male shoes is equal or greater than zero).
Alternative hypothesis, Ha: Mean (Female) – Mean (Male) < 0, (The difference between the
average price for female shoes is less than average prices for male shoes).
The test is performed at α = 0.05 level of significance.
The test statistics is two sample t-test with non-equal variances.4 The decision, is to
reject the null hypothesis if the p-value for the t-statistic is less than or equal to 0.05.
4 Quirk, Thomas J., Meghan Quirk, and Howard F. Horton. Excel 2010 for Physical Sciences Statistics: A Guide
to Solving Practical Problems. Springer International Publishing, 2016.
Paraphrase This Document
Need a fresh take? Get an instant paraphrase of this document with our AI Paraphraser
7
The analysis produced a t-value = -0.5996 at 48 degrees of freedom with corresponding p-
value of 0.2758. The p-value is greater than α = 0.05, then at 95% significance level fail to
reject the null hypothesis (The difference between the average price for female shoes and
male shoes is equal or greater than zero) and conclude that the claim of average prices for
female shoes being less than that for males is insignificant. In part 5.1.1 the average price for
females was less than the average price for males therefore, the results of the hypothesis test
does not confirm the conclusion in 5.1.1.
5.2.2. Test of Mean Price Difference between Countries of Production
In order to determine if the average prices for shoes manufacture in China, Singapore
and Thailand are different then the following hypothesis are tested.
Null hypothesis, Ho: Mean (China) = Mean (Singapore) = Mean (Thailand), (All means are
equal).
Alternative hypothesis, Ha: At least one mean is different.
The test is performed at α = 0.05 level of significance.
The test statistics is one-way analysis of variance (ANOVA) with non-equal
variances.5 The decision, is to reject the null hypothesis if the p-value for the F-statistic is less
than or equal to 0.05.
The analysis produced a F-value = 8.5460 with corresponding p-value of 0.0003. The
p-value is less than α = 0.05, then at 95% significance level reject the null hypothesis (all
means are equal) and conclude that at least the average prices for shoes produced in one of
the country’s is different from that of a competing country. being less than that for males is
insignificant. In part 5.1.2 the average price for shoes manufactured in Thailand was greater
than those made in China and Singapore therefore, the results of the hypothesis test confirm
the conclusion in 5.1.2.
5.2.3. Scatter Plot for Price Against Cost
The figure 3 shows the scatter plot for the price of shoes against the production cost in
China, Singapore and Thailand.
5 Ibid., 15
8
0 20 40 60 80 100 120 140 160 180 200
0
50
100
150
200
250
300
Figure 3: Scatter Plot of Price against Cost
Cost (dollars)
Price (dollars)
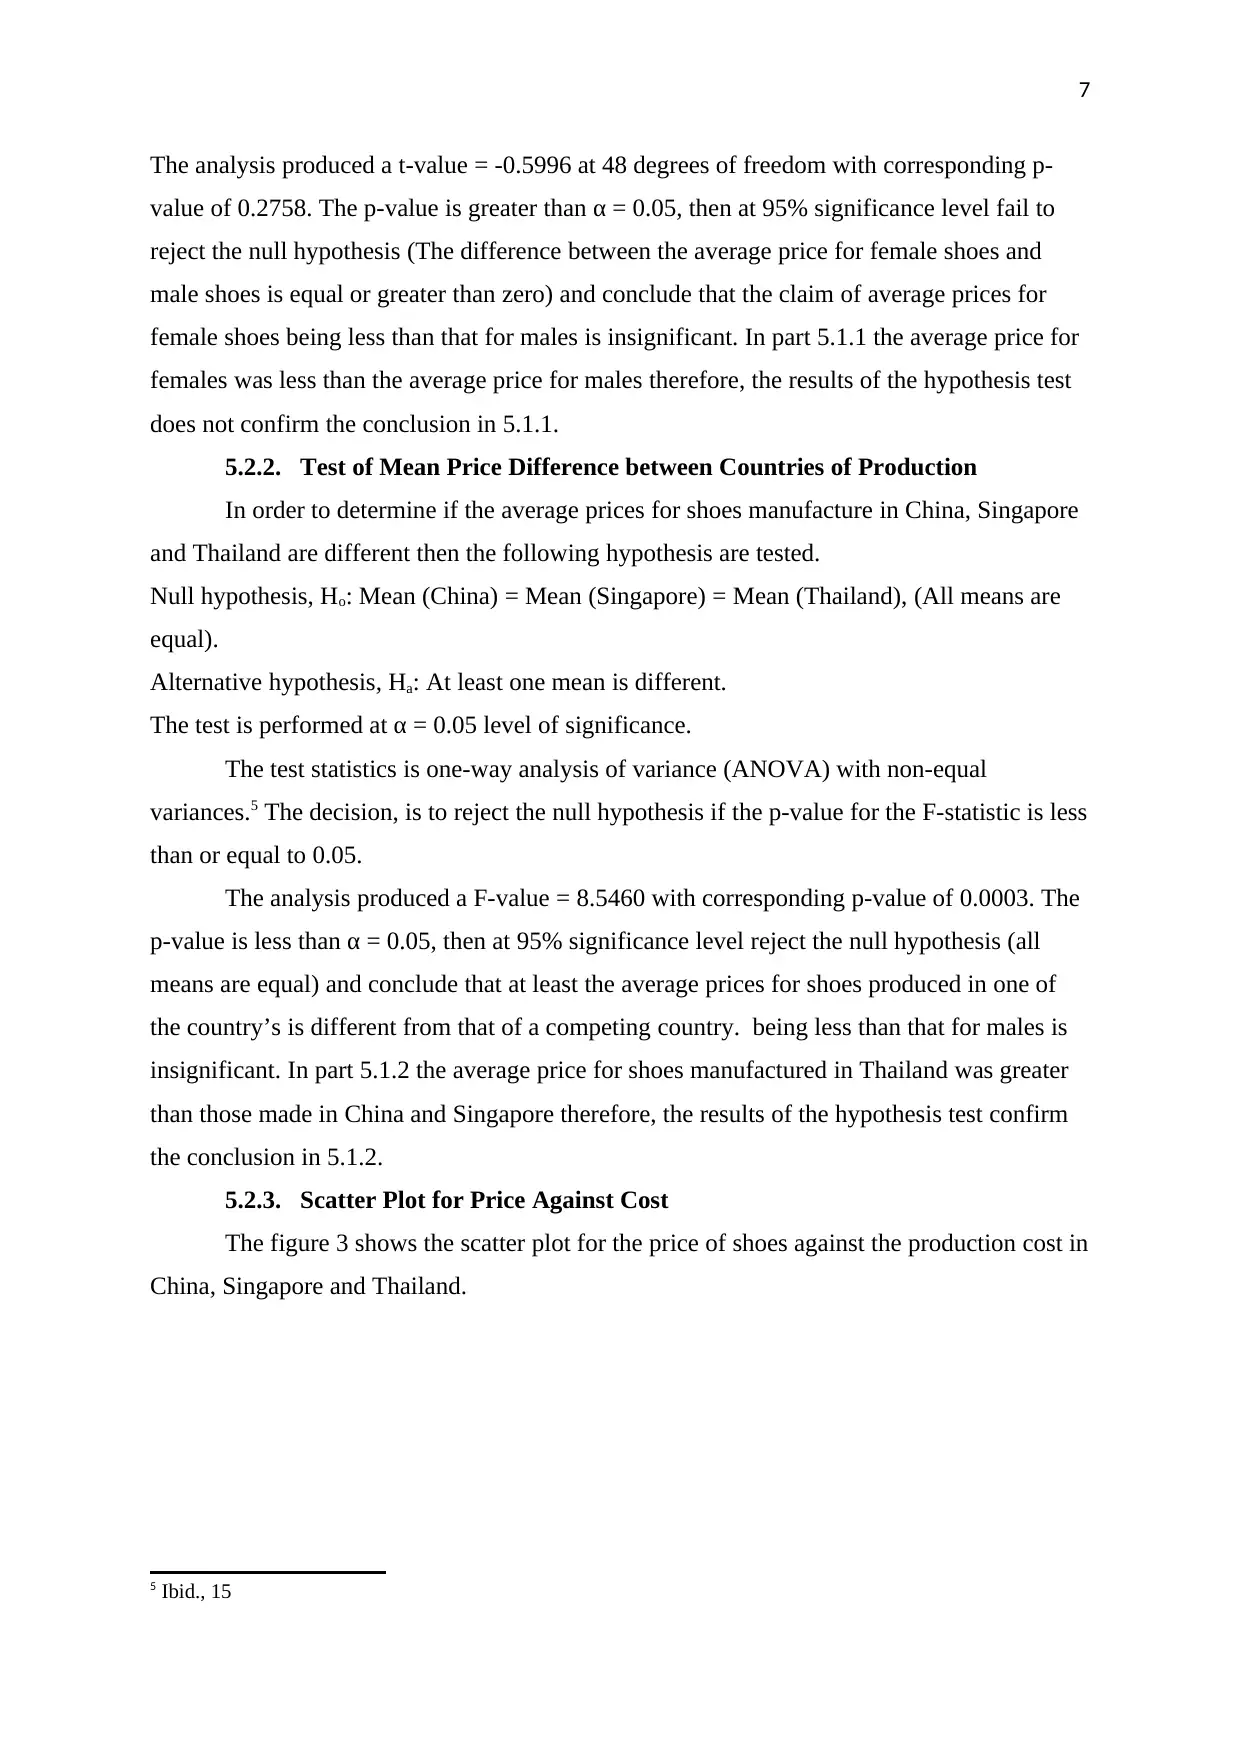
The scatter plot does not show an outright pattern but, a linear trend can be inferred
since lower values of price are associated with lower values of cost. Therefore, the higher the
cost of production the higher the price of the shoe in the Asian market.
5.2.4. Simple Linear Regression for Price and Cost data
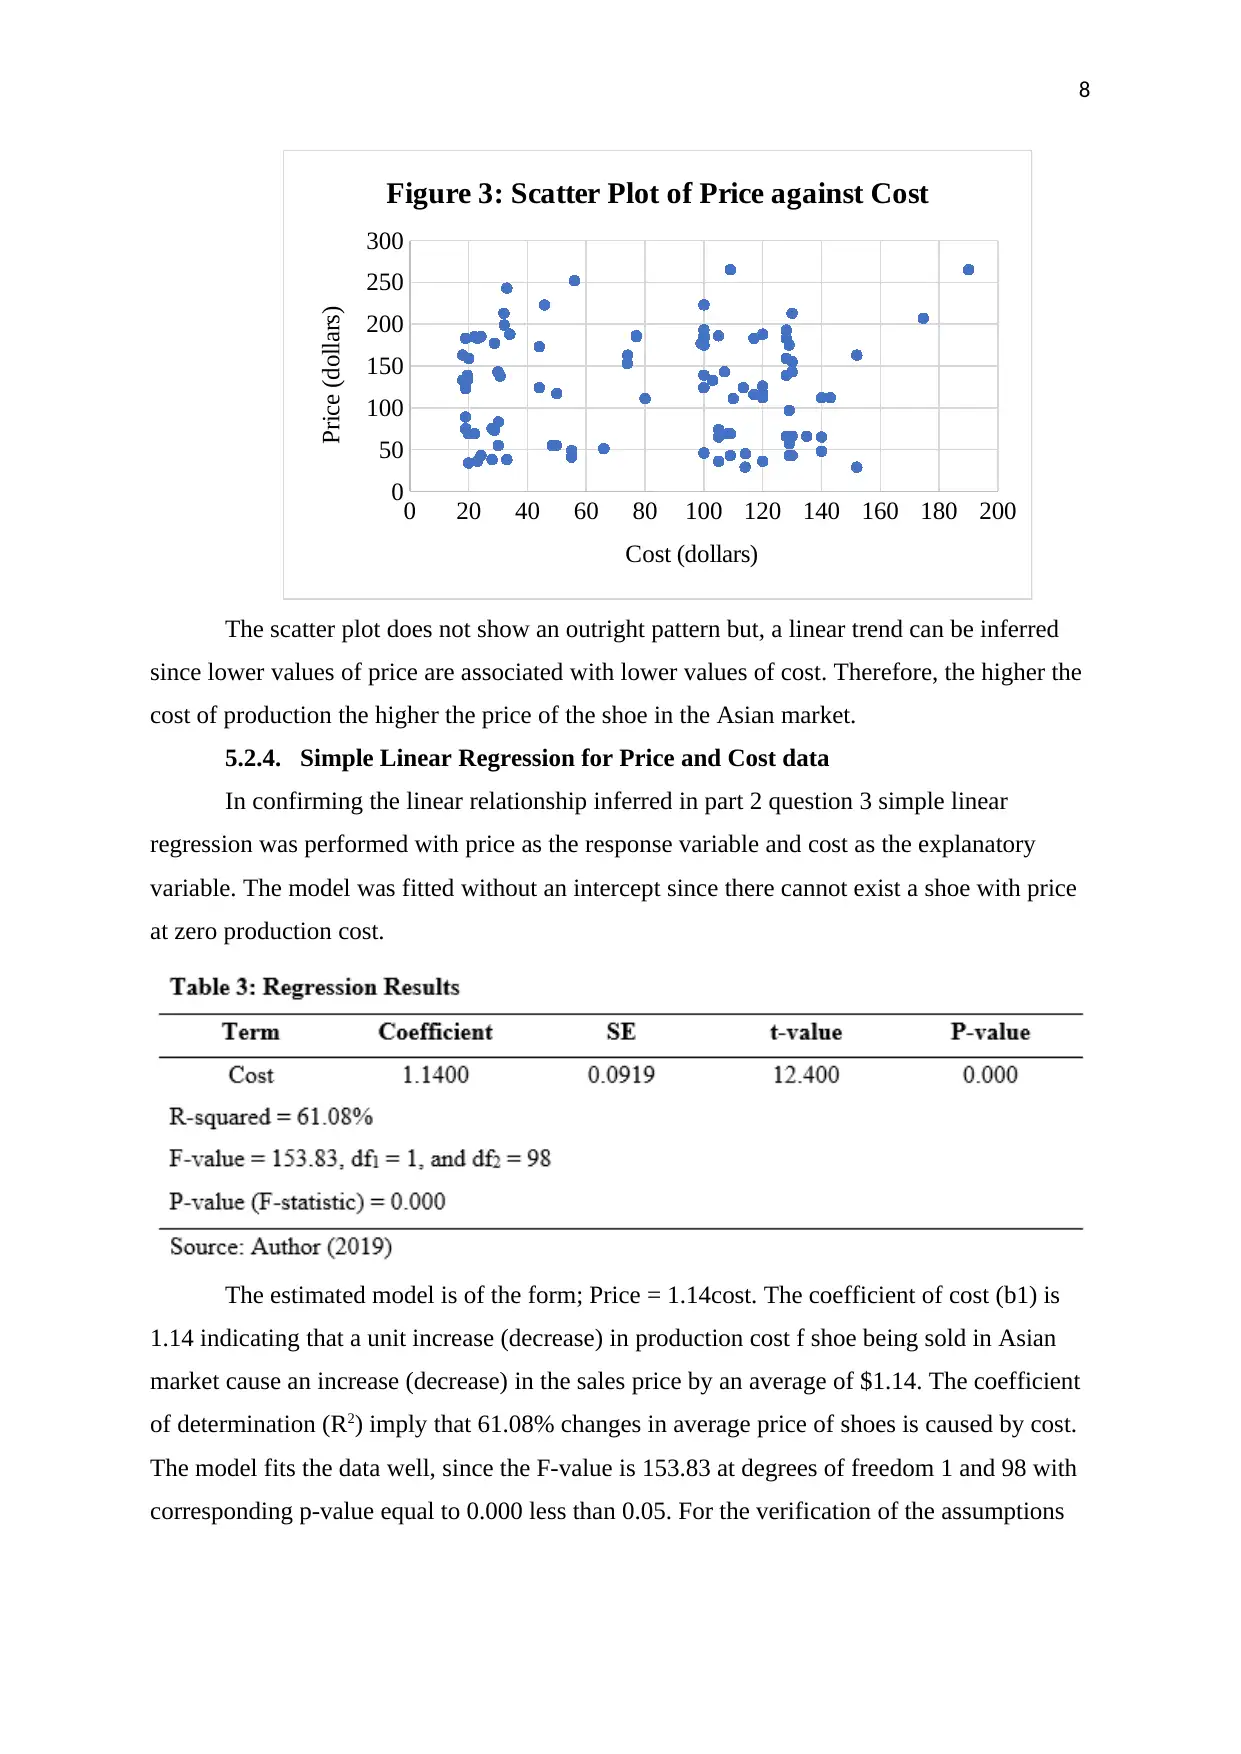
In confirming the linear relationship inferred in part 2 question 3 simple linear
regression was performed with price as the response variable and cost as the explanatory
variable. The model was fitted without an intercept since there cannot exist a shoe with price
at zero production cost.
The estimated model is of the form; Price = 1.14cost. The coefficient of cost (b1) is
1.14 indicating that a unit increase (decrease) in production cost f shoe being sold in Asian
market cause an increase (decrease) in the sales price by an average of $1.14. The coefficient
of determination (R2) imply that 61.08% changes in average price of shoes is caused by cost.
The model fits the data well, since the F-value is 153.83 at degrees of freedom 1 and 98 with
corresponding p-value equal to 0.000 less than 0.05. For the verification of the assumptions
0 20 40 60 80 100 120 140 160 180 200
0
50
100
150
200
250
300
Figure 3: Scatter Plot of Price against Cost
Cost (dollars)
Price (dollars)
The scatter plot does not show an outright pattern but, a linear trend can be inferred
since lower values of price are associated with lower values of cost. Therefore, the higher the
cost of production the higher the price of the shoe in the Asian market.
5.2.4. Simple Linear Regression for Price and Cost data
In confirming the linear relationship inferred in part 2 question 3 simple linear
regression was performed with price as the response variable and cost as the explanatory
variable. The model was fitted without an intercept since there cannot exist a shoe with price
at zero production cost.
The estimated model is of the form; Price = 1.14cost. The coefficient of cost (b1) is
1.14 indicating that a unit increase (decrease) in production cost f shoe being sold in Asian
market cause an increase (decrease) in the sales price by an average of $1.14. The coefficient
of determination (R2) imply that 61.08% changes in average price of shoes is caused by cost.
The model fits the data well, since the F-value is 153.83 at degrees of freedom 1 and 98 with
corresponding p-value equal to 0.000 less than 0.05. For the verification of the assumptions
⊘ This is a preview!⊘
Do you want full access?
Subscribe today to unlock all pages.
Trusted by 1+ million students worldwide
9
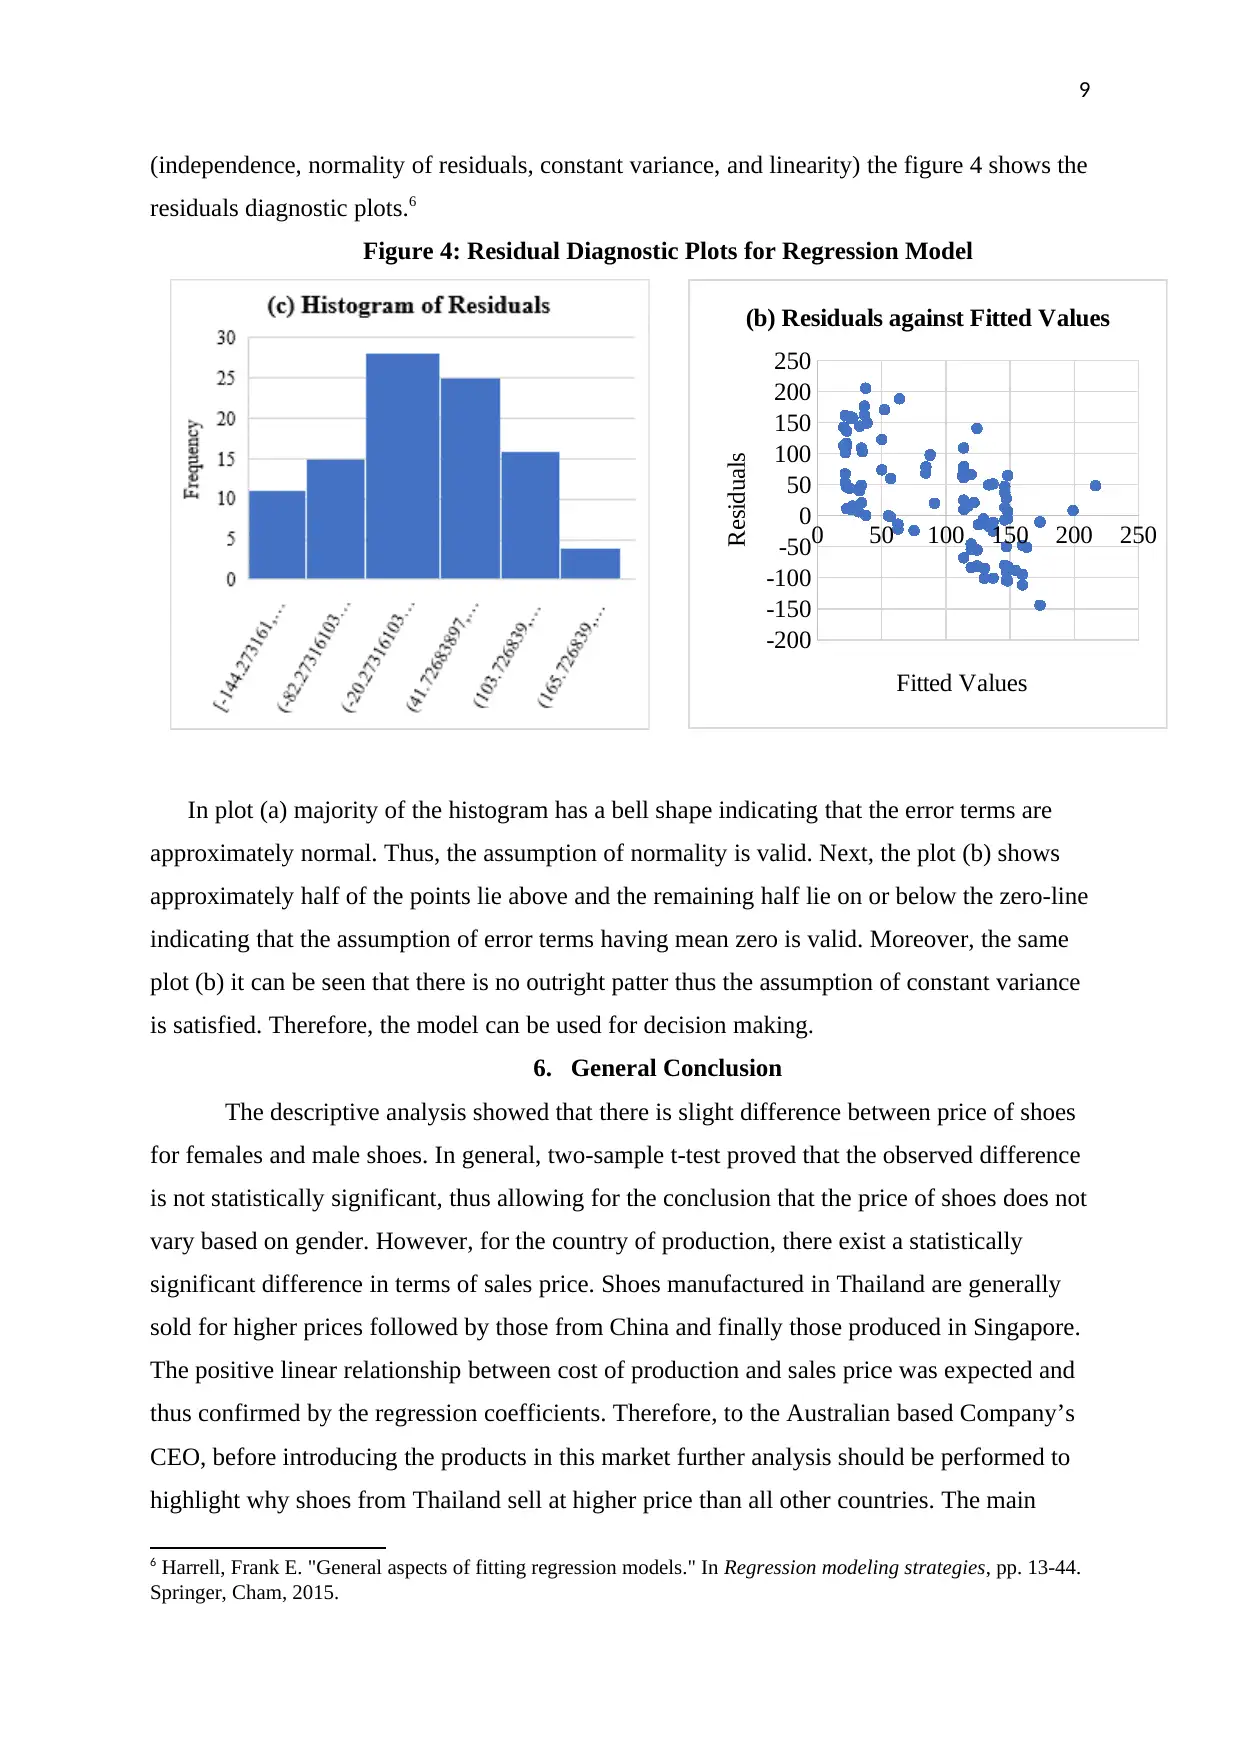
(independence, normality of residuals, constant variance, and linearity) the figure 4 shows the
residuals diagnostic plots.6
Figure 4: Residual Diagnostic Plots for Regression Model
0 50 100 150 200 250
-200
-150
-100
-50
0
50
100
150
200
250
(b) Residuals against Fitted Values
Fitted Values
Residuals
In plot (a) majority of the histogram has a bell shape indicating that the error terms are
approximately normal. Thus, the assumption of normality is valid. Next, the plot (b) shows
approximately half of the points lie above and the remaining half lie on or below the zero-line
indicating that the assumption of error terms having mean zero is valid. Moreover, the same
plot (b) it can be seen that there is no outright patter thus the assumption of constant variance
is satisfied. Therefore, the model can be used for decision making.
6. General Conclusion
The descriptive analysis showed that there is slight difference between price of shoes
for females and male shoes. In general, two-sample t-test proved that the observed difference
is not statistically significant, thus allowing for the conclusion that the price of shoes does not
vary based on gender. However, for the country of production, there exist a statistically
significant difference in terms of sales price. Shoes manufactured in Thailand are generally
sold for higher prices followed by those from China and finally those produced in Singapore.
The positive linear relationship between cost of production and sales price was expected and
thus confirmed by the regression coefficients. Therefore, to the Australian based Company’s
CEO, before introducing the products in this market further analysis should be performed to
highlight why shoes from Thailand sell at higher price than all other countries. The main
6 Harrell, Frank E. "General aspects of fitting regression models." In Regression modeling strategies, pp. 13-44.
Springer, Cham, 2015.
Paraphrase This Document
Need a fresh take? Get an instant paraphrase of this document with our AI Paraphraser
10
limitation is the inferred liner relationship between price and cost. The relationship should be
proved using Pearson’s coefficient of correlation. Moreover, the sample size is very small
thus more data should be collected to improve the percentage of variation in price explained
by the independent variables. However, the Australian company should introduce more
male’s shoes in the Asian shoe’s market.
11
7. Bibliography
Grant, Aneurin, Robert Ries, and Carla Thompson. "Quantitative approaches in life cycle
assessment—part 1—descriptive statistics and factor analysis." The International
Journal of Life Cycle Assessment 21, no. 6 (2016): 903-911.
Harrell, Frank E. "General aspects of fitting regression models." In Regression modeling
strategies, pp. 13-44. Springer, Cham, 2015.
Quirk, Thomas J., Meghan Quirk, and Howard F. Horton. Excel 2010 for Physical Sciences
Statistics: A Guide to Solving Practical Problems. Springer International Publishing,
2016.
⊘ This is a preview!⊘
Do you want full access?
Subscribe today to unlock all pages.
Trusted by 1+ million students worldwide
1 out of 15
Related Documents


Your All-in-One AI-Powered Toolkit for Academic Success.
+13062052269
info@desklib.com
Available 24*7 on WhatsApp / Email
![[object Object]](/_next/static/media/star-bottom.7253800d.svg)
Unlock your academic potential
Copyright © 2020–2026 A2Z Services. All Rights Reserved. Developed and managed by ZUCOL.