SAS Assignment: Data Analysis of Basketball and US Presidents
VerifiedAdded on 2023/02/01
|5
|1590
|81
Homework Assignment
AI Summary
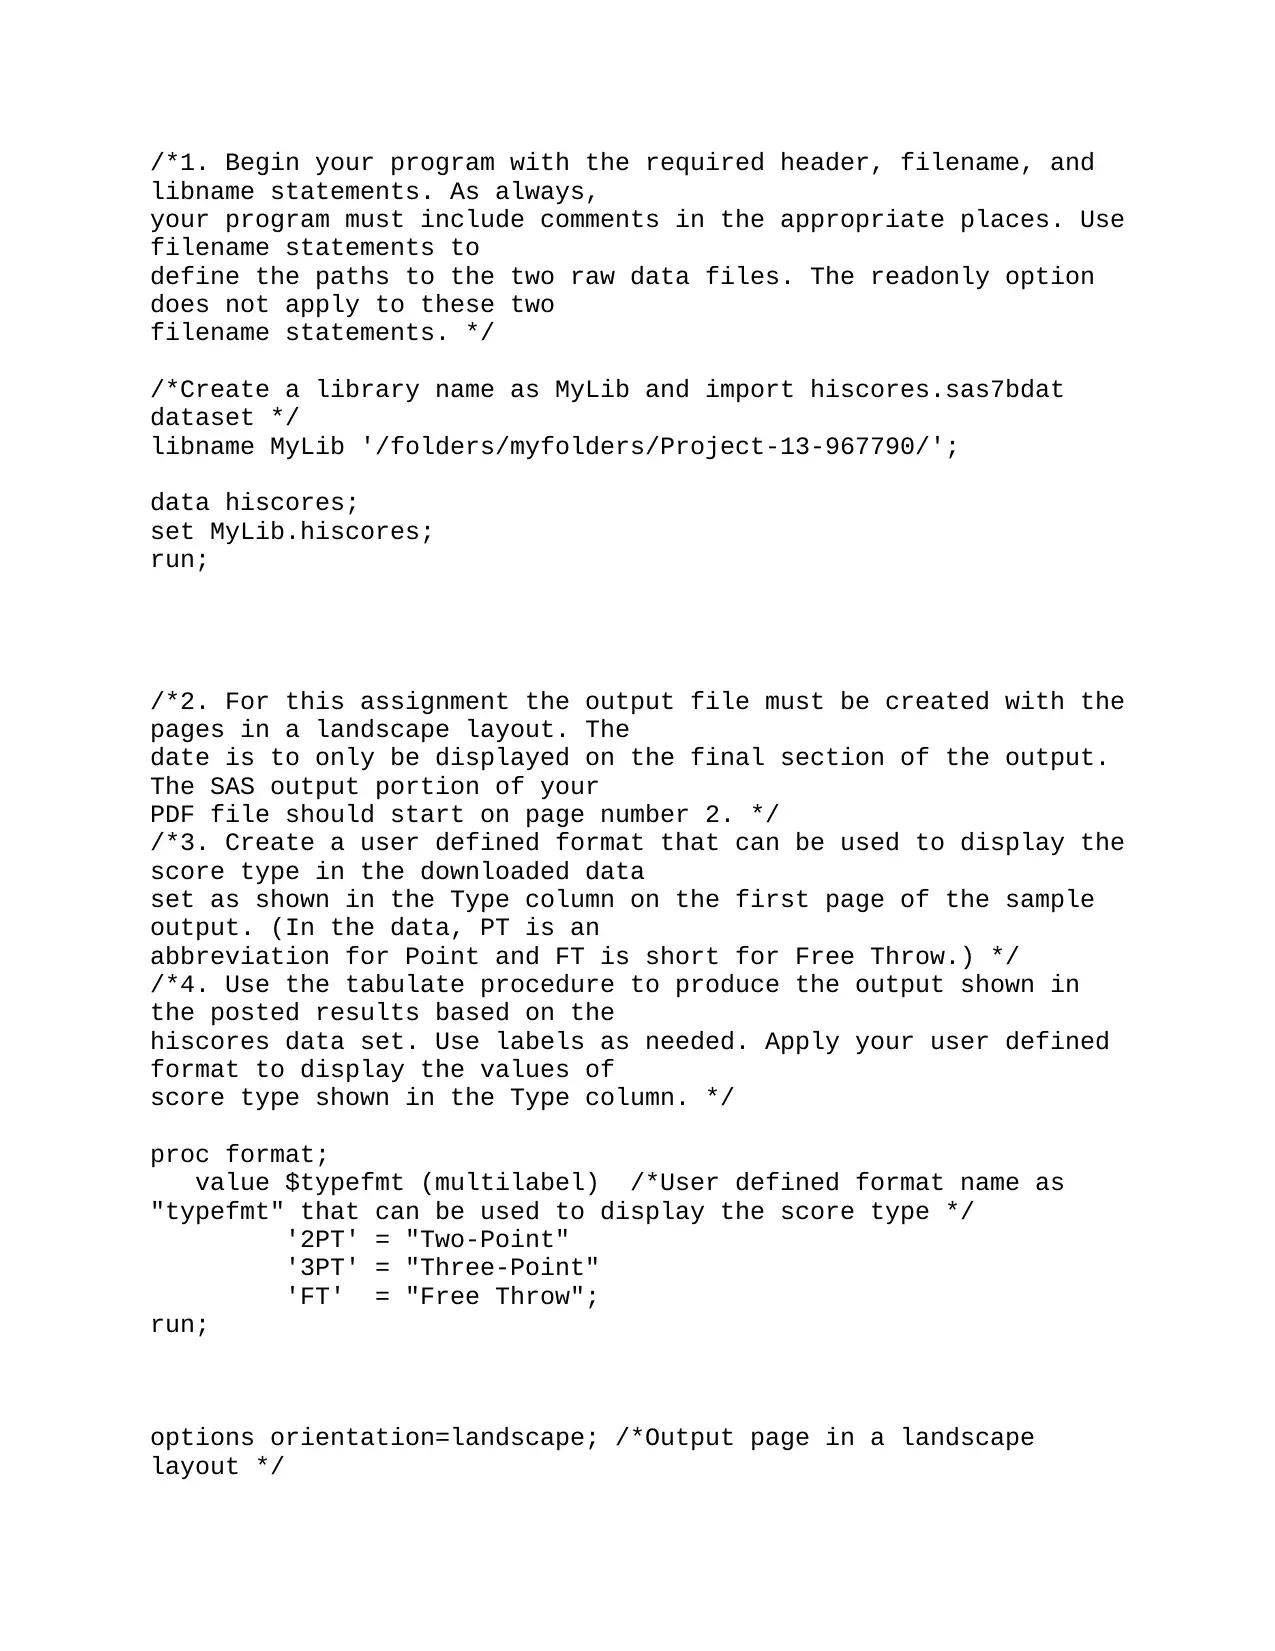
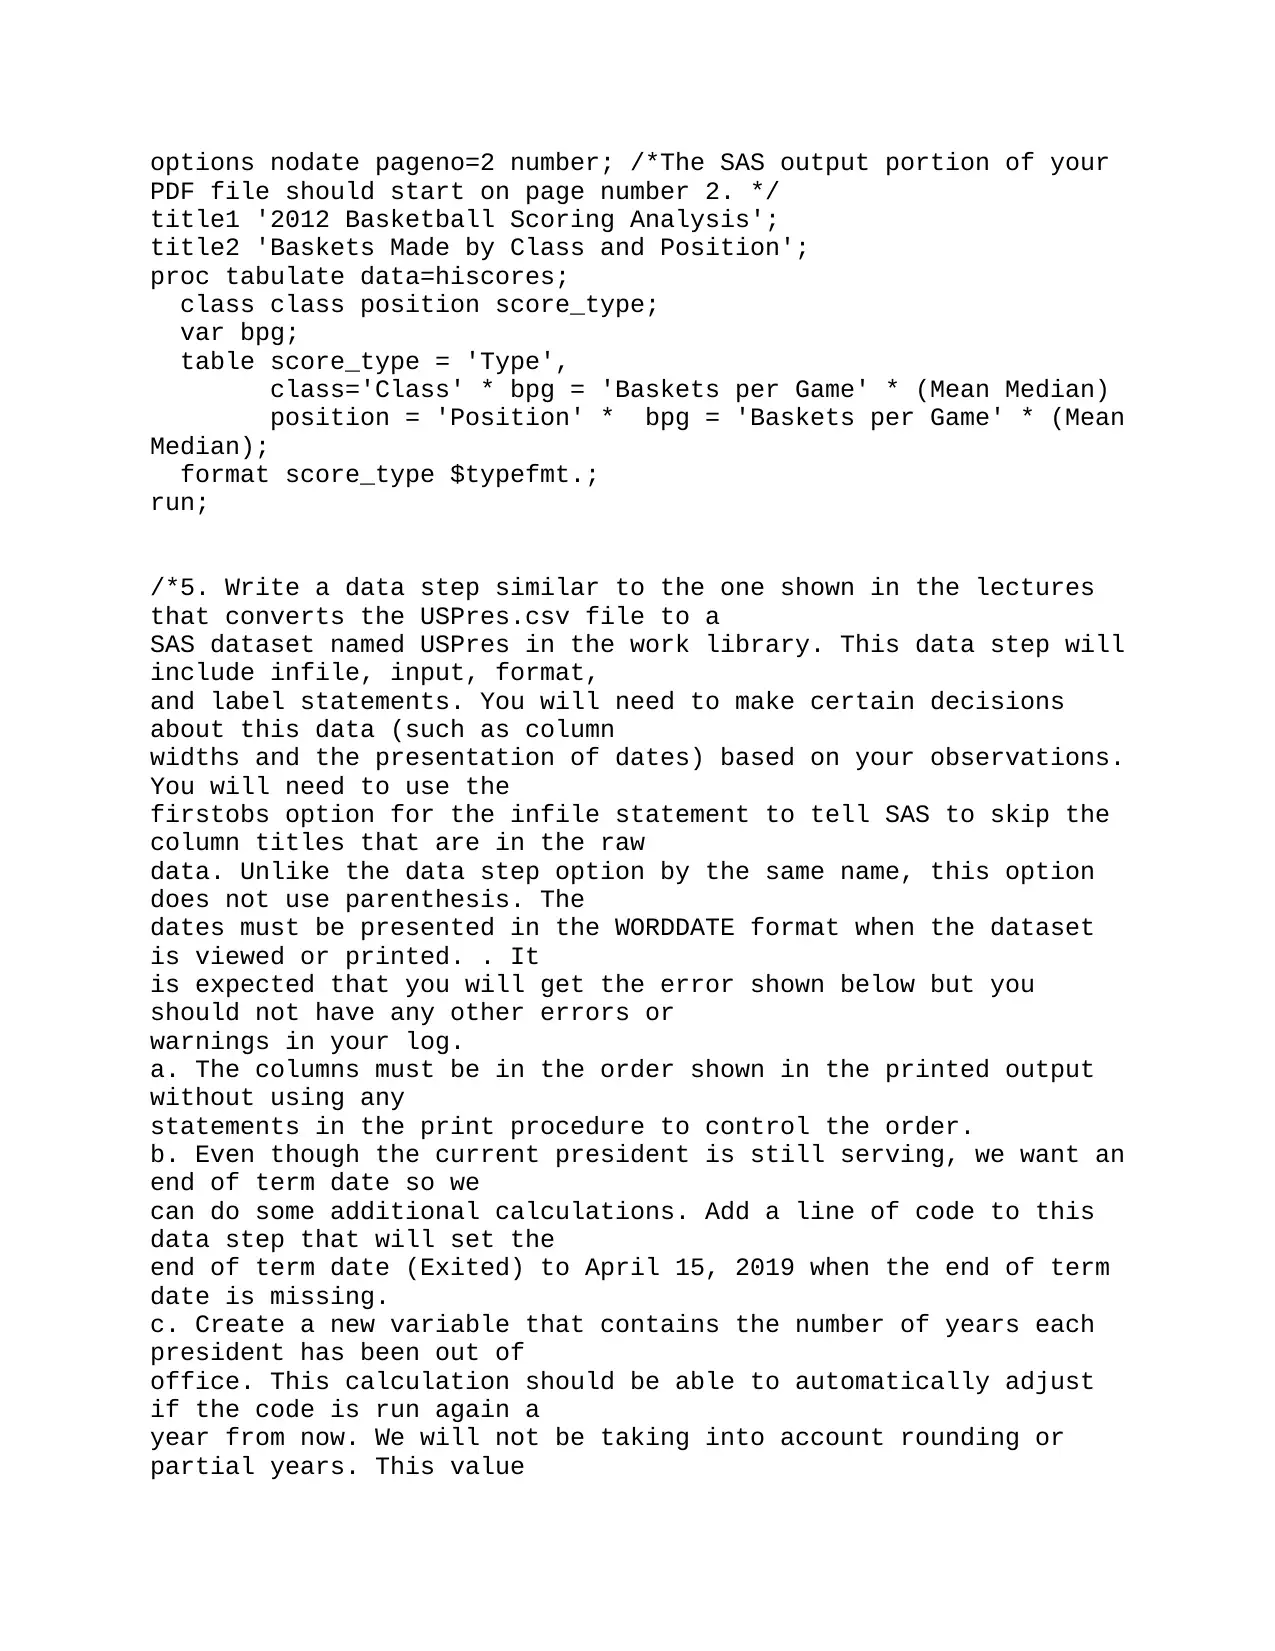
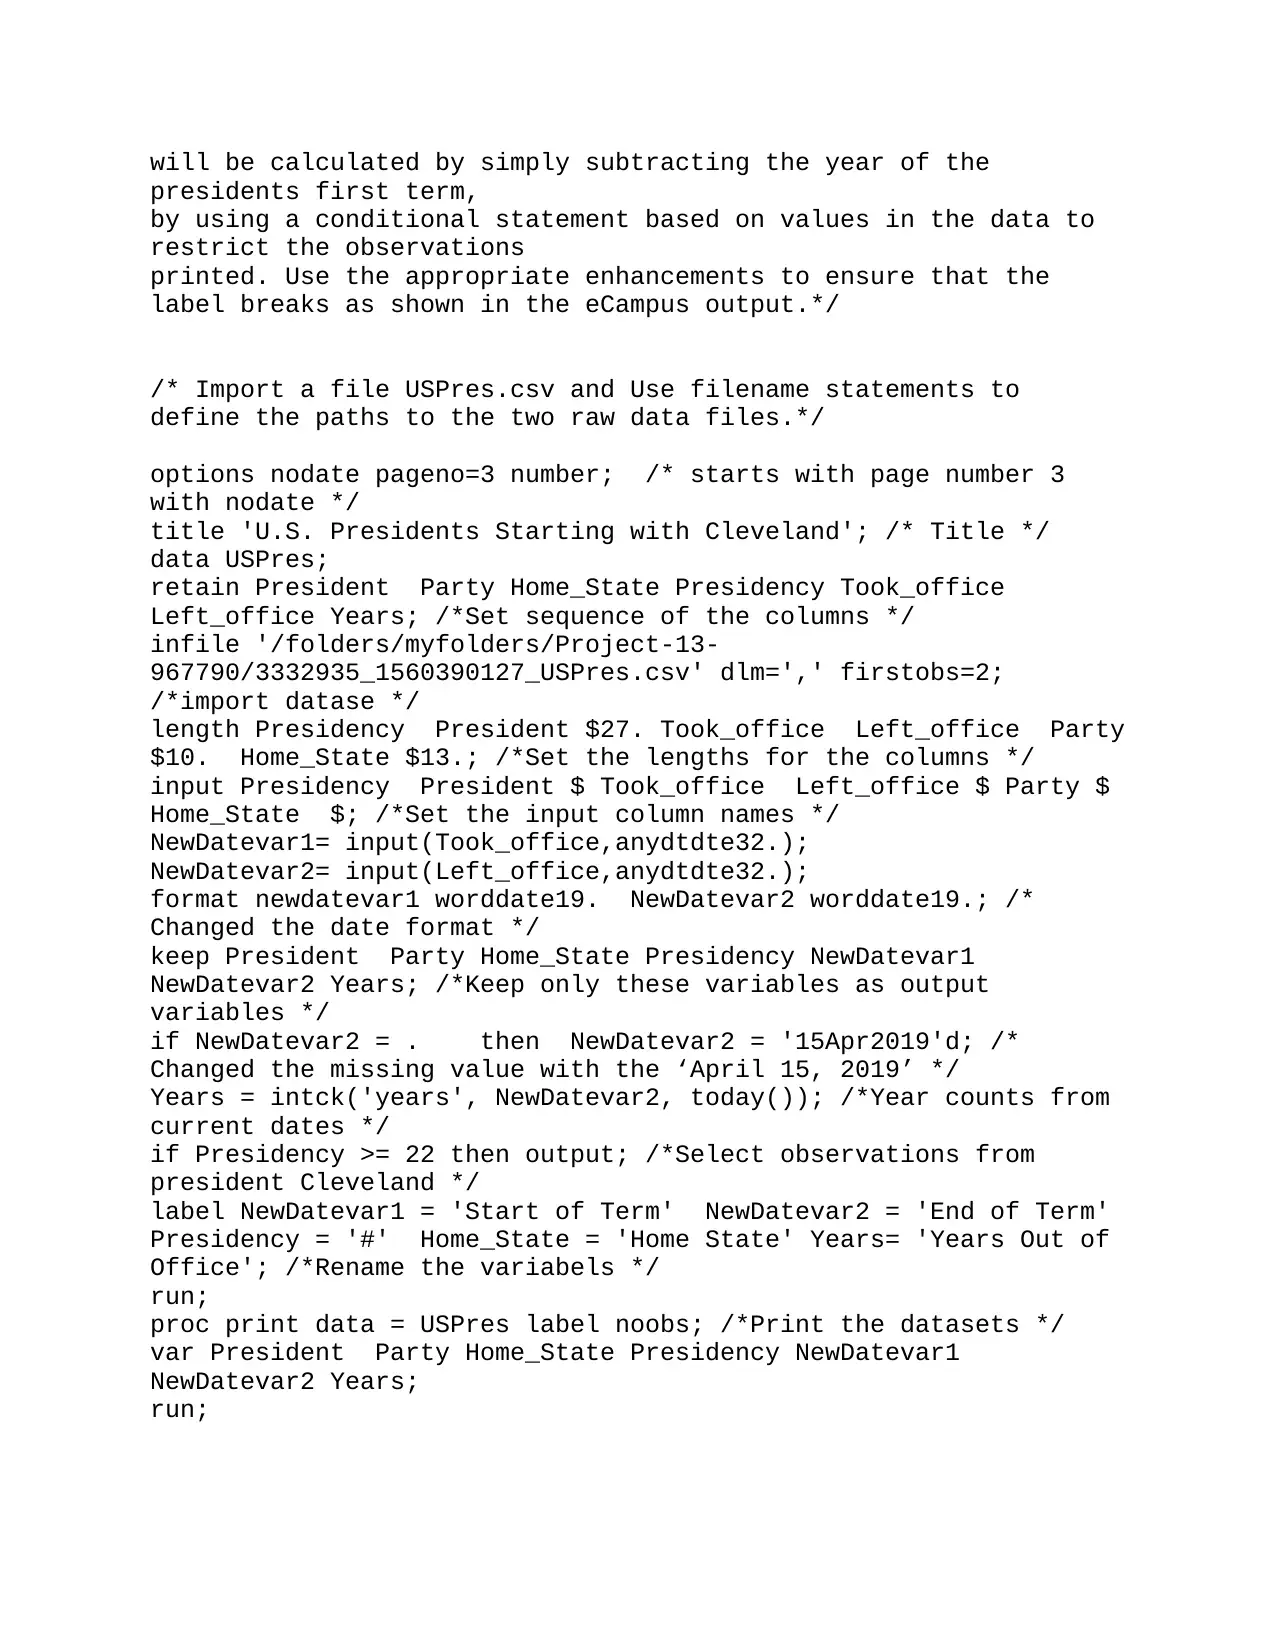
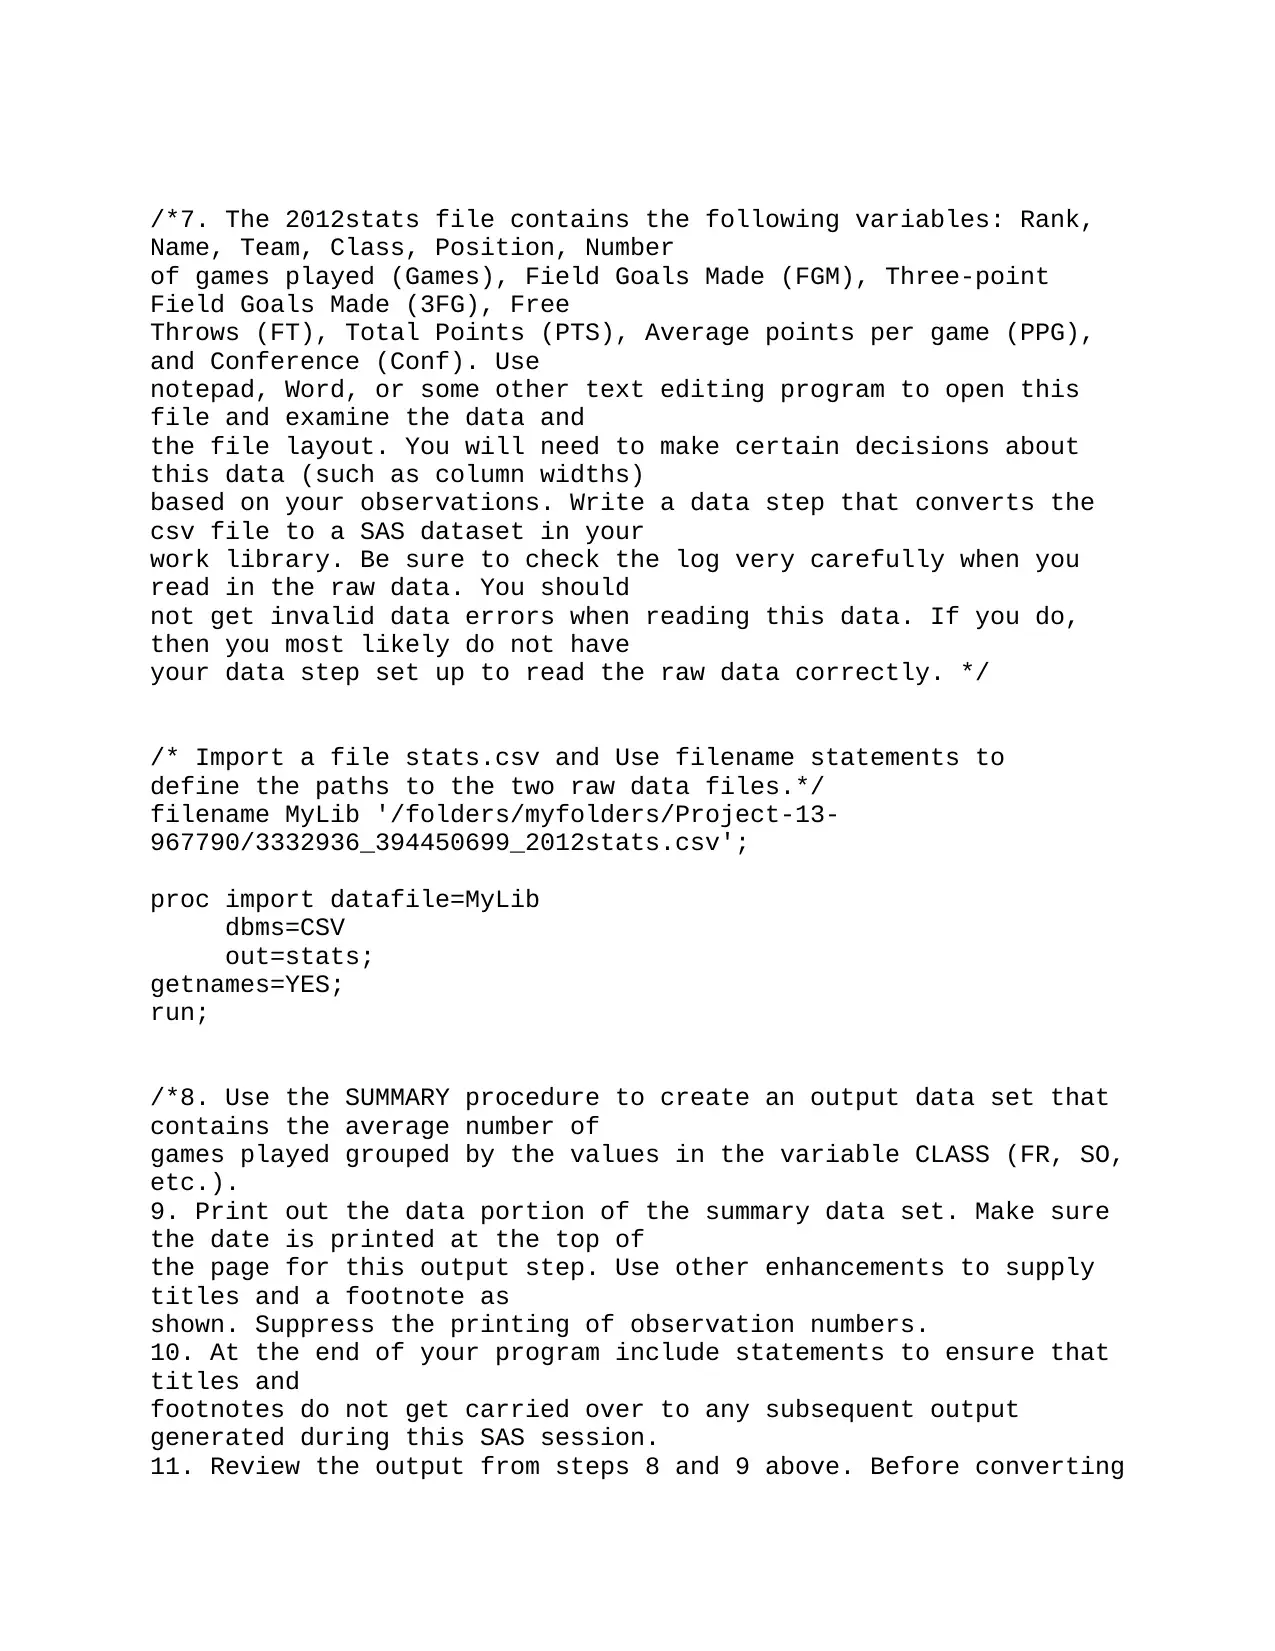
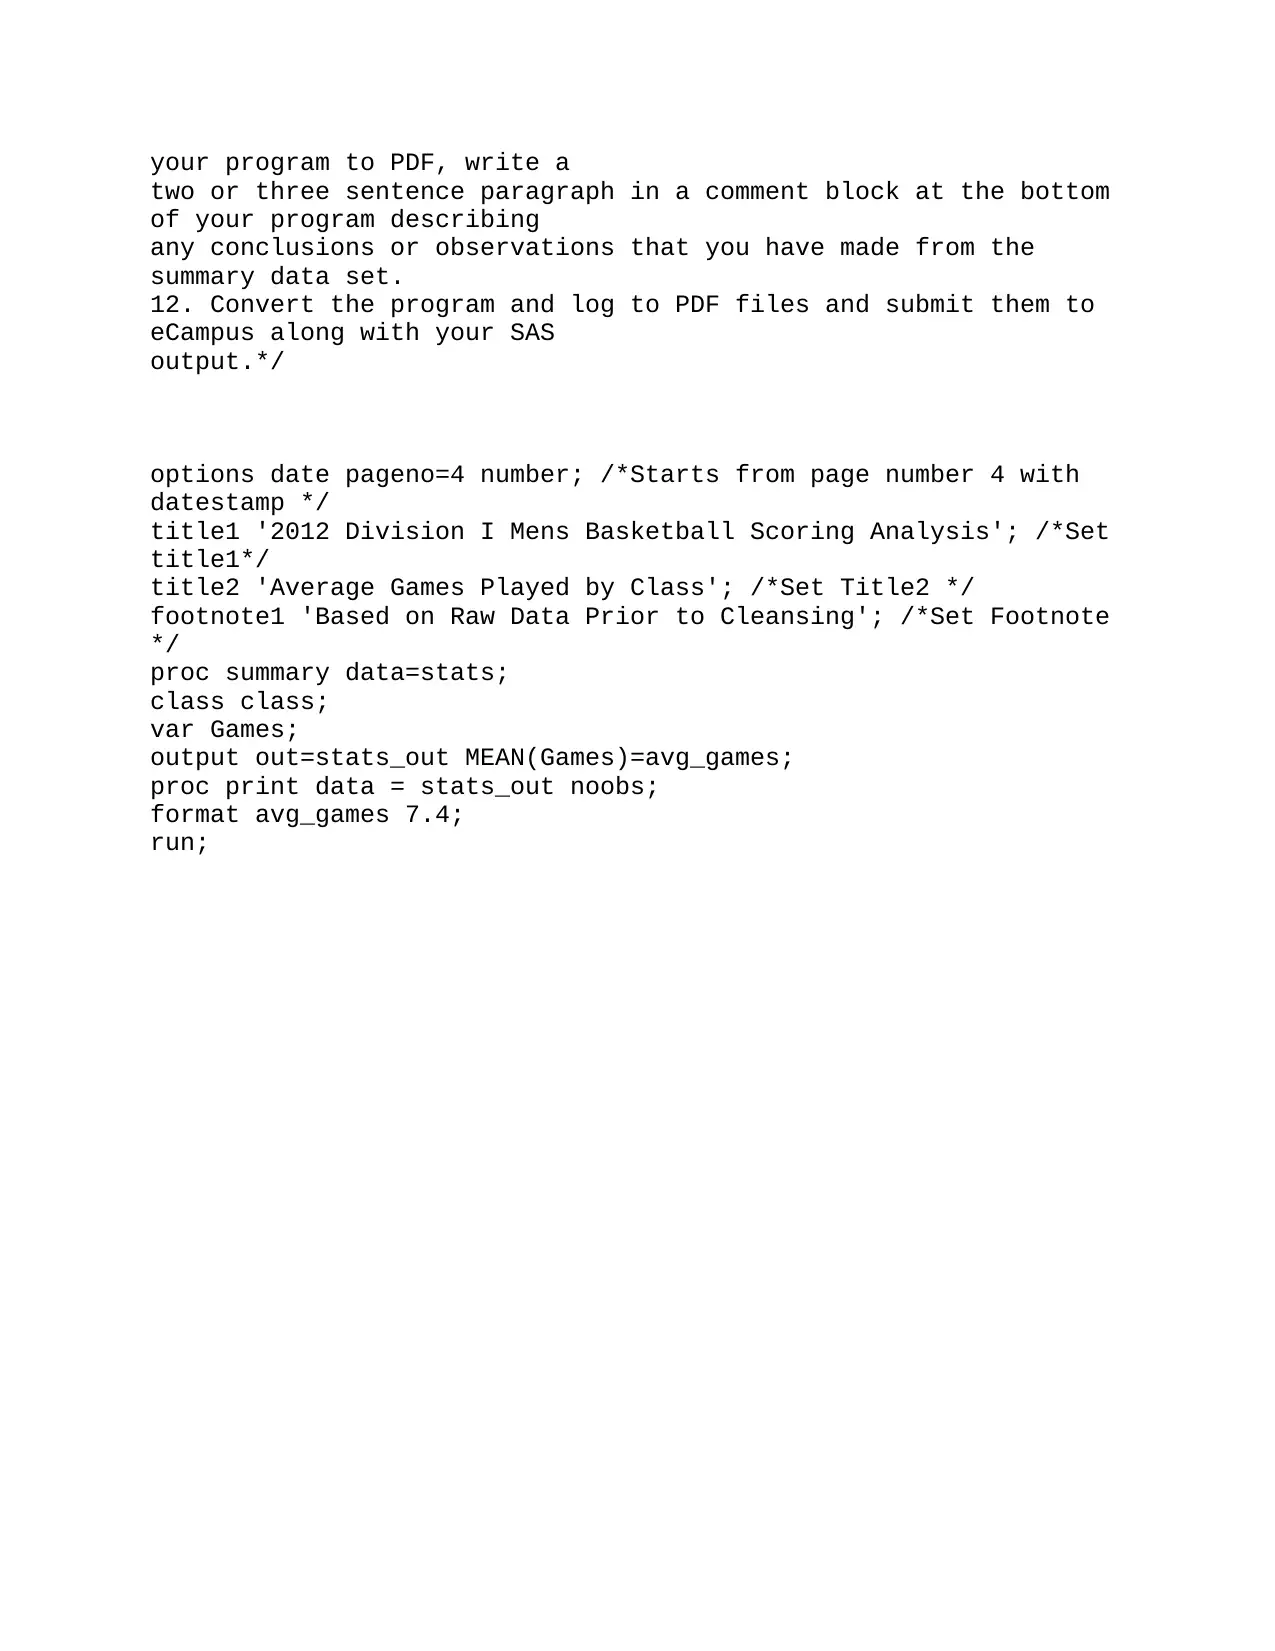
This SAS assignment involves a comprehensive data analysis project using the SAS programming language. The assignment begins with importing and manipulating data from multiple sources, including a SAS dataset and CSV files containing basketball scoring statistics and information on US presidents. The solution utilizes procedures such as PROC FORMAT for creating custom formats, PROC TABULATE for generating tables with specified layouts, and PROC PRINT for displaying datasets with specific formatting requirements. Data manipulation includes handling missing values, date formatting, and creating new variables based on existing data. The assignment also covers data import from CSV files, data summarization using PROC SUMMARY, and generating reports with titles, footnotes, and page numbering. The final output includes PDF files containing the SAS code, log, and generated output, demonstrating the student's ability to perform data analysis tasks using SAS and adhere to specific formatting and reporting requirements.
1 out of 5
Your All-in-One AI-Powered Toolkit for Academic Success.
+13062052269
info@desklib.com
Available 24*7 on WhatsApp / Email
![[object Object]](/_next/static/media/star-bottom.7253800d.svg)
Copyright © 2020–2025 A2Z Services. All Rights Reserved. Developed and managed by ZUCOL.