University Computing Assessment: Data Analysis with Excel 2010
VerifiedAdded on 2023/04/06
|13
|1287
|119
Homework Assignment
AI Summary
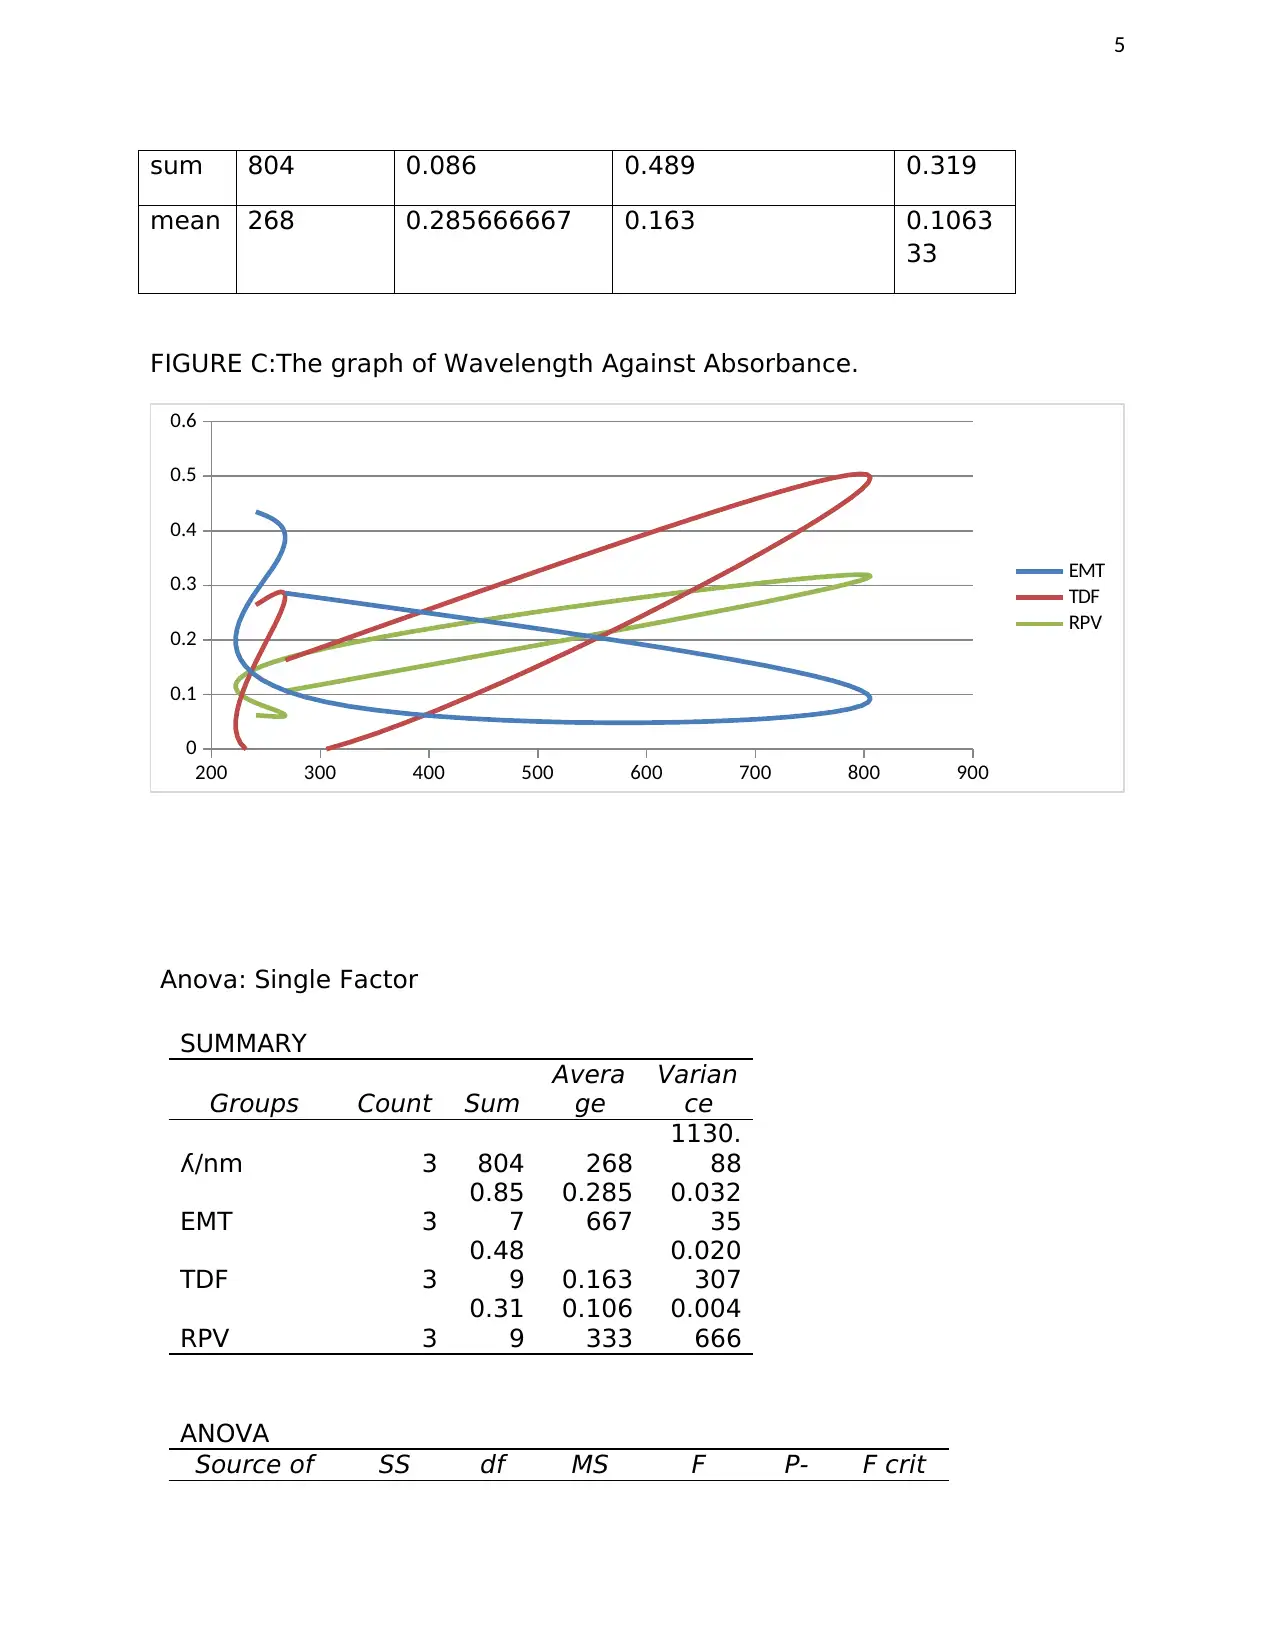
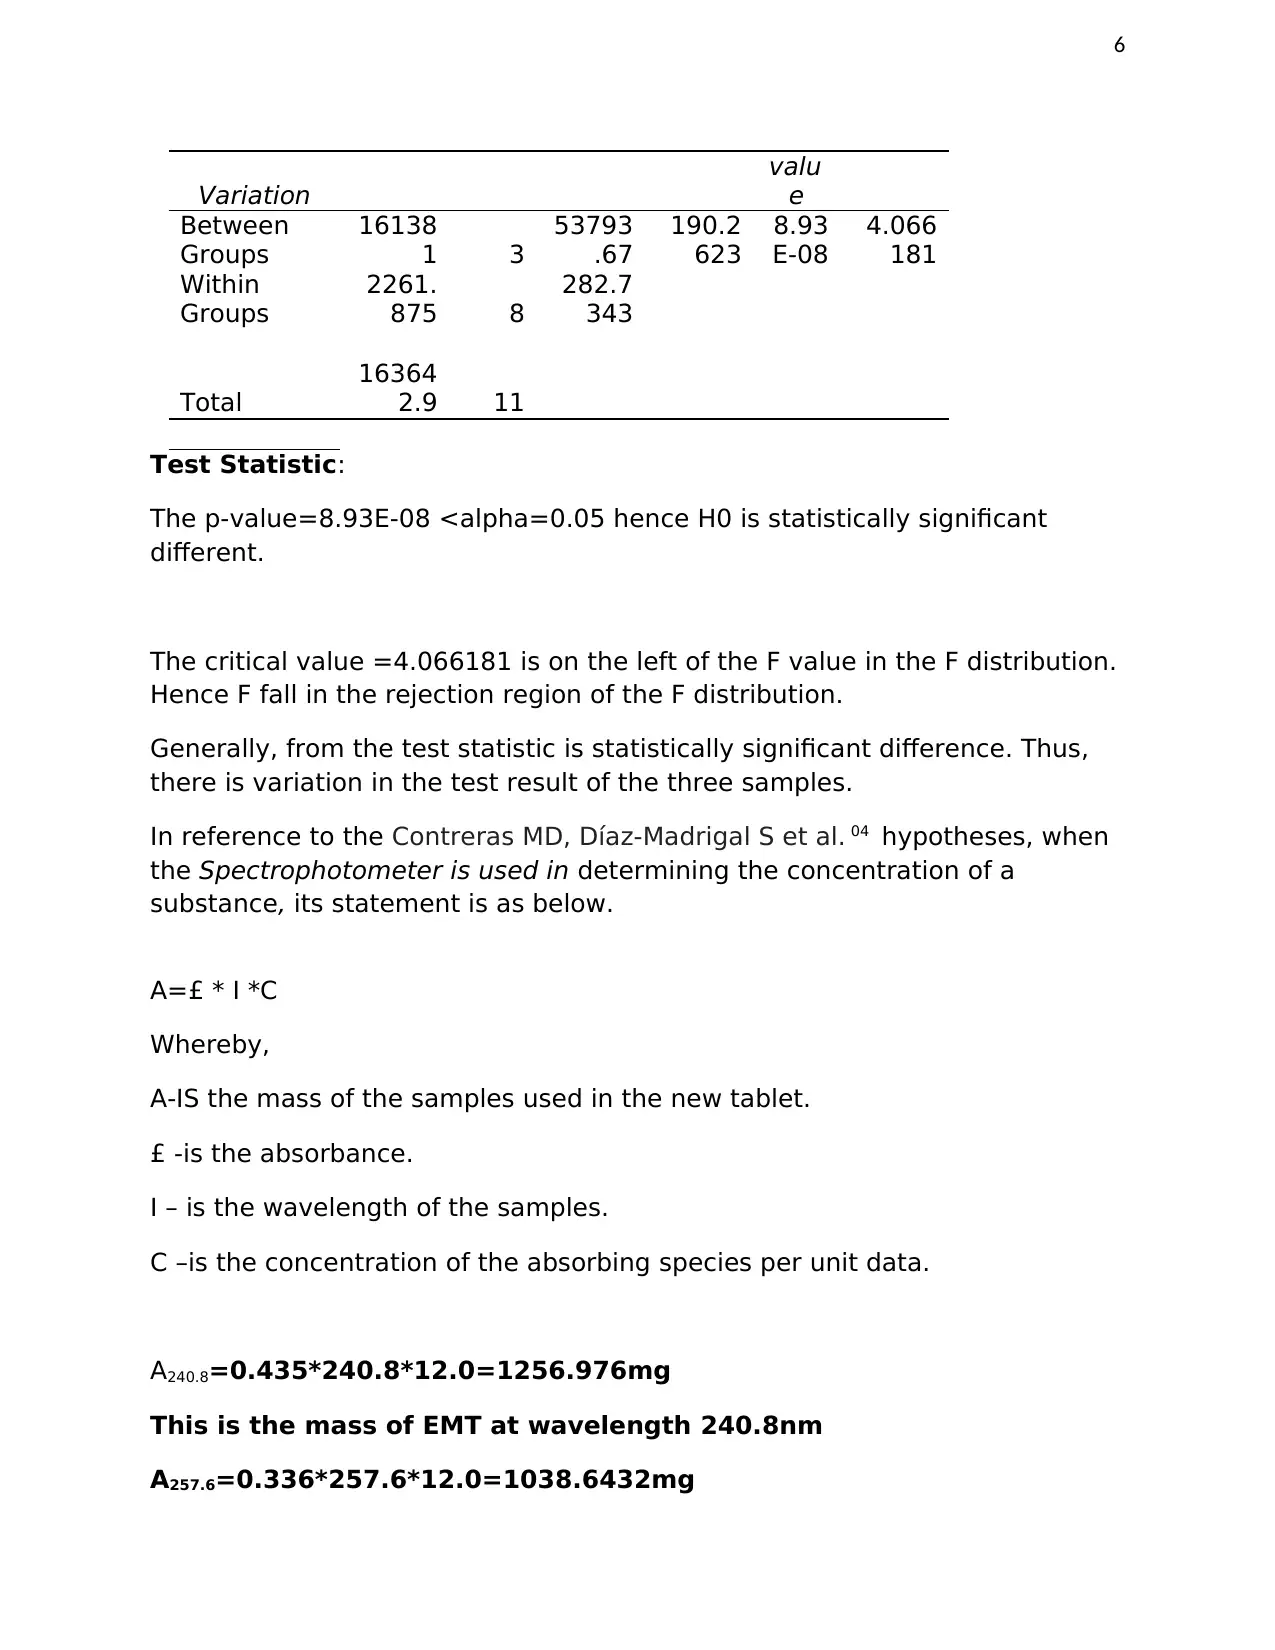
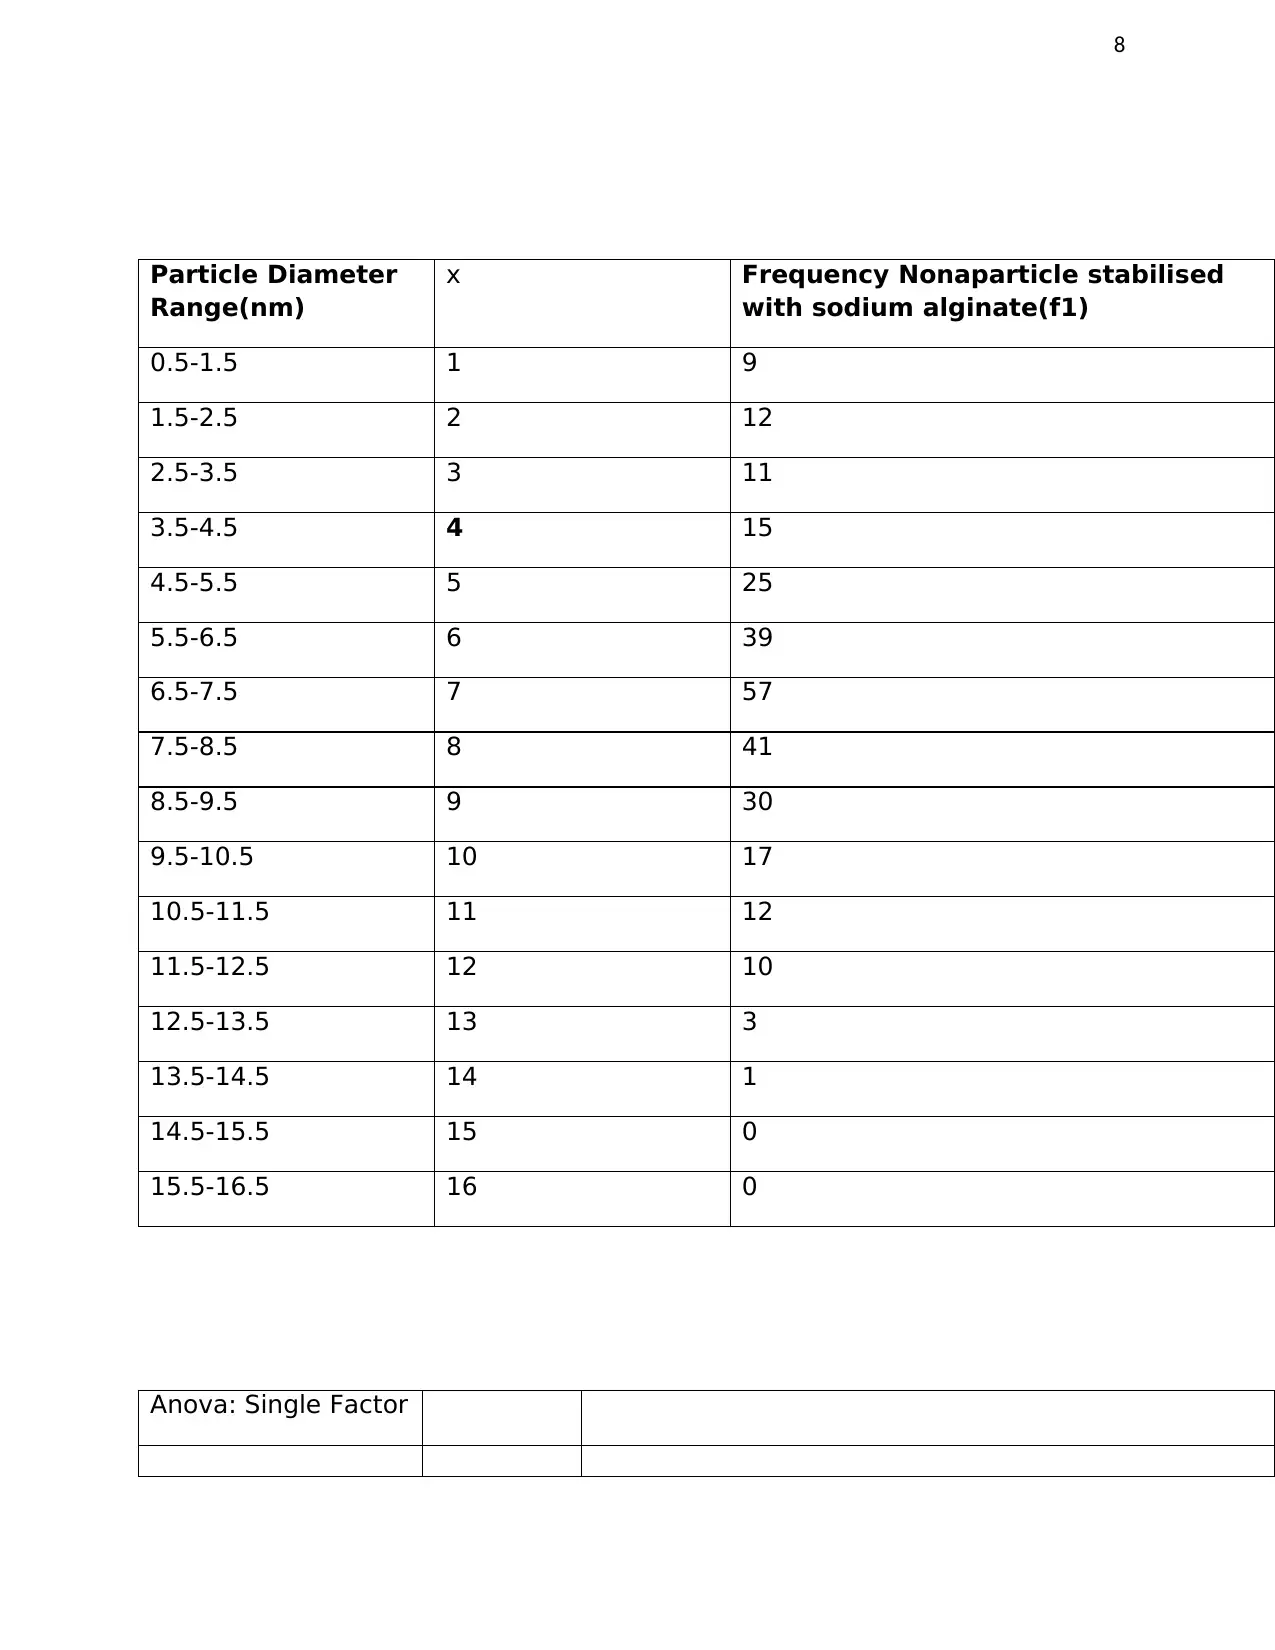
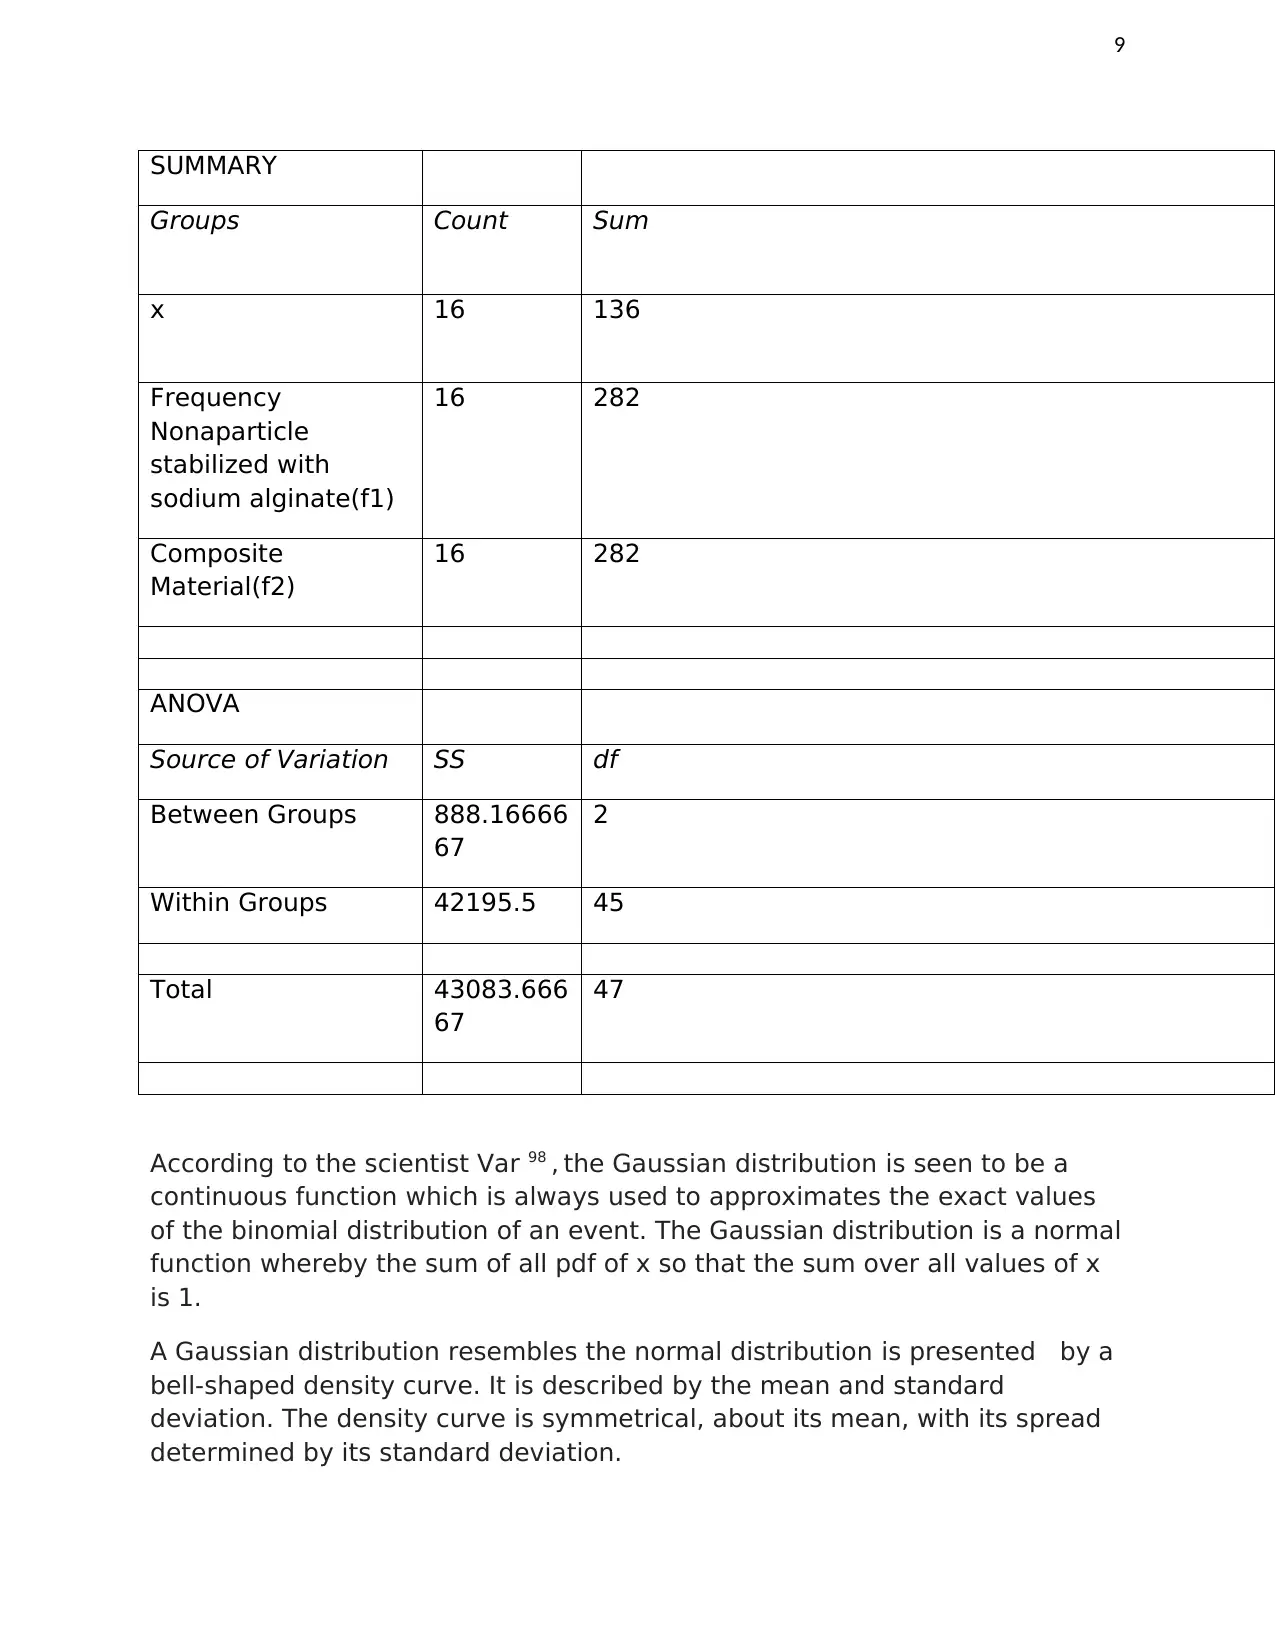
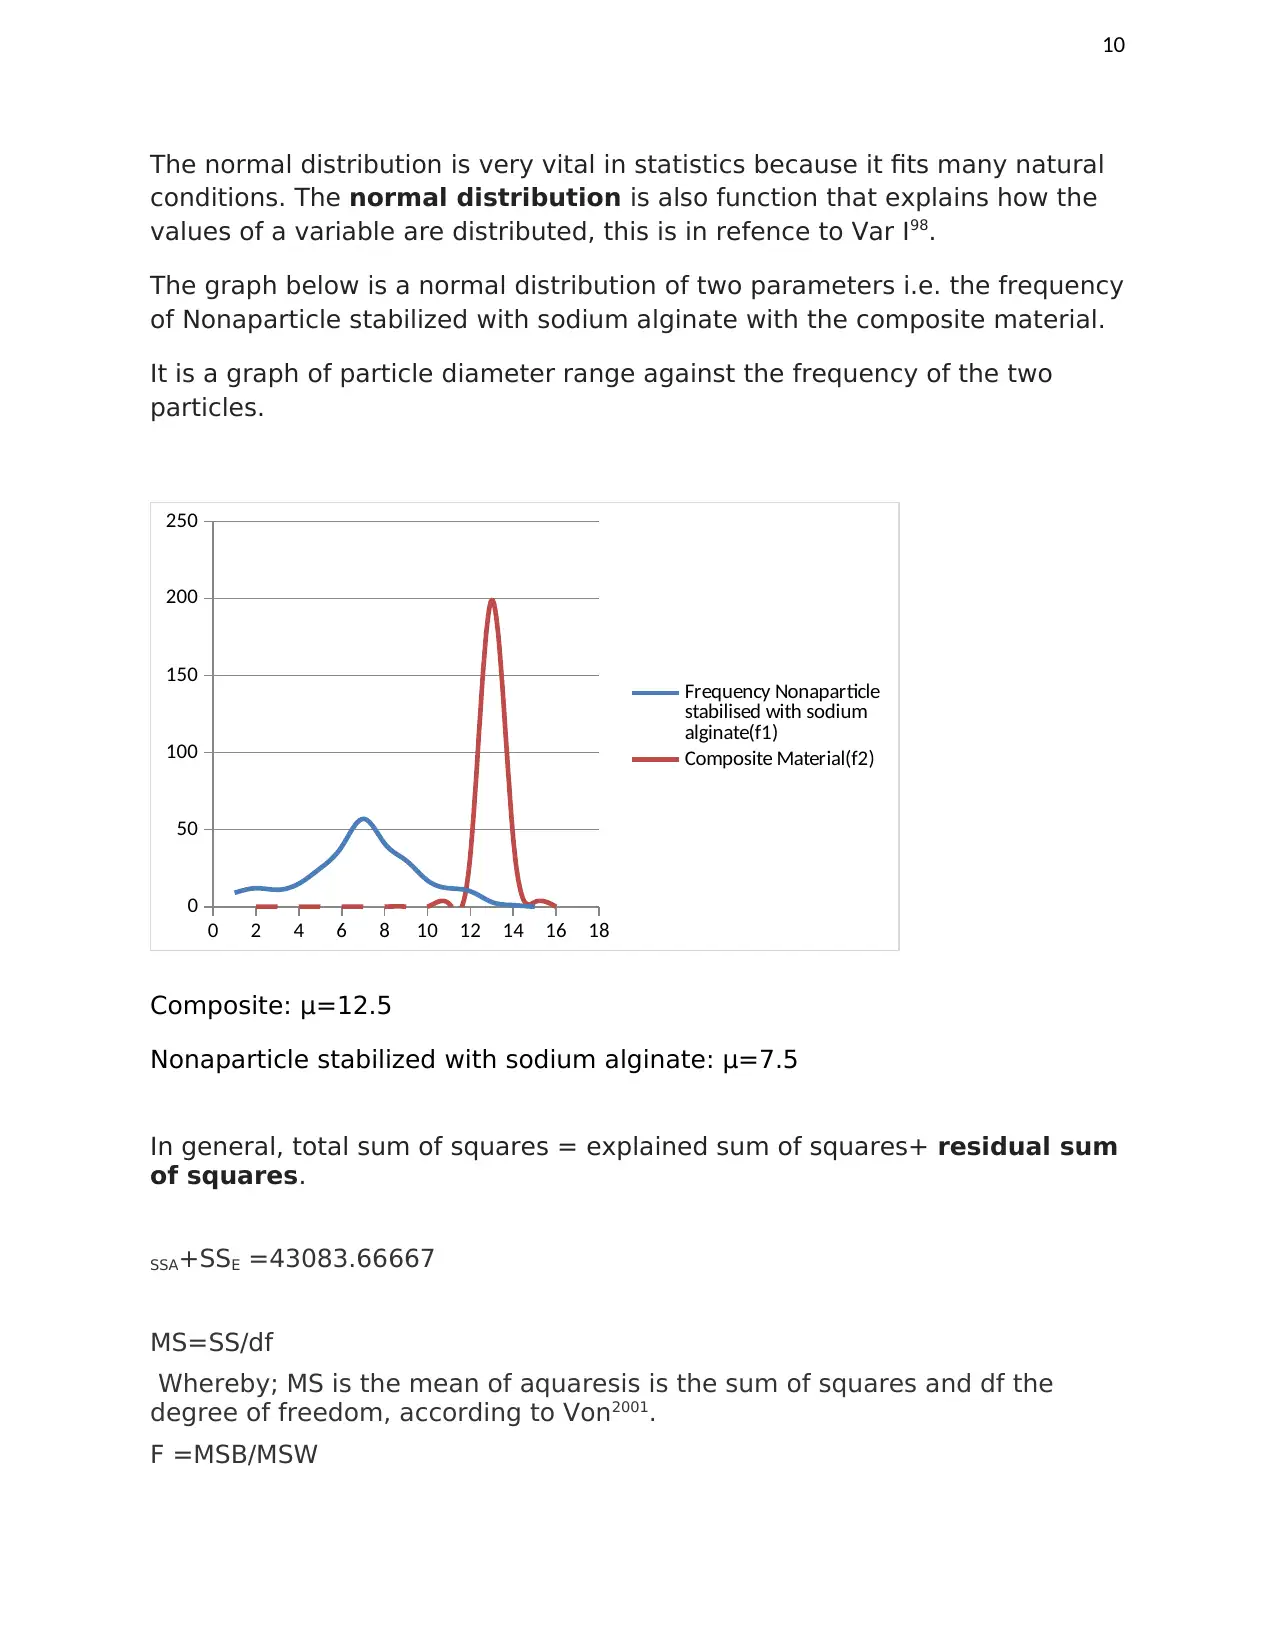
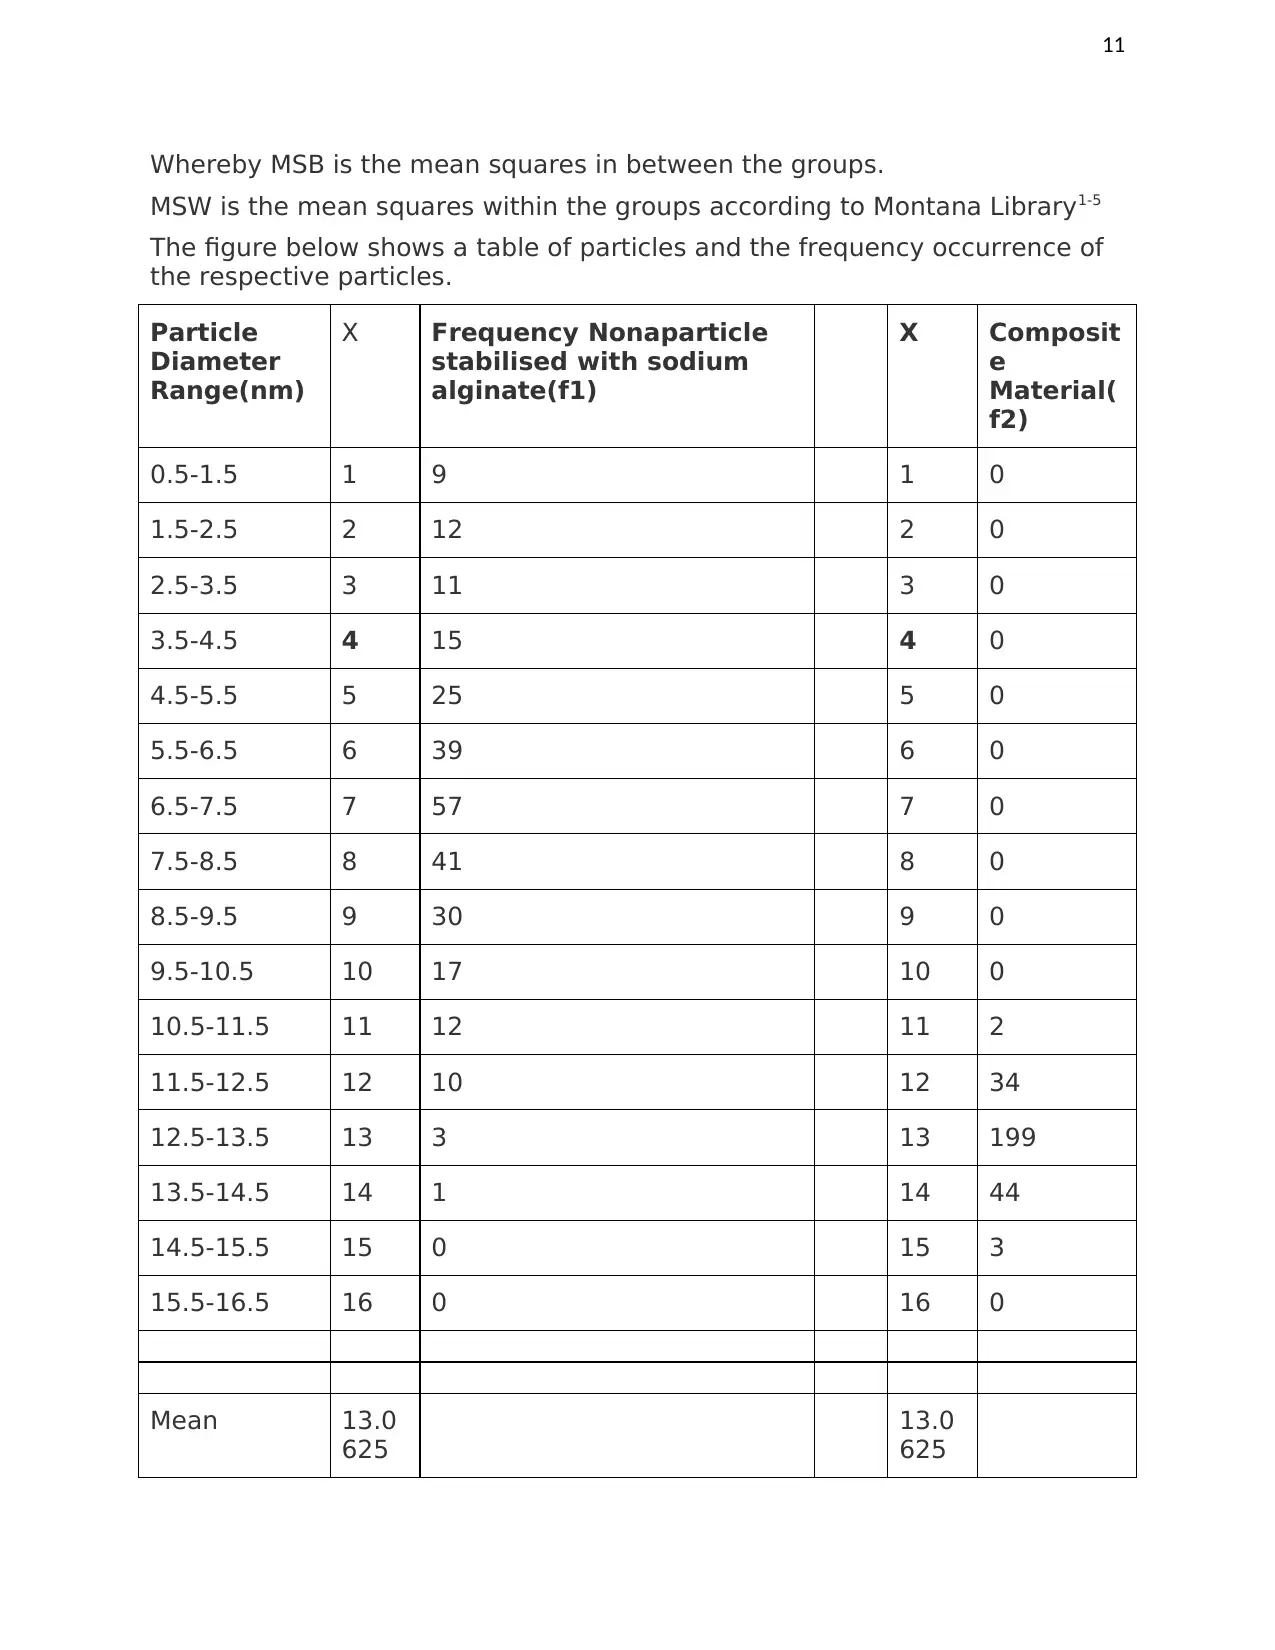
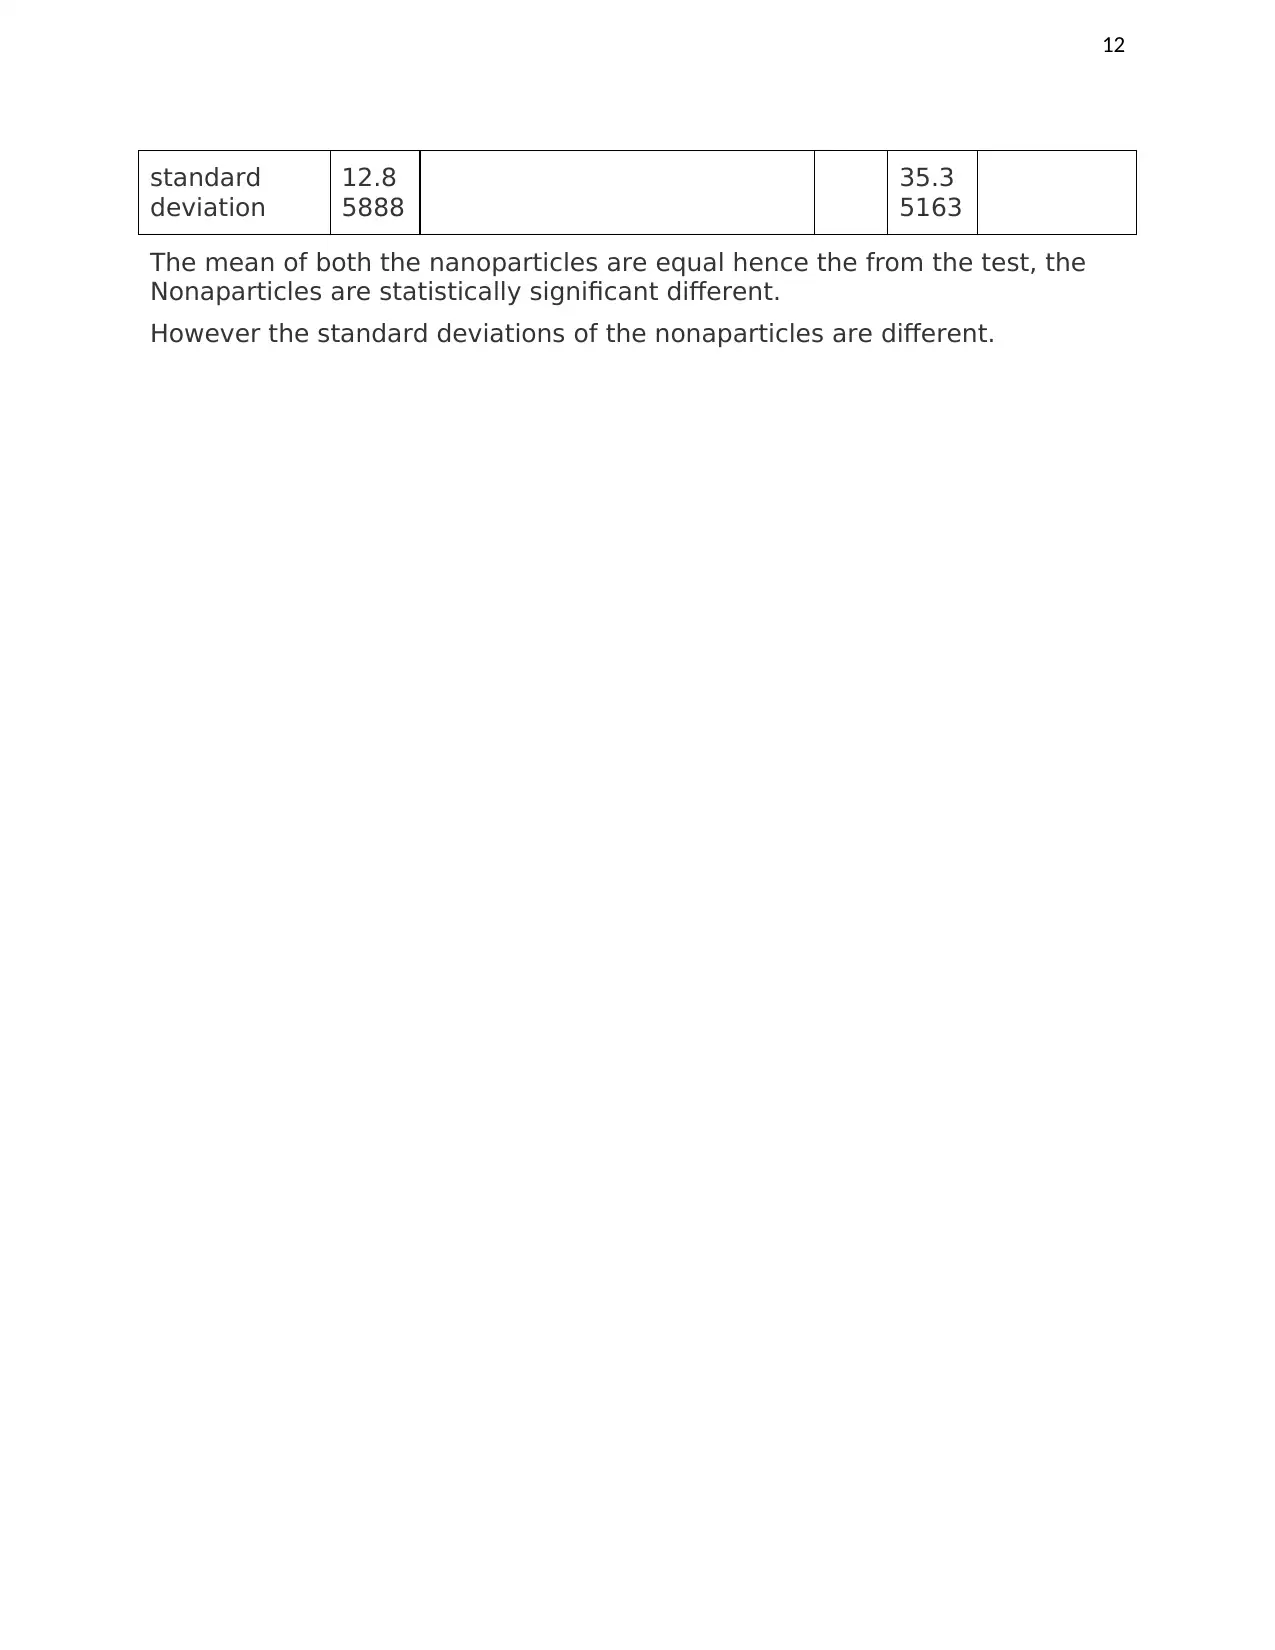
This computing assessment solution involves quantitative data analysis using Excel 2010 to analyze spectrophotometric data and particle diameter ranges. The first problem utilizes ANOVA to assess variations in antiviral drug samples (EMT, TDF, RPV), calculating masses at different wavelengths based on spectrophotometer readings. The analysis includes hypothesis testing and interpretation of statistical significance. The second problem explores the Gaussian distribution of nanoparticles stabilized with sodium alginate and composite materials, comparing their frequency and particle diameter ranges. The assessment includes ANOVA, mean, and standard deviation calculations to determine statistical differences between the nanoparticles. Desklib offers similar solved assignments and study tools for students.

1 out of 13
Your All-in-One AI-Powered Toolkit for Academic Success.
+13062052269
info@desklib.com
Available 24*7 on WhatsApp / Email
![[object Object]](/_next/static/media/star-bottom.7253800d.svg)
© 2024 | Zucol Services PVT LTD | All rights reserved.