Energy Analysis Techniques: Queens Building
VerifiedAdded on 2022/12/30
|20
|3816
|36
AI Summary
This report discusses the energy analysis techniques used in the Queens Building at Montfort University. It covers the building's design, ventilation systems, heating and lighting, and its energy performance. The report also includes information on the building's operational ratings and CO2 emissions.
Contribute Materials
Your contribution can guide someone’s learning journey. Share your
documents today.
1ENERGY ANALYSIS TECHNIQUES: QUEENS BUILDING
ENERGY ANALYSIS TECHNIQUES: QUEENS BUILDING
Class Name
Professor
Name of the University
The Date
ENERGY ANALYSIS TECHNIQUES: QUEENS BUILDING
Class Name
Professor
Name of the University
The Date
Secure Best Marks with AI Grader
Need help grading? Try our AI Grader for instant feedback on your assignments.
2ENERGY ANALYSIS TECHNIQUES: QUEENS BUILDING
Energy Analysis Techniques
Executive Summary
The measures taken to achieve efficient ways of generating renewable energy and
lowering carbon emission in existing buildings and the ones still in the process of design, is
significant enough to reduce the cost of energy. This has therefore increased the number of
national and regional policies regarding the promotion of better performance of buildings. Other
issues such as campaign against emission of greenhouse gasses, and other promotion like the
economic stimulus programs have driven the energy efficiency demand from commercial
buildings to be heightened. the methods used in performing energy assessments are sometimes
laborious and costly and therefore technology has been embraced to make this process easy. The
project herein is built on the promise of coming up with a better performing building that is
sustainable for posterity.
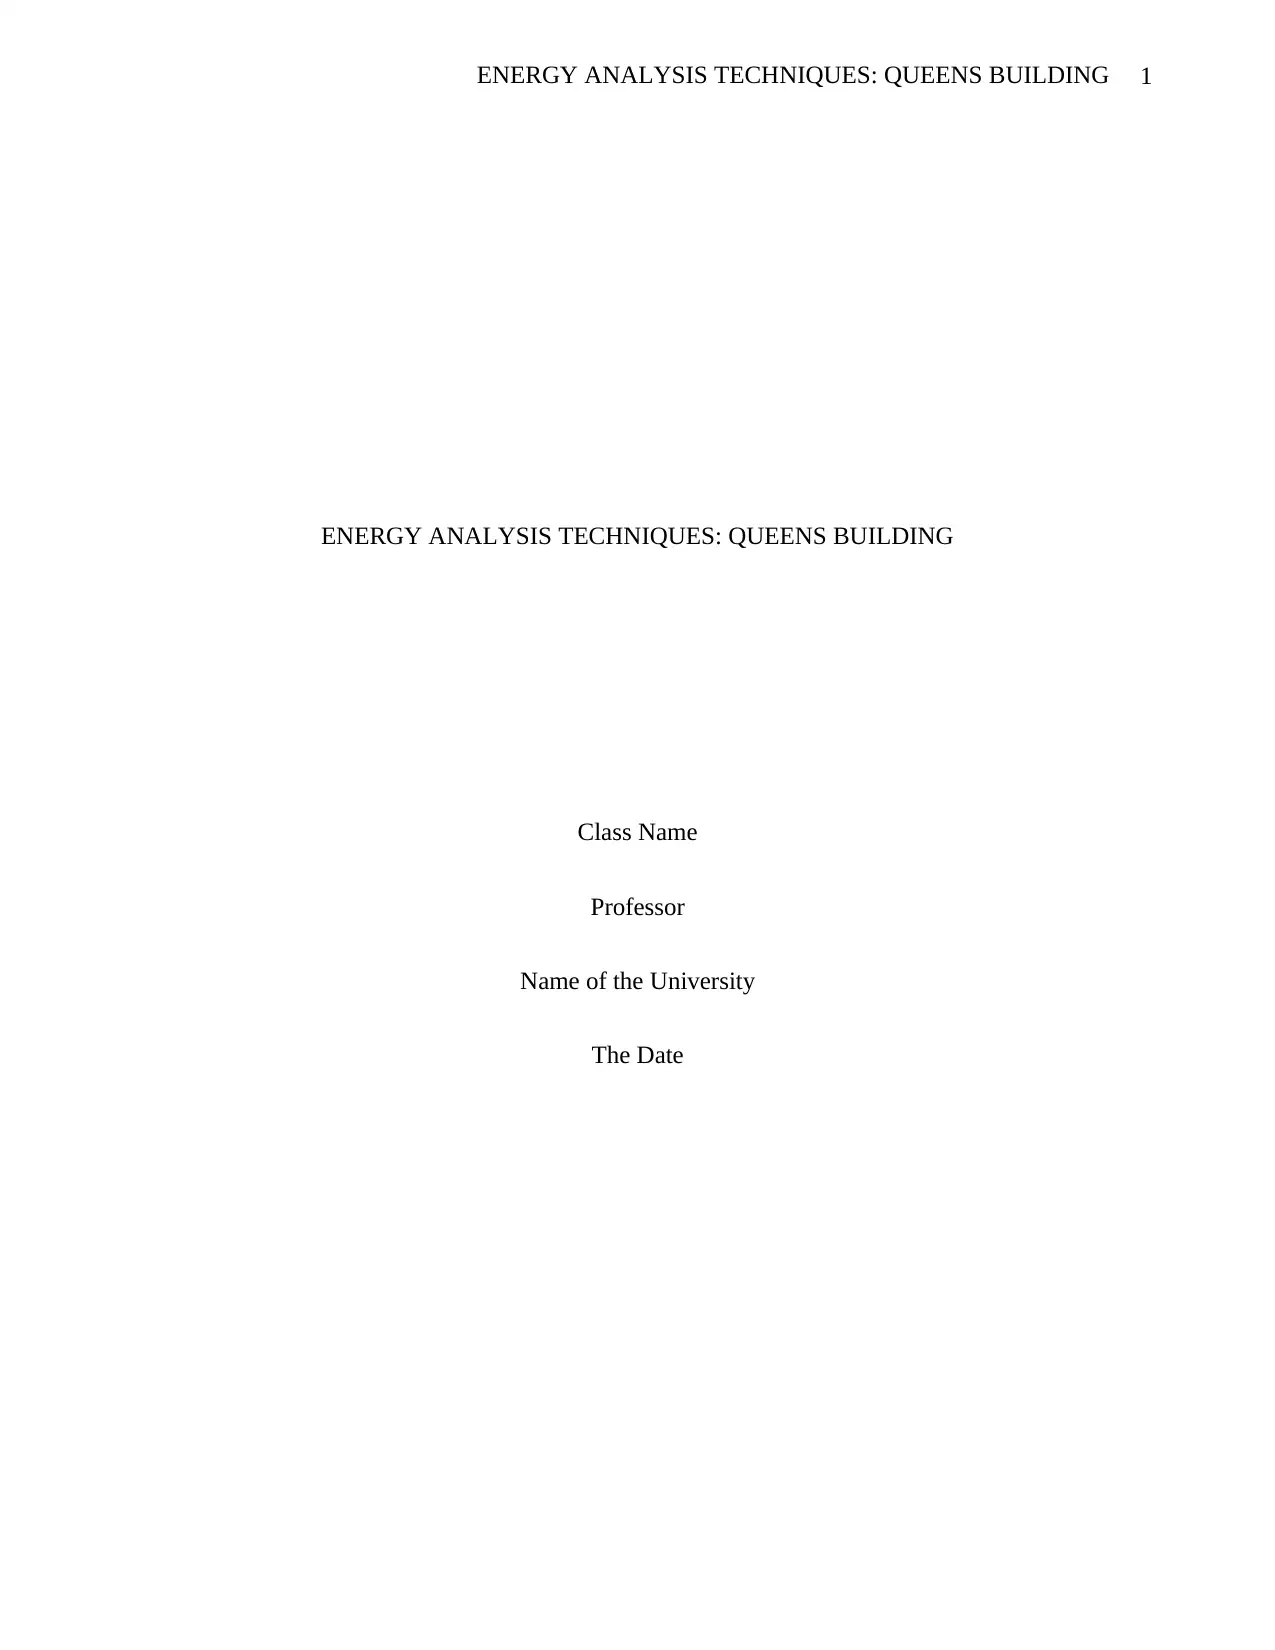
Figure 1:The huge windows allowing the daylight
Energy Analysis Techniques
Executive Summary
The measures taken to achieve efficient ways of generating renewable energy and
lowering carbon emission in existing buildings and the ones still in the process of design, is
significant enough to reduce the cost of energy. This has therefore increased the number of
national and regional policies regarding the promotion of better performance of buildings. Other
issues such as campaign against emission of greenhouse gasses, and other promotion like the
economic stimulus programs have driven the energy efficiency demand from commercial
buildings to be heightened. the methods used in performing energy assessments are sometimes
laborious and costly and therefore technology has been embraced to make this process easy. The
project herein is built on the promise of coming up with a better performing building that is
sustainable for posterity.
Figure 1:The huge windows allowing the daylight
3ENERGY ANALYSIS TECHNIQUES: QUEENS BUILDING
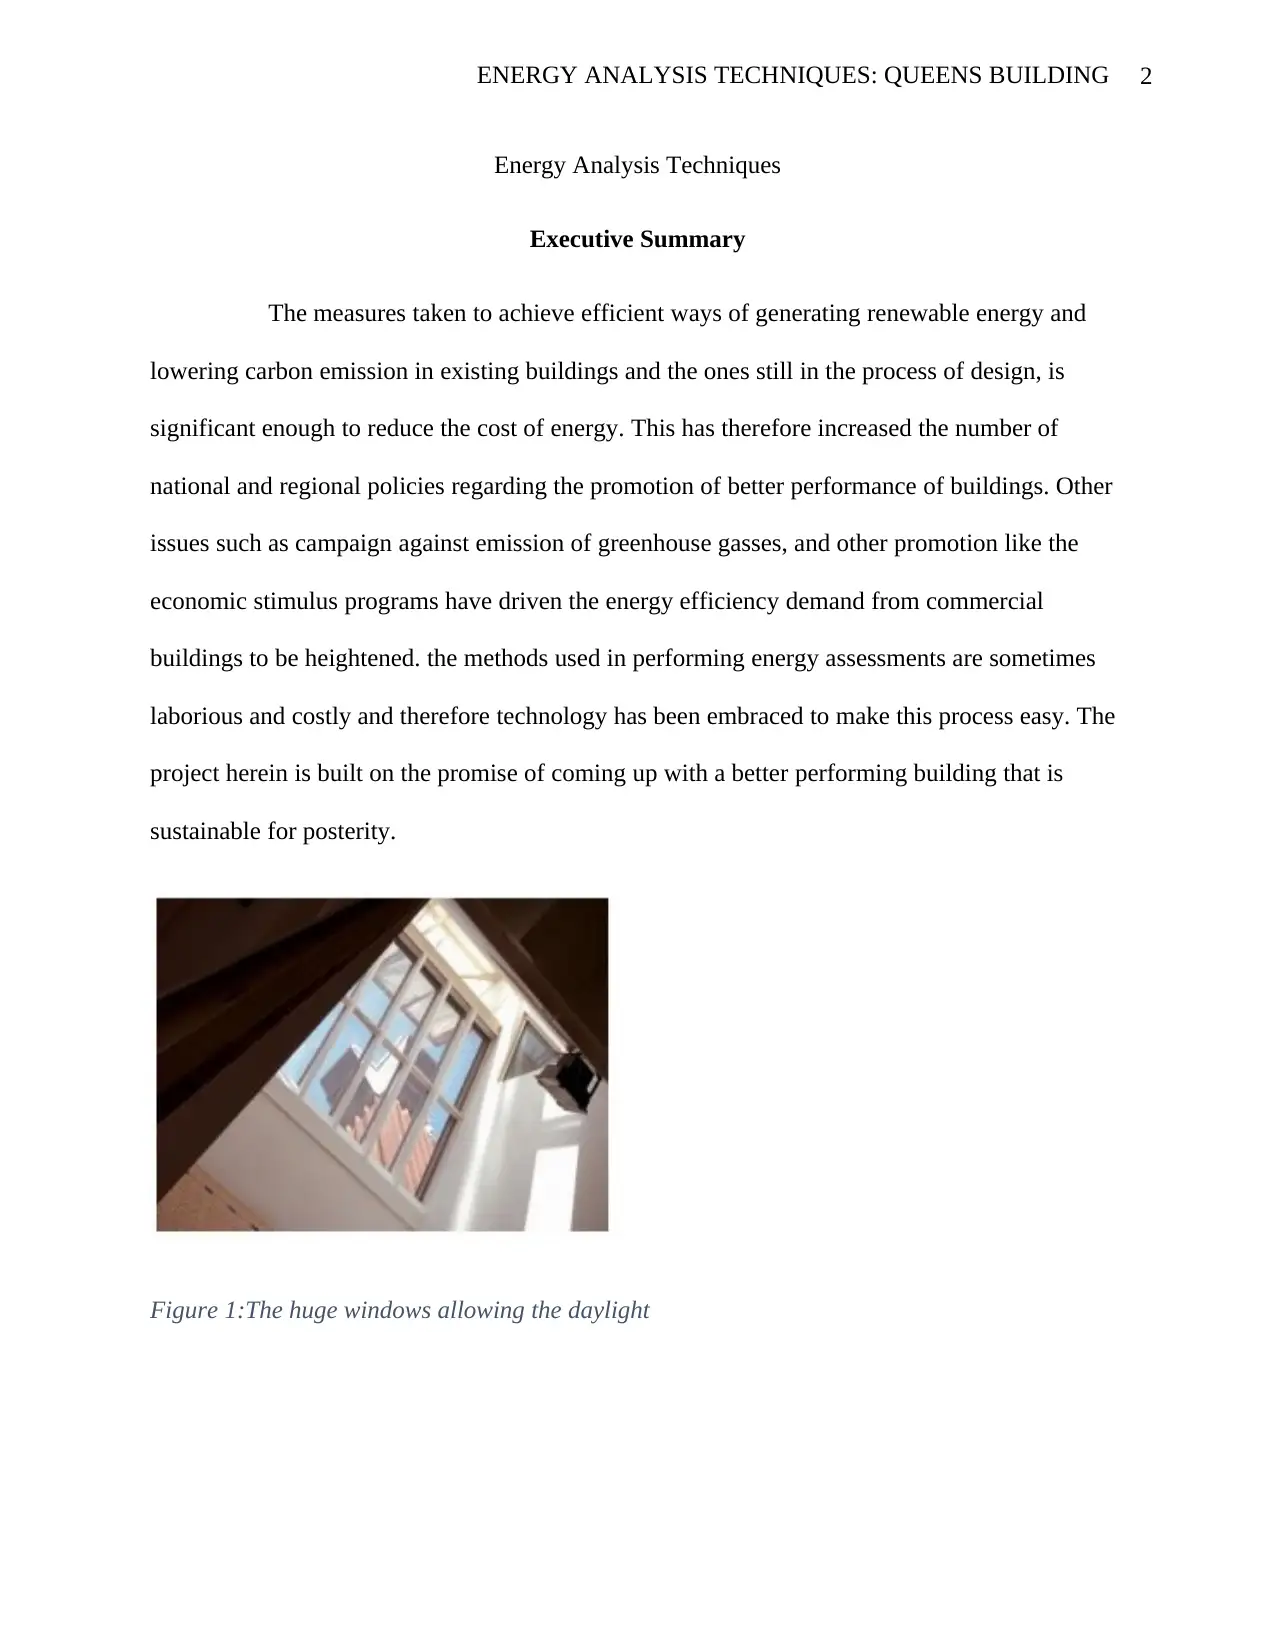
Figure 2: The building's elevation
This report is for conducting an energy audit for the building I have chosen called the
Queens building found in Montfort University in Leicester. This building has been known to be
the building used in benchmarking in natural ventilation, solar design (albeit done passively),
and daylighting. Queens building is mostly naturally ventilated, one fundamental feature of the
building is the fact that its structure exposed thermally, the structure made of bricks and
blockwork walls, and has exposed soffits to the concrete slabs in the floor. The floor area is
around 10,000m2 which comprises of mechanical, and electrical laboratories. The mechanical
laboratories are skirted on the western side which has a double storey block and has a mechanical
ventilation on the side of the specialised laboratory. Electrical laboratories on the other hand, are
enclosed in the shallow plan, which are four storey wings, with either sides of the courtyard
forming an entrance to the pedestrian.
4ENERGY ANALYSIS TECHNIQUES: QUEENS BUILDING
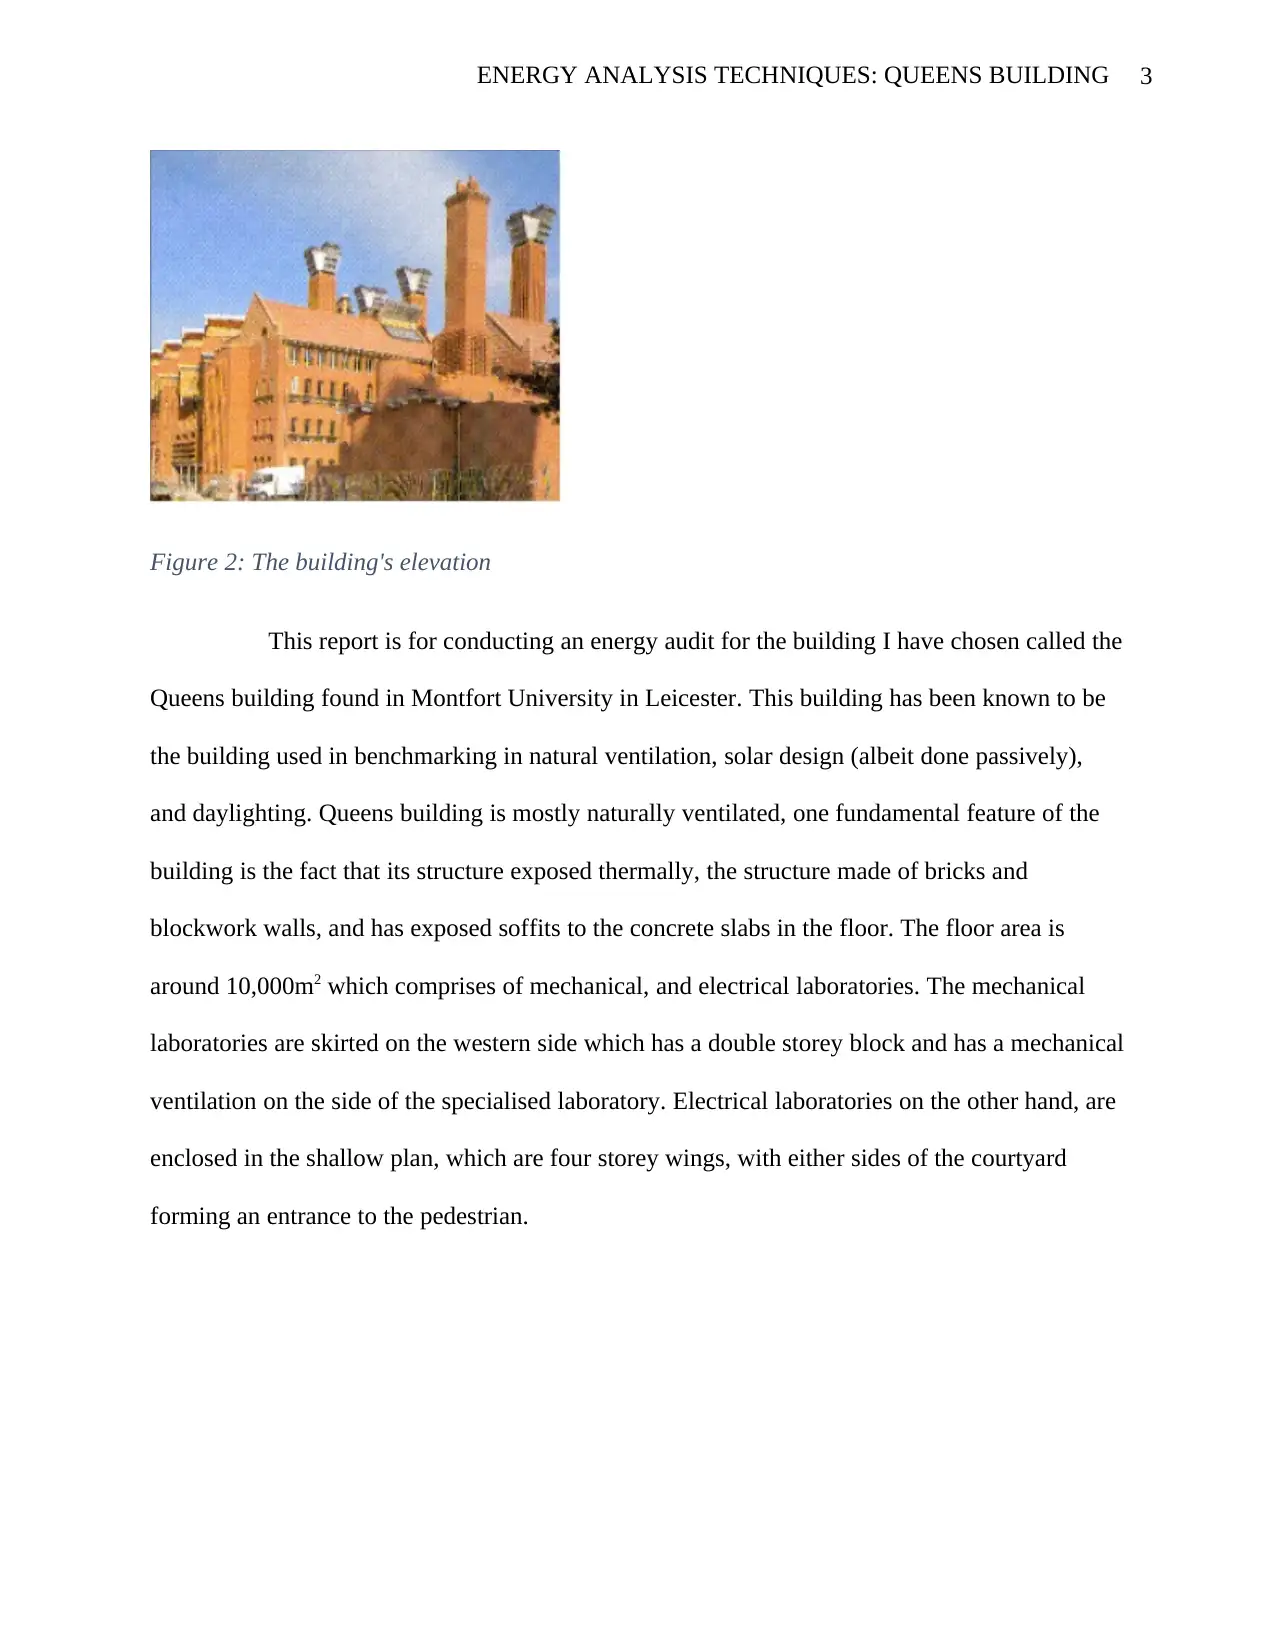
Figure 3:The Auditorium
The handing over that was to happen got delayed until 13th August 1993, this compressed the
initial commissioning and the fit-out that was to happen in six weeks’ time. As a result, the main
contractor didn’t deal with some pertinent issues on time, issues pertaining defects as much as
the client, the university, would have wanted them to. The building is still yet to be fully
commissioned and the building is grappling with the defects that resulted. Defects like the
control systems and mechanical systems, the mechanical ventilation, and electrical systems.
Building Description and Survey Findings
It was found that there was no enough space to describe the full building into details,
this was done by an earlier journal called Building Services Journal (Bunn, 1993). The building’s
architect had a very considerate design of the building making the building highly insulated and
the space between the floor and the ceiling was big that was meant to allow natural ventilation
and improve the building’s daylighting ability. Both the classrooms and the auditoria located at
the ground floor have chimneys that are ventilated. On the other hand, the areas where the staffs
are to be are on the upper floors are ventilated by rooftop ventilations. Air that comes from the
concourse goes through the drawing studios up the ridge ventilations which have the northern
Secure Best Marks with AI Grader
Need help grading? Try our AI Grader for instant feedback on your assignments.
5ENERGY ANALYSIS TECHNIQUES: QUEENS BUILDING
orientation for optimization of daylight presence. Mechanical ventilations installed in the
building are fitted the specialist laboratories only. There’s a thermal heating system in the
building of 1thw, which is the traditional heating system, but there’s an existence of artificial
heating system for boiler condensation, which comes from the heating and power system of
38kW. The heated water comes from the central calorifiers. The building also embraces the use
of energy saver-lighting system which are controlled manually and some control by the
occupancy sensor.
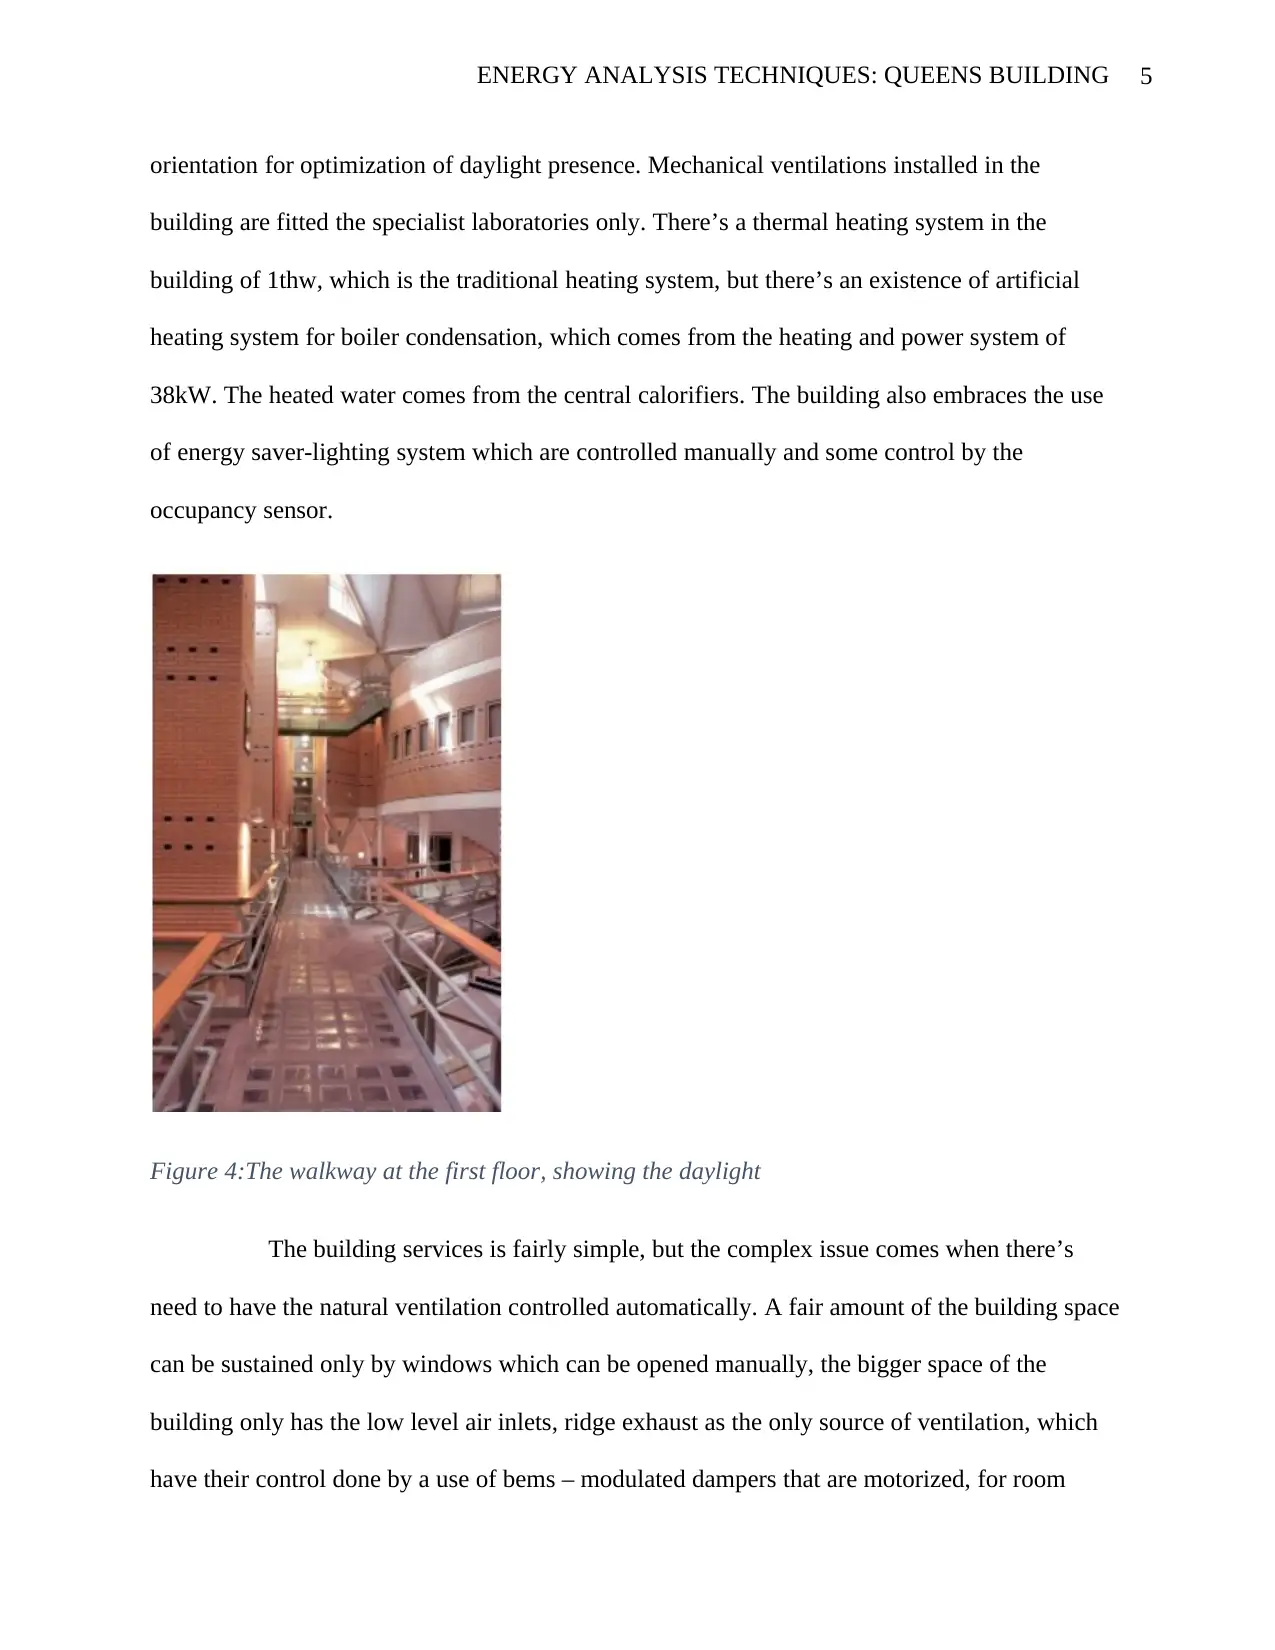
Figure 4:The walkway at the first floor, showing the daylight
The building services is fairly simple, but the complex issue comes when there’s
need to have the natural ventilation controlled automatically. A fair amount of the building space
can be sustained only by windows which can be opened manually, the bigger space of the
building only has the low level air inlets, ridge exhaust as the only source of ventilation, which
have their control done by a use of bems – modulated dampers that are motorized, for room
orientation for optimization of daylight presence. Mechanical ventilations installed in the
building are fitted the specialist laboratories only. There’s a thermal heating system in the
building of 1thw, which is the traditional heating system, but there’s an existence of artificial
heating system for boiler condensation, which comes from the heating and power system of
38kW. The heated water comes from the central calorifiers. The building also embraces the use
of energy saver-lighting system which are controlled manually and some control by the
occupancy sensor.
Figure 4:The walkway at the first floor, showing the daylight
The building services is fairly simple, but the complex issue comes when there’s
need to have the natural ventilation controlled automatically. A fair amount of the building space
can be sustained only by windows which can be opened manually, the bigger space of the
building only has the low level air inlets, ridge exhaust as the only source of ventilation, which
have their control done by a use of bems – modulated dampers that are motorized, for room
6ENERGY ANALYSIS TECHNIQUES: QUEENS BUILDING
temperature maintenance. We were in the building and told that one winter, when the actuator
was functioning, its arm got cut off from the mechanism of the rooflights. Which is suspected to
be as a result of a frozen rooflight. As a result, some of the mechanisms of the roof light have
been halted into operation to prevent the same scenario.
The roof light in third floor staff area have sections that can be opened, but the actual mechanism
was installed by the contractor who was handling the fit-out. This area lacks a proper ventilation
and suffers a higher temperature in the summer which is higher than any other place in the entire
building.
The doors inside the mechanical workshop with the breathing buttresses are difficult
to open since they interfere with apparatus on the workbenches, this problem has been partially
solved by a use of another entrance point, the machine hall.
Other mechanical issues that were observed were as follows:
Lack of enough airflow paths at the two auditoria and lack of a more sensitive
control of the airflow and air balance. The solution is to have mechanism that supply fresh air, by
installing proper sensors that senses a set degree of CO2 and can supply enough cool air for
cooling, and while at it balancing the external temperature and the internal temperature (this
ensures that the external temperature is not more than the internal temperature). The sensors
installed needs to be sensitive enough to avoid the dampers from opening to about 50% as this
can cause the wind caused by a storm or rain to enter. On the other hand, they should not close
below 10%, since that will make the stack dampers to close thereby preventing noise and air
turbulence at the inlet. Draught needs to be avoided and dampers are good for that job by being
moderated to reduce the velocity of the moving air at the stack.
7ENERGY ANALYSIS TECHNIQUES: QUEENS BUILDING
Still at the auditoria, there have been uneven air distribution which could be brought about by the
failure of the baffles on the inlet grilles, which was identified in the investigated or failure of the
independent operation of the dampers which are in the inlet and the stack. Filters and added
attenuators would be used to improve the situation of the noise levels and the difficulty in
accessing the plenums for cleaning purposes, but when pressure drops the air flow rate would be
compromised.
Heating
The information about heating in the building are as follows: The building uses an
electricity of around 38kWe chp unit, this comprises of a condensing boiler and other high
efficiency boilers, respectively. The unit will act first whenever electricity is supplied, otherwise
it will switch off and the remaining appliance shall be the condensing boiler. The circuits used in
heating are weather proofed, with each room having a valve and a thermostat which are
motorized which aid in the trimming of heat. The building also comprises of emitters which are
either radiators or convectors, with the exception of central concourse that receives heating
through the floor, having the under-floor heating system installed in it. There was a damage of
the stems, which are three of the main port control valves, just 3 months after the building was
completed and the contractor just replaced them recently. This caused the main issue with the
circulation of hot water through distribution of the heating system during the summer.
Lighting
The building spaces are well lit basically, with windows tinted to avoid direct solar
gains. Many small windows are preferred to the large areas which provides a balanced daylight
without heat loss. To solve the problem of ventilation, which will require the need for stack
Paraphrase This Document
Need a fresh take? Get an instant paraphrase of this document with our AI Paraphraser
8ENERGY ANALYSIS TECHNIQUES: QUEENS BUILDING
ventilation, the building is well lit from the north lights and the rooflights. The spacing of the
floor to the building heights of many areas, full-height concourse, allows the daylights to get into
the main building’s core and the use of artificial lights is reduced especially in the main areas.
This has led to significant saving of the power bills since the artificial lighting dependency in the
major areas is replaced by the daylight invasion. The building lacks the use of the automatic
switching which can further help in the saving of electric power bills, since some lights that were
used in the night can still be found lighting in the day, since they depend on manual switching.
Energy Data Analysis
Building receive heat from different places, the environment they are built around
and the internal heating, which is the space heating. The latter, is a major contributor of CO2 or
carbon emissions (Rodrigues, et al., 2002). This heating if not monitored properly and analysed
well, may lead to a bad performance of the building. This is where we talk about the degree days,
which is a powerful way of analysing the energy brought by the surrounding of the building. The
analysis of the degree days helps an engineer or the building manager to know the trends of the
performance wholesomely, it indicates whether there has been a significant change, during the
building operation and could affect the building’s energy consumption, and the ways of costing
and preparing budgets. So, the degree day analysis can help determine whether the building is
performing well or be able to evaluate the hitches that the building is faced with. For the
purposes of this paper, we shall use the energy data analysis to evaluate the performance of the
building under discussion.
9ENERGY ANALYSIS TECHNIQUES: QUEENS BUILDING
Energy performance Operational Ratings
This is an indication of how energy has been used efficiently or otherwise. It was generated to
summarize the energy efficiencies of buildings in terms of percentages. The key here is energy
conservations and good practice to cub carbon emissions or filter out the green house gasses.
This indicator is important for a manager since they must analyse what devices uses how much
of electricity or less, which part of the building is the air circulation poor? The lighting, do the
building permits natural lighting? Is the lighting enough? And so on. These are the questions that
are evaluated and then rating is done.
Total CO2 Emissions
The performance of the building also depends on the amount of CO2 emitted to the atmosphere.
This parameter must be monitored since the there’s the global campaign against carbon emission
and the one that produces the least is given a clean bill of health and marked as a safe. The CO2
that a building emit mostly comes from the use of energy the building consumes, like lighting the
building or generally use of electricity and the heating of the building or consumption of
petroleum. In the US, the electricity supplied to a building accounts for 78% of the total energy
consumed, that is the capacity of greenhouses gasses being emitted to the environment
(Katowice, 2018). There are ways of calculating the carbon emission from building and be able
to make this declaration about a building. The table below shows the parameters used in
determining the amount of carbon that a building can produce.
10ENERGY ANALYSIS TECHNIQUES: QUEENS BUILDING
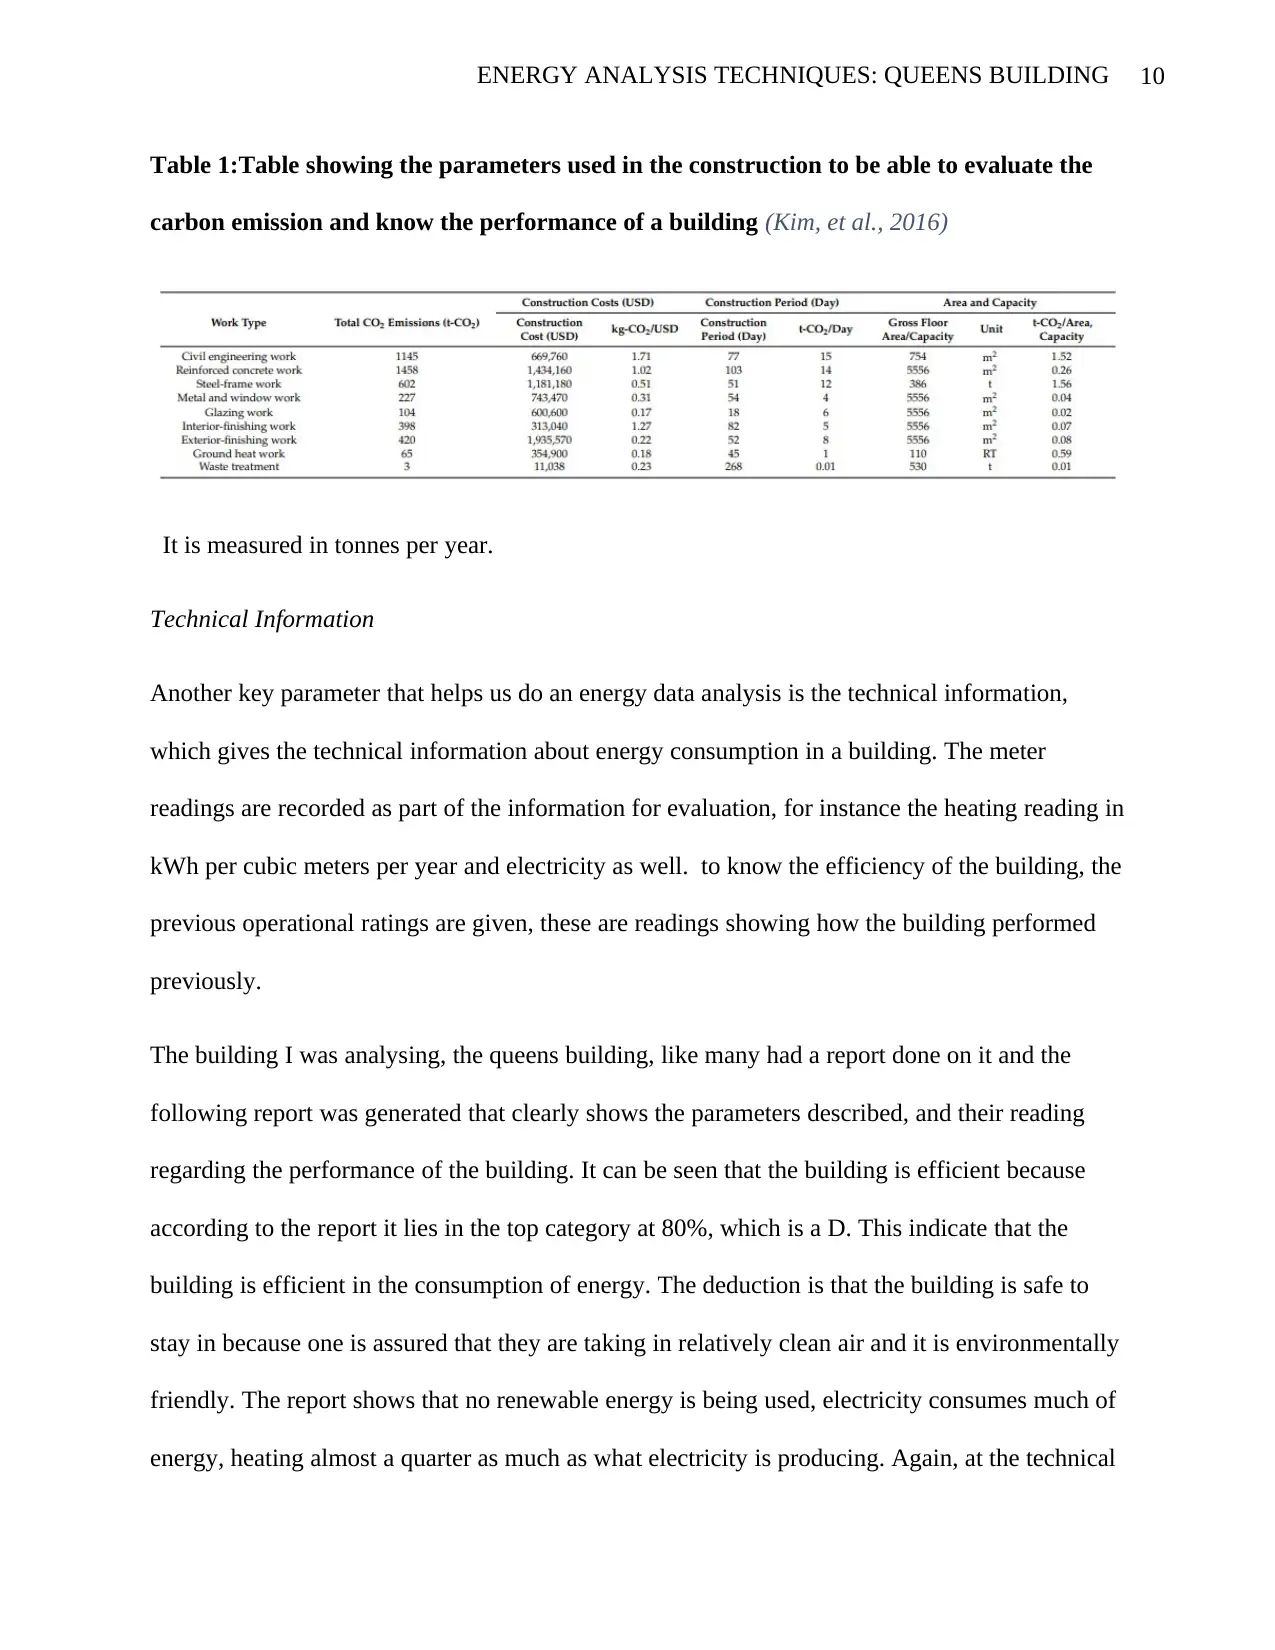
Table 1:Table showing the parameters used in the construction to be able to evaluate the
carbon emission and know the performance of a building (Kim, et al., 2016)
It is measured in tonnes per year.
Technical Information
Another key parameter that helps us do an energy data analysis is the technical information,
which gives the technical information about energy consumption in a building. The meter
readings are recorded as part of the information for evaluation, for instance the heating reading in
kWh per cubic meters per year and electricity as well. to know the efficiency of the building, the
previous operational ratings are given, these are readings showing how the building performed
previously.
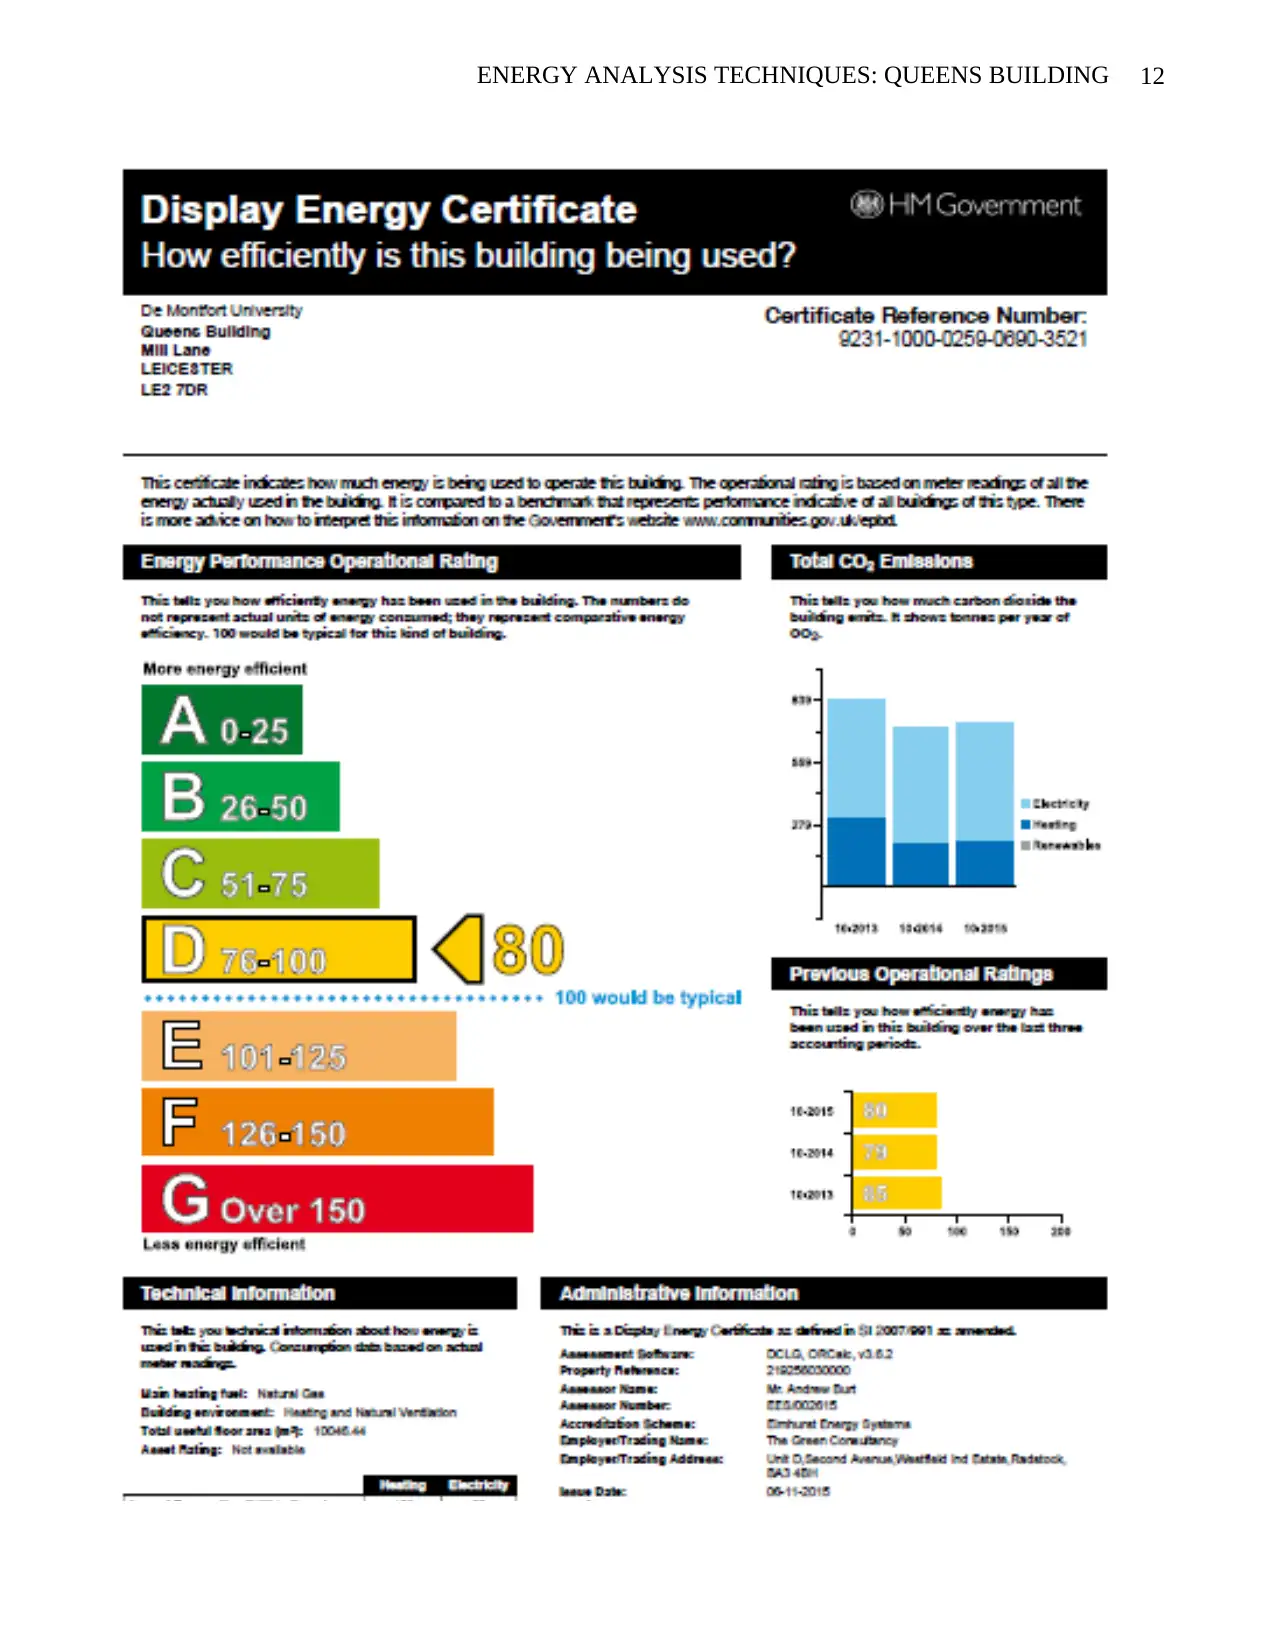
The building I was analysing, the queens building, like many had a report done on it and the
following report was generated that clearly shows the parameters described, and their reading
regarding the performance of the building. It can be seen that the building is efficient because
according to the report it lies in the top category at 80%, which is a D. This indicate that the
building is efficient in the consumption of energy. The deduction is that the building is safe to
stay in because one is assured that they are taking in relatively clean air and it is environmentally
friendly. The report shows that no renewable energy is being used, electricity consumes much of
energy, heating almost a quarter as much as what electricity is producing. Again, at the technical
Table 1:Table showing the parameters used in the construction to be able to evaluate the
carbon emission and know the performance of a building (Kim, et al., 2016)
It is measured in tonnes per year.
Technical Information
Another key parameter that helps us do an energy data analysis is the technical information,
which gives the technical information about energy consumption in a building. The meter
readings are recorded as part of the information for evaluation, for instance the heating reading in
kWh per cubic meters per year and electricity as well. to know the efficiency of the building, the
previous operational ratings are given, these are readings showing how the building performed
previously.
The building I was analysing, the queens building, like many had a report done on it and the
following report was generated that clearly shows the parameters described, and their reading
regarding the performance of the building. It can be seen that the building is efficient because
according to the report it lies in the top category at 80%, which is a D. This indicate that the
building is efficient in the consumption of energy. The deduction is that the building is safe to
stay in because one is assured that they are taking in relatively clean air and it is environmentally
friendly. The report shows that no renewable energy is being used, electricity consumes much of
energy, heating almost a quarter as much as what electricity is producing. Again, at the technical
Secure Best Marks with AI Grader
Need help grading? Try our AI Grader for instant feedback on your assignments.
11ENERGY ANALYSIS TECHNIQUES: QUEENS BUILDING
report, shows the building does not use renewable energy sources, annual amount of electricity is
a lot, with the annual taking 103kWh/m3 for heating and 98kWh/m3 and the typical amount of
energy being used stands at 250 for heating and 80kWh/m2 per year. The previous operational
rating shows the building is on an upward trend which is great for a building aspiring to inspire
occupancy. The last part of the report just shows the official information about the building
construction date, date of issue, when the information expires and the building is due for another
evaluation. This report is handed to the building owner or the caretaker in charge of the building
operations.
12ENERGY ANALYSIS TECHNIQUES: QUEENS BUILDING
13ENERGY ANALYSIS TECHNIQUES: QUEENS BUILDING
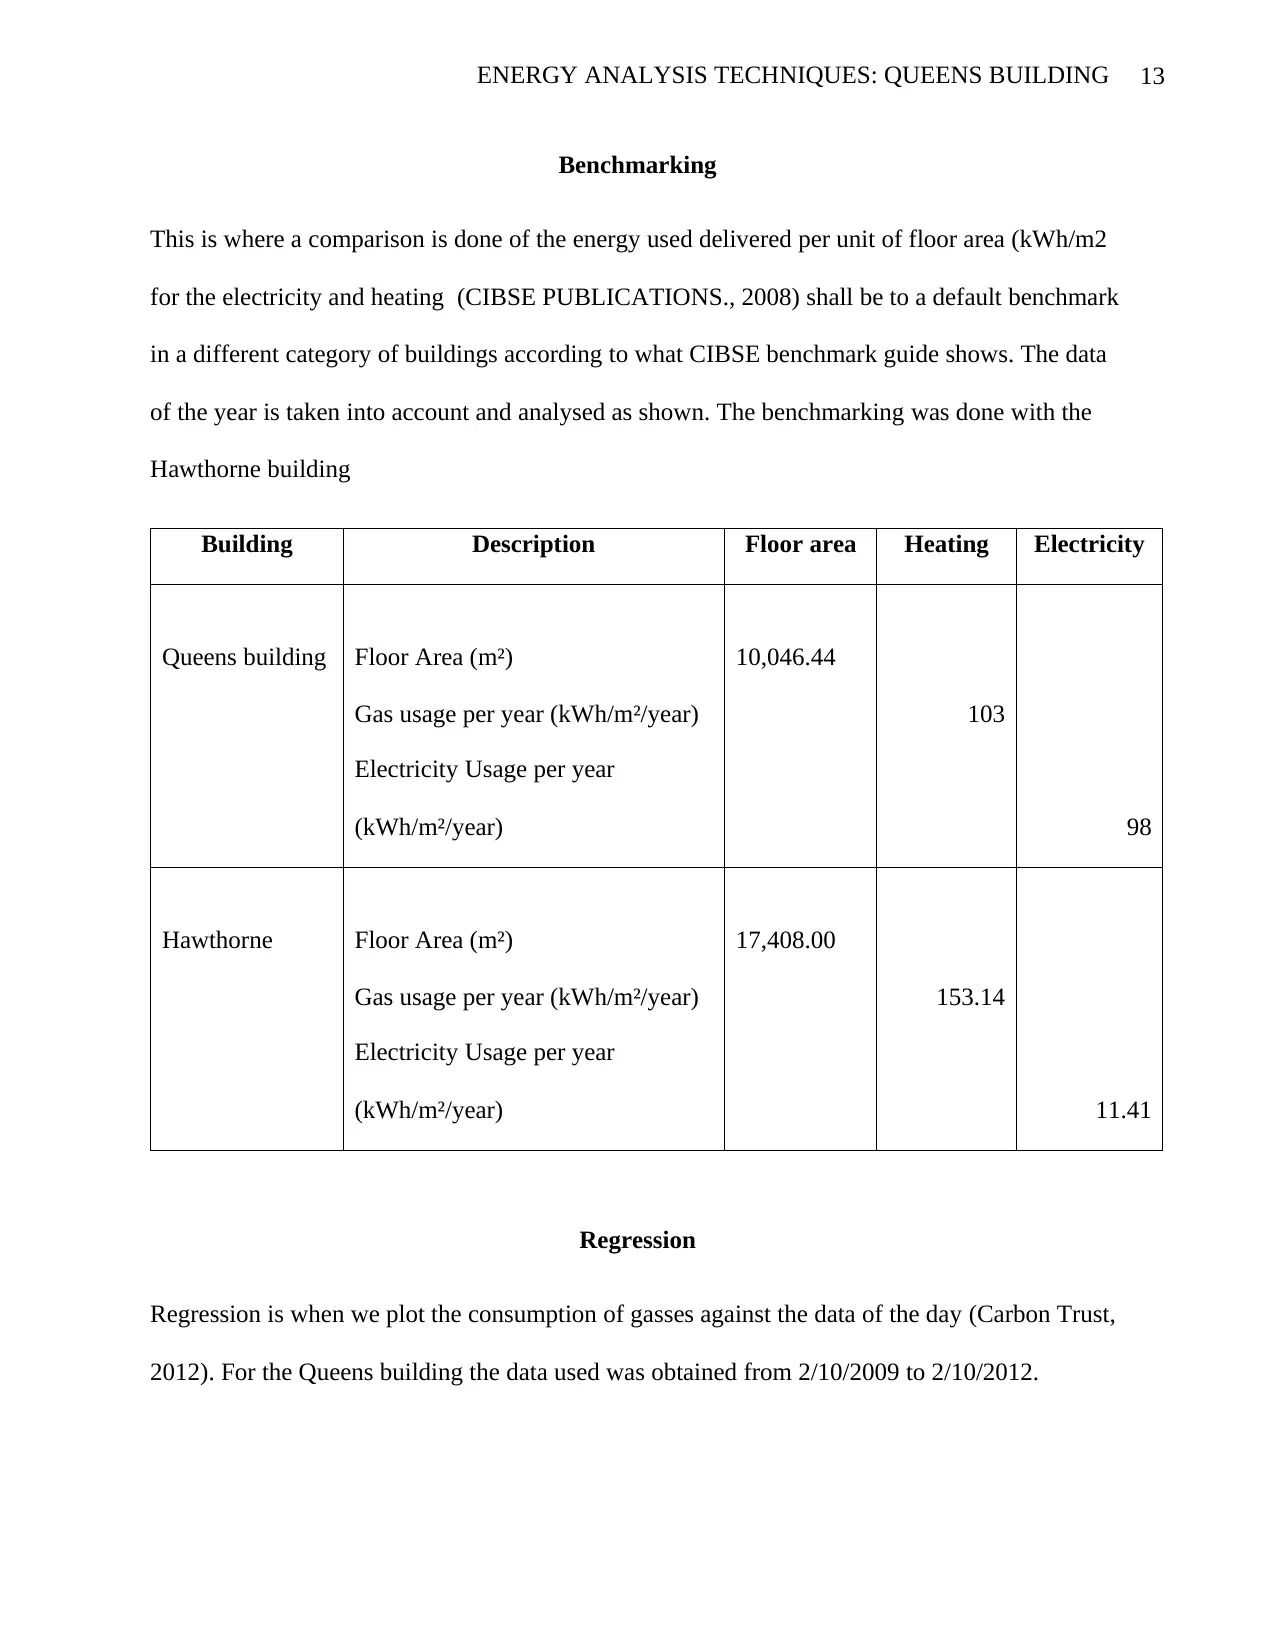
Benchmarking
This is where a comparison is done of the energy used delivered per unit of floor area (kWh/m2
for the electricity and heating (CIBSE PUBLICATIONS., 2008) shall be to a default benchmark
in a different category of buildings according to what CIBSE benchmark guide shows. The data
of the year is taken into account and analysed as shown. The benchmarking was done with the
Hawthorne building
Building Description Floor area Heating Electricity
Queens building Floor Area (m²) 10,046.44
Gas usage per year (kWh/m²/year) 103
Electricity Usage per year
(kWh/m²/year) 98
Hawthorne Floor Area (m²) 17,408.00
Gas usage per year (kWh/m²/year) 153.14
Electricity Usage per year
(kWh/m²/year) 11.41
Regression
Regression is when we plot the consumption of gasses against the data of the day (Carbon Trust,
2012). For the Queens building the data used was obtained from 2/10/2009 to 2/10/2012.
Paraphrase This Document
Need a fresh take? Get an instant paraphrase of this document with our AI Paraphraser
14ENERGY ANALYSIS TECHNIQUES: QUEENS BUILDING
0.00 20.00 40.00 60.00 80.00 100.00 120.00 140.00 160.00 180.00
0.0000
50.0000
100.0000
150.0000
200.0000
250.0000
f(x) = 0.627143562038919 x + 26.1859607673392
R² = 0.234992776797022
Weekly gas usage vs Degree days
Degree days per week
Gas Usage kWh
0.00 20.00 40.00 60.00 80.00 100.00 120.00 140.00 160.00 180.00 200.00
0.0000
10.0000
20.0000
30.0000
40.0000
50.0000
60.0000
70.0000
80.0000
90.0000
100.0000
f(x) = − 0.0257637976525906 x + 73.7975196621874
R² = 0.0148231070611614
Weekly Elec. usage v Degree Days
Deree days per week
Elec usage per kWh
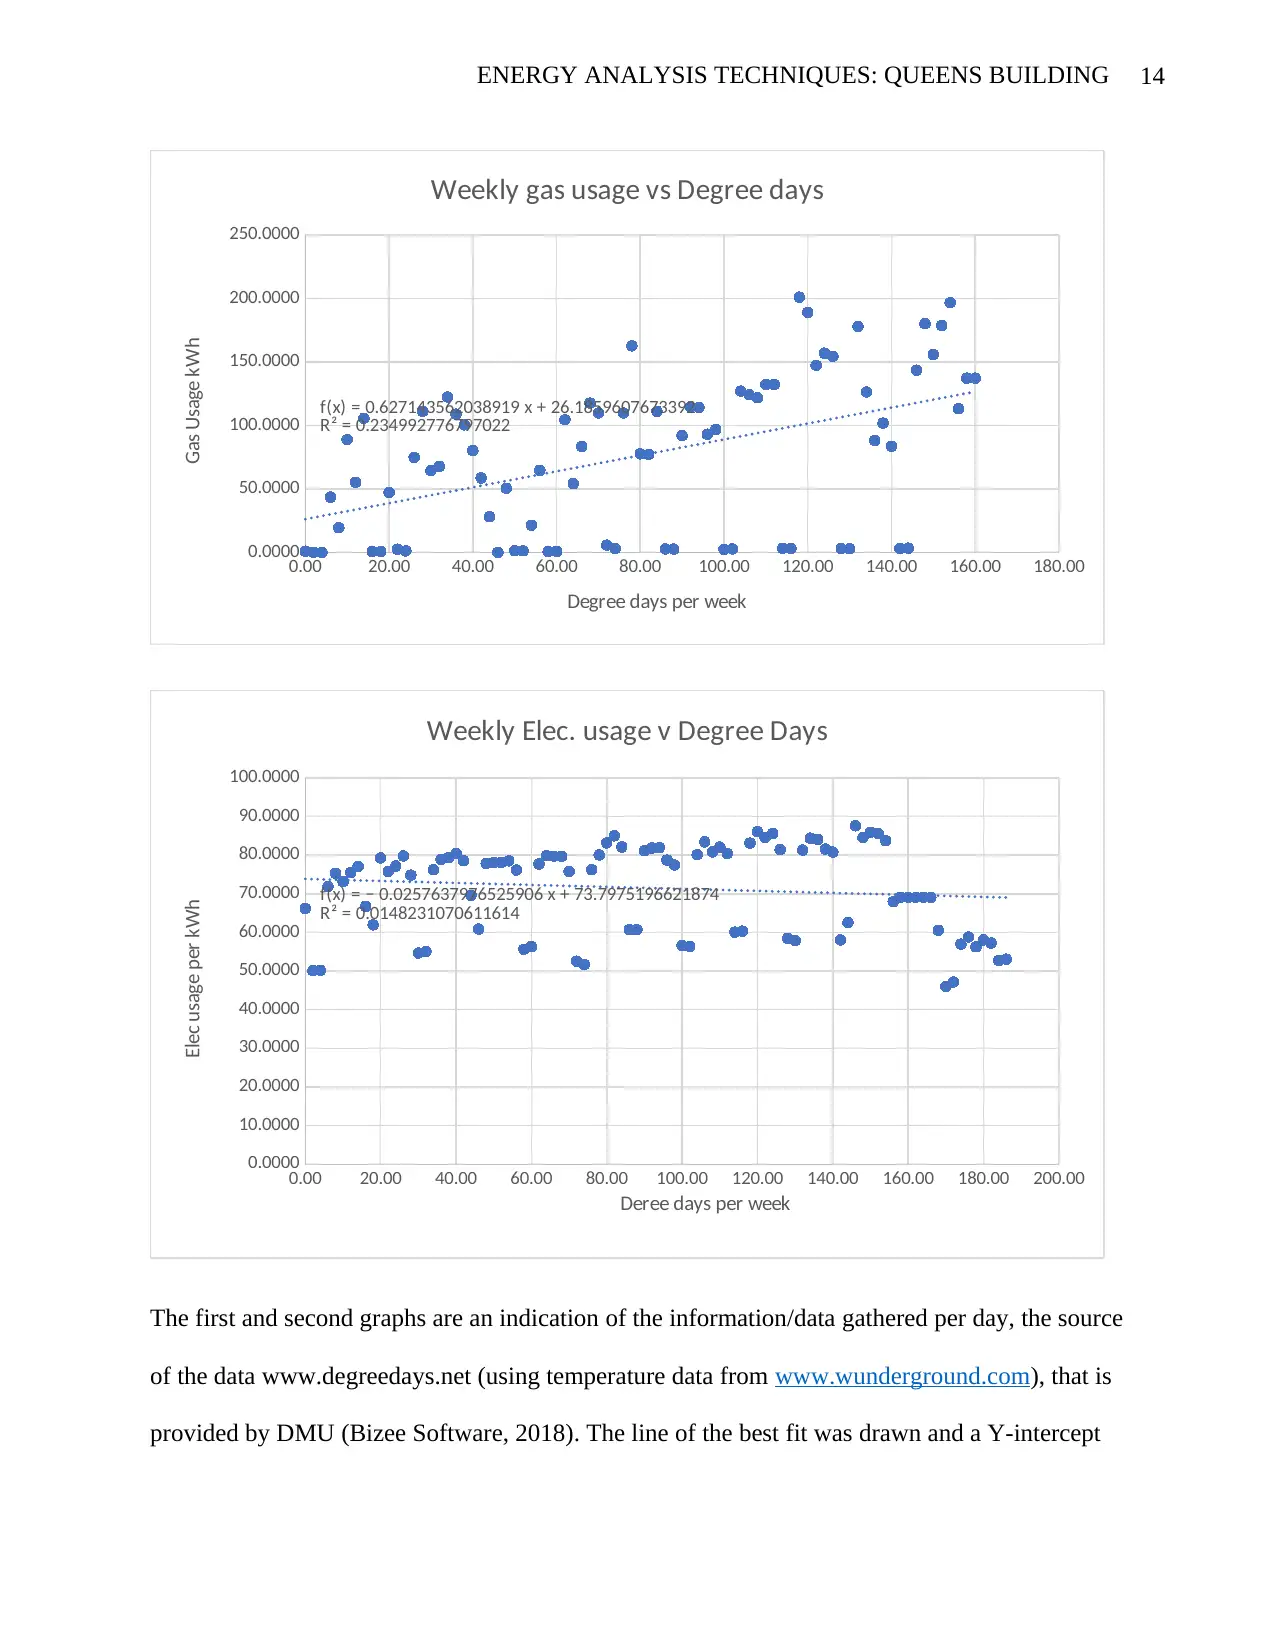
The first and second graphs are an indication of the information/data gathered per day, the source
of the data www.degreedays.net (using temperature data from www.wunderground.com), that is
provided by DMU (Bizee Software, 2018). The line of the best fit was drawn and a Y-intercept
0.00 20.00 40.00 60.00 80.00 100.00 120.00 140.00 160.00 180.00
0.0000
50.0000
100.0000
150.0000
200.0000
250.0000
f(x) = 0.627143562038919 x + 26.1859607673392
R² = 0.234992776797022
Weekly gas usage vs Degree days
Degree days per week
Gas Usage kWh
0.00 20.00 40.00 60.00 80.00 100.00 120.00 140.00 160.00 180.00 200.00
0.0000
10.0000
20.0000
30.0000
40.0000
50.0000
60.0000
70.0000
80.0000
90.0000
100.0000
f(x) = − 0.0257637976525906 x + 73.7975196621874
R² = 0.0148231070611614
Weekly Elec. usage v Degree Days
Deree days per week
Elec usage per kWh
The first and second graphs are an indication of the information/data gathered per day, the source
of the data www.degreedays.net (using temperature data from www.wunderground.com), that is
provided by DMU (Bizee Software, 2018). The line of the best fit was drawn and a Y-intercept
15ENERGY ANALYSIS TECHNIQUES: QUEENS BUILDING
determined. The line of the best fit intercepted the axis y at 26.186kWh with a significantly small
scatter, the R2 was found to be 0.235, showing the acceptable level of the system control. For
Electricity on the other hand, has its Y-intercept at 73.798kWh, and the R2 found to be 0.0148
Oct Nov Dec Jan Feb Mar Apr May Jun Jul Aug Sep Oct
2009 2010
0
500
1000
1500
2000
2500
3000
3500
4000
4500
5000
Gas vs Degree days -Monthly
Oct Nov Dec Jan Feb Mar Apr May Jun Jul Aug Sep Oct Nov
2009 2010
0
500
1000
1500
2000
2500
Total
16ENERGY ANALYSIS TECHNIQUES: QUEENS BUILDING
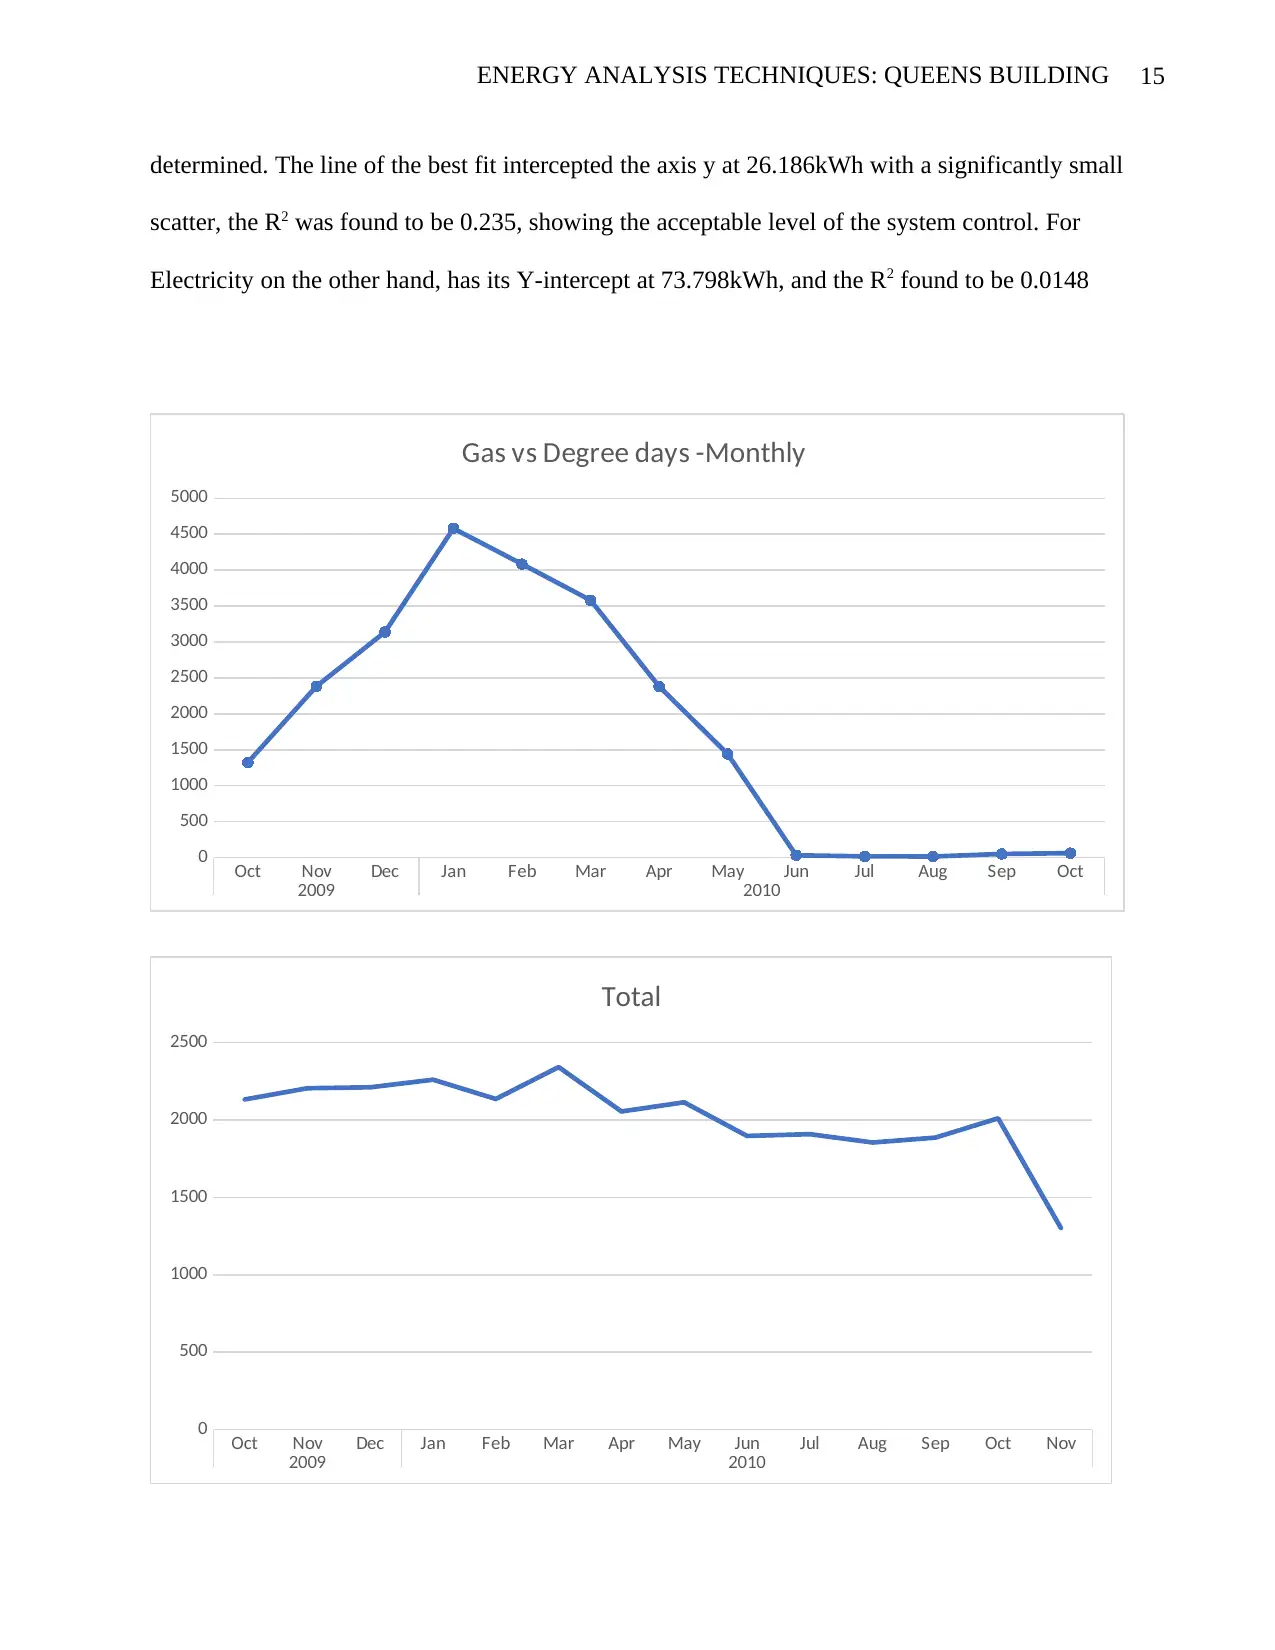
There was a seasonal effect when we now shift focus to the monthly review, the average gas
usage went down as the year progressed from the month of January to June, while almost no
usage was experienced from the month of June to October wrapping up the year as we
approached the 2nd of October. There was a minimal amount of gas used at the month of June to
October, probably the occupancy during those times were less. At the same time electricity usage
was also on the downward trend during the mentioned time
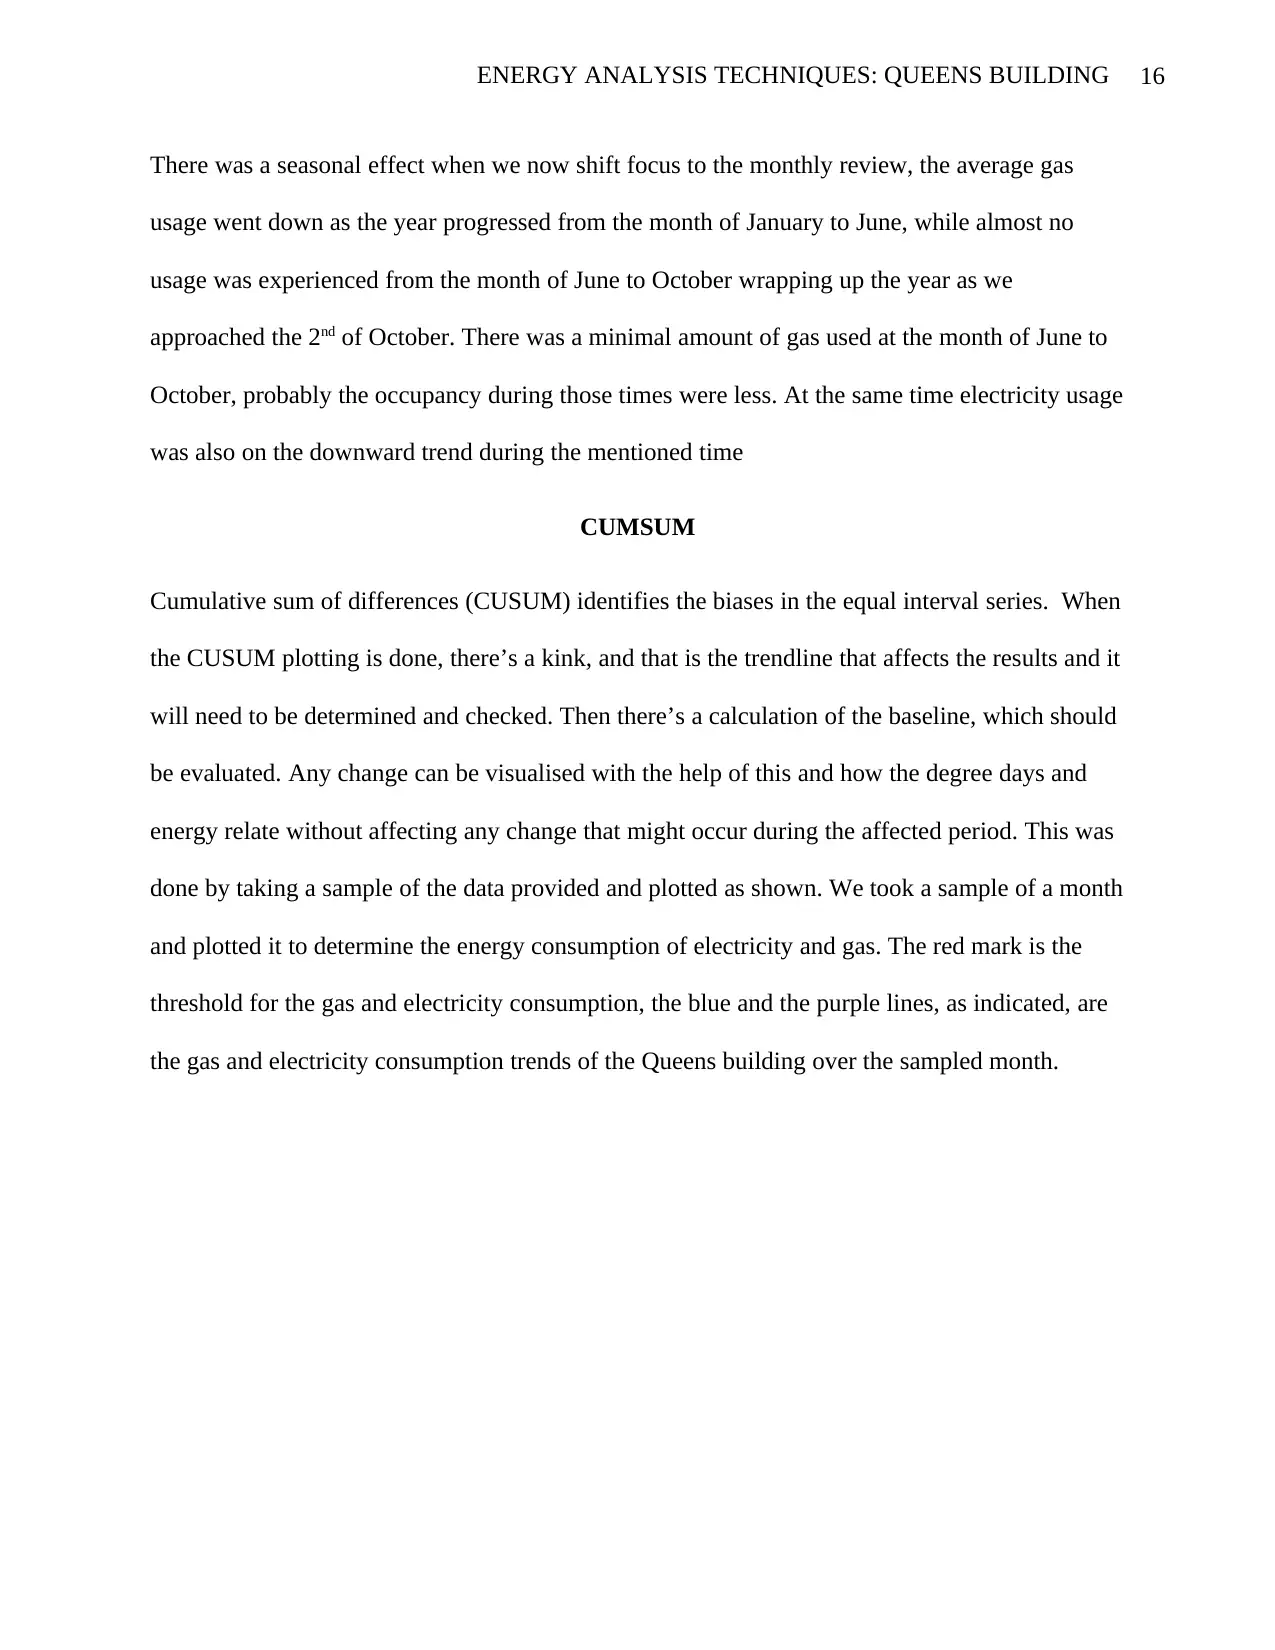
CUMSUM
Cumulative sum of differences (CUSUM) identifies the biases in the equal interval series. When
the CUSUM plotting is done, there’s a kink, and that is the trendline that affects the results and it
will need to be determined and checked. Then there’s a calculation of the baseline, which should
be evaluated. Any change can be visualised with the help of this and how the degree days and
energy relate without affecting any change that might occur during the affected period. This was
done by taking a sample of the data provided and plotted as shown. We took a sample of a month
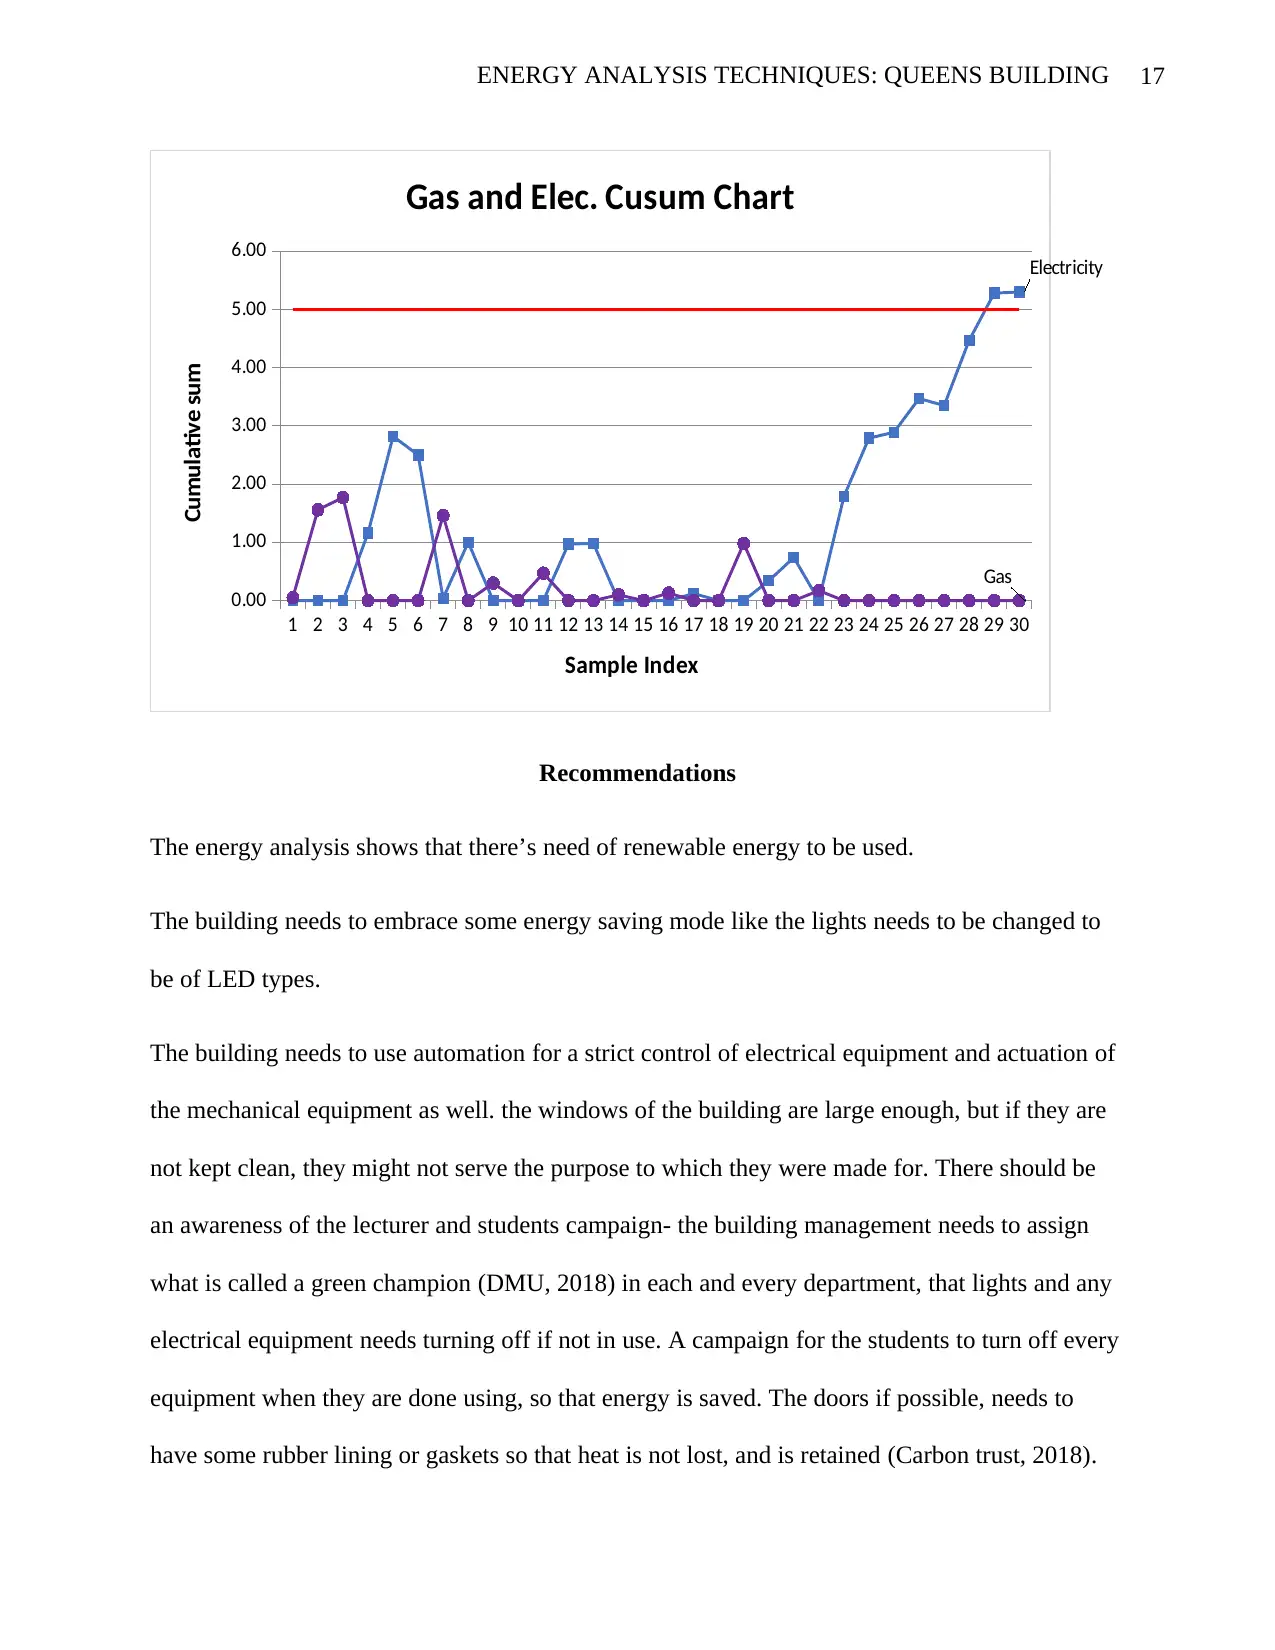
and plotted it to determine the energy consumption of electricity and gas. The red mark is the
threshold for the gas and electricity consumption, the blue and the purple lines, as indicated, are
the gas and electricity consumption trends of the Queens building over the sampled month.
There was a seasonal effect when we now shift focus to the monthly review, the average gas
usage went down as the year progressed from the month of January to June, while almost no
usage was experienced from the month of June to October wrapping up the year as we
approached the 2nd of October. There was a minimal amount of gas used at the month of June to
October, probably the occupancy during those times were less. At the same time electricity usage
was also on the downward trend during the mentioned time
CUMSUM
Cumulative sum of differences (CUSUM) identifies the biases in the equal interval series. When
the CUSUM plotting is done, there’s a kink, and that is the trendline that affects the results and it
will need to be determined and checked. Then there’s a calculation of the baseline, which should
be evaluated. Any change can be visualised with the help of this and how the degree days and
energy relate without affecting any change that might occur during the affected period. This was
done by taking a sample of the data provided and plotted as shown. We took a sample of a month
and plotted it to determine the energy consumption of electricity and gas. The red mark is the
threshold for the gas and electricity consumption, the blue and the purple lines, as indicated, are
the gas and electricity consumption trends of the Queens building over the sampled month.
Secure Best Marks with AI Grader
Need help grading? Try our AI Grader for instant feedback on your assignments.
17ENERGY ANALYSIS TECHNIQUES: QUEENS BUILDING
1 2 3 4 5 6 7 8 9 10 11 12 13 14 15 16 17 18 19 20 21 22 23 24 25 26 27 28 29 30
0.00
1.00
2.00
3.00
4.00
5.00
6.00 Electricity
Gas
Gas and Elec. Cusum Chart
Sample Index
Cumulative sum
Recommendations
The energy analysis shows that there’s need of renewable energy to be used.
The building needs to embrace some energy saving mode like the lights needs to be changed to
be of LED types.
The building needs to use automation for a strict control of electrical equipment and actuation of
the mechanical equipment as well. the windows of the building are large enough, but if they are
not kept clean, they might not serve the purpose to which they were made for. There should be
an awareness of the lecturer and students campaign- the building management needs to assign
what is called a green champion (DMU, 2018) in each and every department, that lights and any
electrical equipment needs turning off if not in use. A campaign for the students to turn off every
equipment when they are done using, so that energy is saved. The doors if possible, needs to
have some rubber lining or gaskets so that heat is not lost, and is retained (Carbon trust, 2018).
18ENERGY ANALYSIS TECHNIQUES: QUEENS BUILDING
The cleaning department needs to be encouraged, motivated or appraised to ensure that the
windows are cleaned for the natural light to enter the rooms and the hallways. This is important
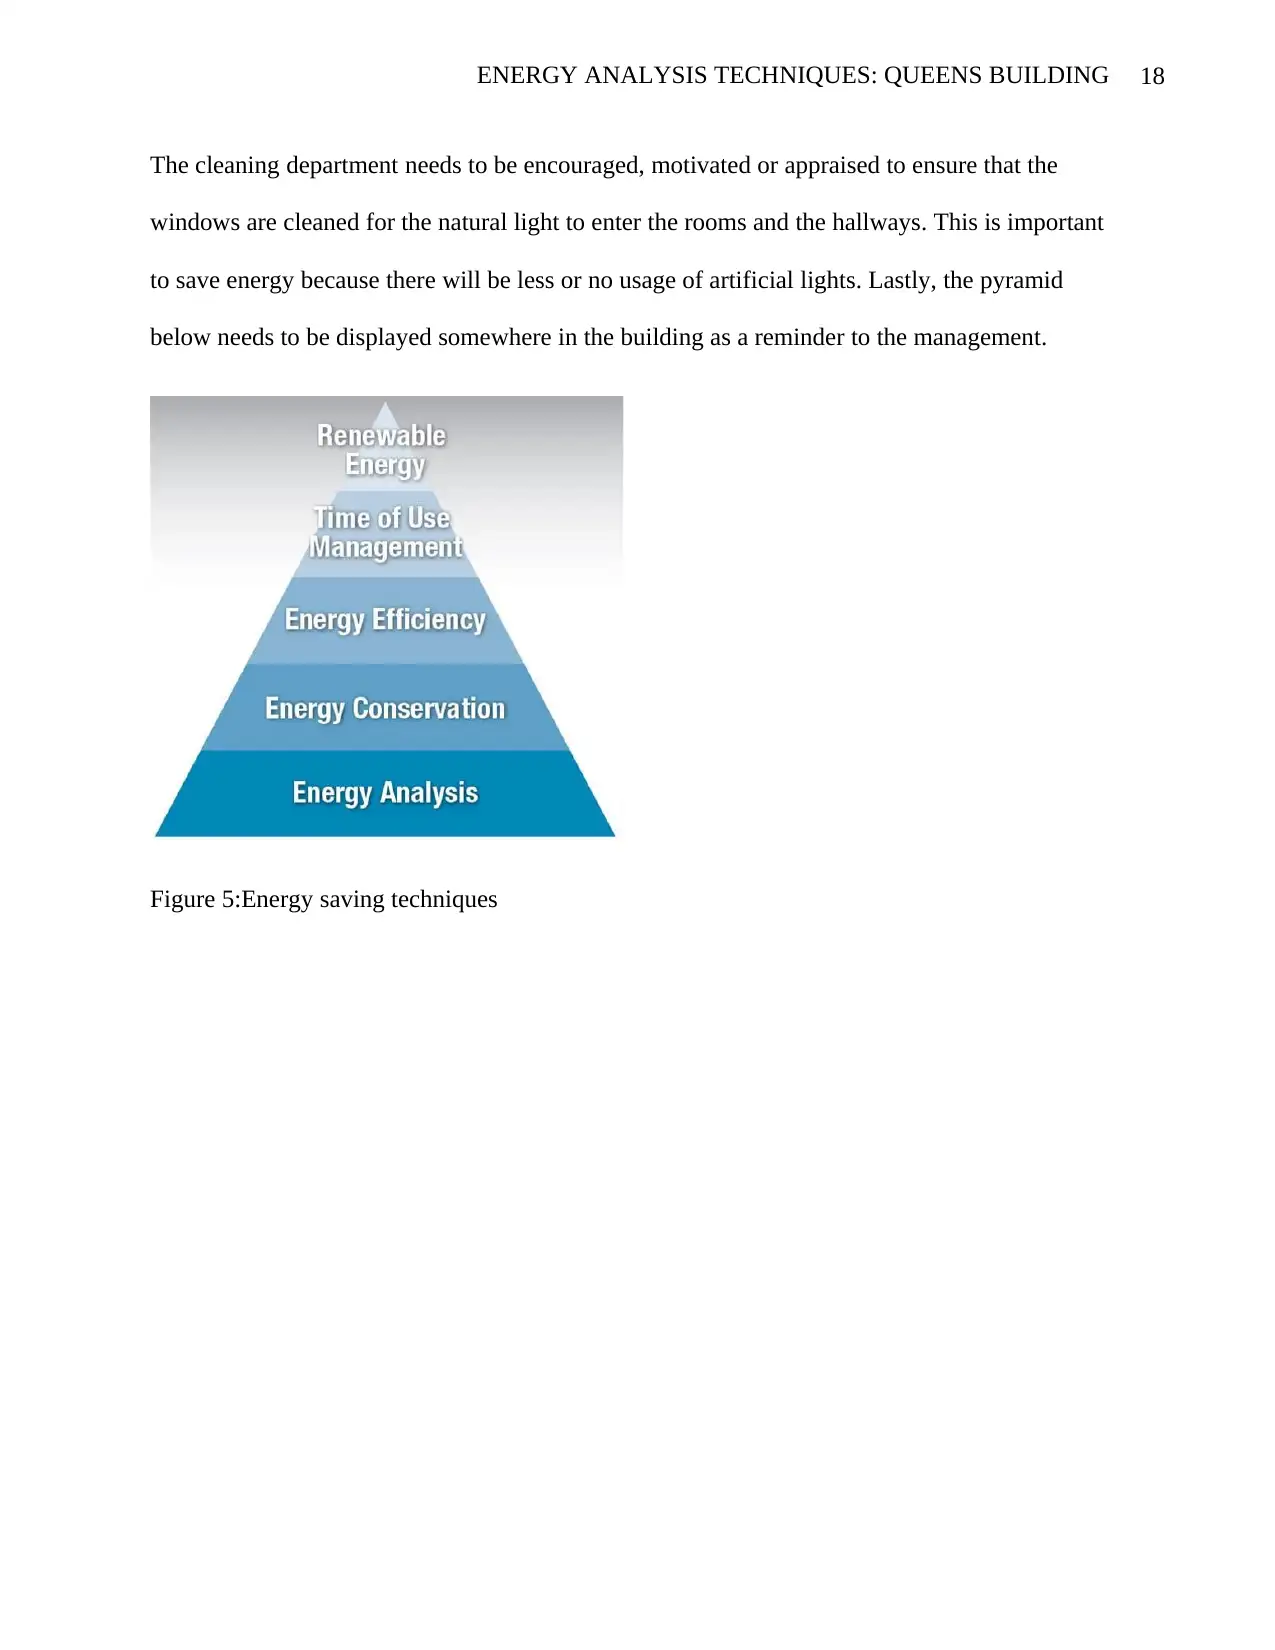
to save energy because there will be less or no usage of artificial lights. Lastly, the pyramid
below needs to be displayed somewhere in the building as a reminder to the management.
Figure 5:Energy saving techniques
The cleaning department needs to be encouraged, motivated or appraised to ensure that the
windows are cleaned for the natural light to enter the rooms and the hallways. This is important
to save energy because there will be less or no usage of artificial lights. Lastly, the pyramid
below needs to be displayed somewhere in the building as a reminder to the management.
Figure 5:Energy saving techniques
19ENERGY ANALYSIS TECHNIQUES: QUEENS BUILDING
References
Bizee Software, 2018. Heating & Cooling Degree Days - Free Worldwide Data Calculation.
[Online]
Available at: http://www.degreedays.net/
[Accessed 13 May 2019].
Bunn, R., 1993. Learning Curve. Building Services Journal, p. 10.
Carbon Trust, 2012. Degree days for energy management-a practical introduction. 1st ed.,
London: Carbontrust.
Carbon trust, 2018. CTL063 How to implement draught proofing, London: The Carborn trust.
CIBSE PUBLICATIONS., 2008. Energy Benchmarks, Norwhich: CIBSE TM46.
DMU, 2018. Environmental Champions. [Online]
Available at:
http://www.dmu.ac.uk/about-dmu/sustainability/sustainable-campus/environmental-
champions.aspx
[Accessed 17 May 2019].
Katowice, 2018. Buildings and construction sector – Huge untapped potential for emission
reductions. [Online]
Available at:
https://www.unenvironment.org/news-and-stories/press-release/buildings-and-
construction-sector-huge-untapped-potential-emission
[Accessed 13 May 2019].
Paraphrase This Document
Need a fresh take? Get an instant paraphrase of this document with our AI Paraphraser
20ENERGY ANALYSIS TECHNIQUES: QUEENS BUILDING
Kim, T., Hong, G. & Kim, H., 2016. On-Site Measurements of CO2 Emissions during the
Construction Phase of a Building Complex, Seoul, Korea: Department of
Architectural Engineering, Yonsei University.
Rodrigues, C. M., Barnes, J., Farebrother, D. & Gaddas, R., 2002. Degree days for energy
management. Good Practice Guide 310, pp. 3-4.
1 out of 20


Your All-in-One AI-Powered Toolkit for Academic Success.
+13062052269
info@desklib.com
Available 24*7 on WhatsApp / Email
![[object Object]](/_next/static/media/star-bottom.7253800d.svg)
Unlock your academic potential
© 2024 | Zucol Services PVT LTD | All rights reserved.