Financial Ratio Analysis for Business Performance: Redding & Neaves
VerifiedAdded on 2023/04/17
|18
|4073
|325
Report
AI Summary
This report conducts a financial analysis of Redding Co. and Neaves Co., two specialist manufacturers, using financial ratio analysis to assess their performance in terms of profitability, efficiency, liquidity, and solvency. The report calculates and compares key financial ratios for both companies, including net profit margin, return on assets, inventory turnover, asset turnover, current ratio, quick ratio, debt to equity ratio, interest coverage ratio, earnings per share and price earning ratio. It also discusses the role of agency in achieving the objectives of both companies and examines the impact of raising funds through additional loans or equity on Redding Co. The analysis provides insights into the strengths and weaknesses of each company and highlights the importance of financial ratios as tools for interpreting and assessing business performance. Desklib provides a platform for students to access this report and other solved assignments and past papers.

1
Financial Management
Financial Management
Paraphrase This Document
Need a fresh take? Get an instant paraphrase of this document with our AI Paraphraser
2
Contents
Introduction......................................................................................................................................3
Part 1: Calculation and analysis of ratios of two given companies.................................................3
Part 1.i and Part 1.ii: Calculation of ratios and Comparison of Financial Performance of
Companies....................................................................................................................................3
Part 1.iii: Use of Financial Ratios as a tool for Interpreting and Assessing Business
Performance.................................................................................................................................9
Part 2: Definition of the term ‘Agency’ and its used in Achieving the Objectives of Redding Co.
and Neaves Co.................................................................................................................................9
Part 3: Impact of raising funds for the refurbishment of equipments through using additional
loans or equity on Redding Company...........................................................................................11
Conclusion.....................................................................................................................................13
References......................................................................................................................................14
Appendix........................................................................................................................................16
3
Introduction
The present report is developed for analyzing the financial performance of tow specialist
manufacture companies, that are, Redding Co. and Neaves Co. It has been carried out with the
use of the financial ratio analysis. It is followed by discussing the impact of the concept of
agency on meeting the growth objectives of the company. Lastly, it has also discussed the impact
on the company Redding of incorporating the use of additional loans to gain funds.
Part 1: Calculation and analysis of ratios of two given companies
Part 1.i and Part 1.ii: Calculation of ratios and Comparison of Financial Performance of
Companies
This section has provided detailed calculation of ratios of Reddings Company and Neaves
Company. Two ratios of each category of ratios analysis have been calculated and discussed
below.
Ratio analysis is the quantitative business methods used to evaluate the company
performance in relation to its liquidity, profitability, efficiency and solvency. Ratio analysis uses
information provided in the financial statements of the company and compare it to generate the
results that describe the company performance. The main objective of ratio analysis is to
interpret the financial statements and other financial data provided in the annual report. The
purpose is to provide the essential information to the stakeholders of the company so that they
can make appropriate decisions (Brigham and Michael, 2013).
Ratio analysis has been categorized in five board groups and they are given below:
Profitability Ratios
Efficiency Ratios
Liquidity Ratios
Gearing Ratios
Investors Ratios
Profitability Ratios
Profitability ratios refers to the class of financial measures that is used to assess
company’s ability to generate earnings in relation to various metrics such as revenue,
shareholder’s equity, assets and capital employed. Some of the common profitability ratios used
to assess the profitability performance of a company is gross profit margin, operating profit
margin, net profit margin, return on equity, and return on capital employed (Damodaran, 2011).
⊘ This is a preview!⊘
Do you want full access?
Subscribe today to unlock all pages.
Trusted by 1+ million students worldwide
4
Net profit Ratio Return on Assets
0.00%
5.00%
10.00%
15.00%
20.00%
25.00%
30.00%
35.00%
40.00%
25.13%
15.31%
36.10%
31.22%
Profitability Ratios
Reddings Co. Neaves Co.
Axis Title
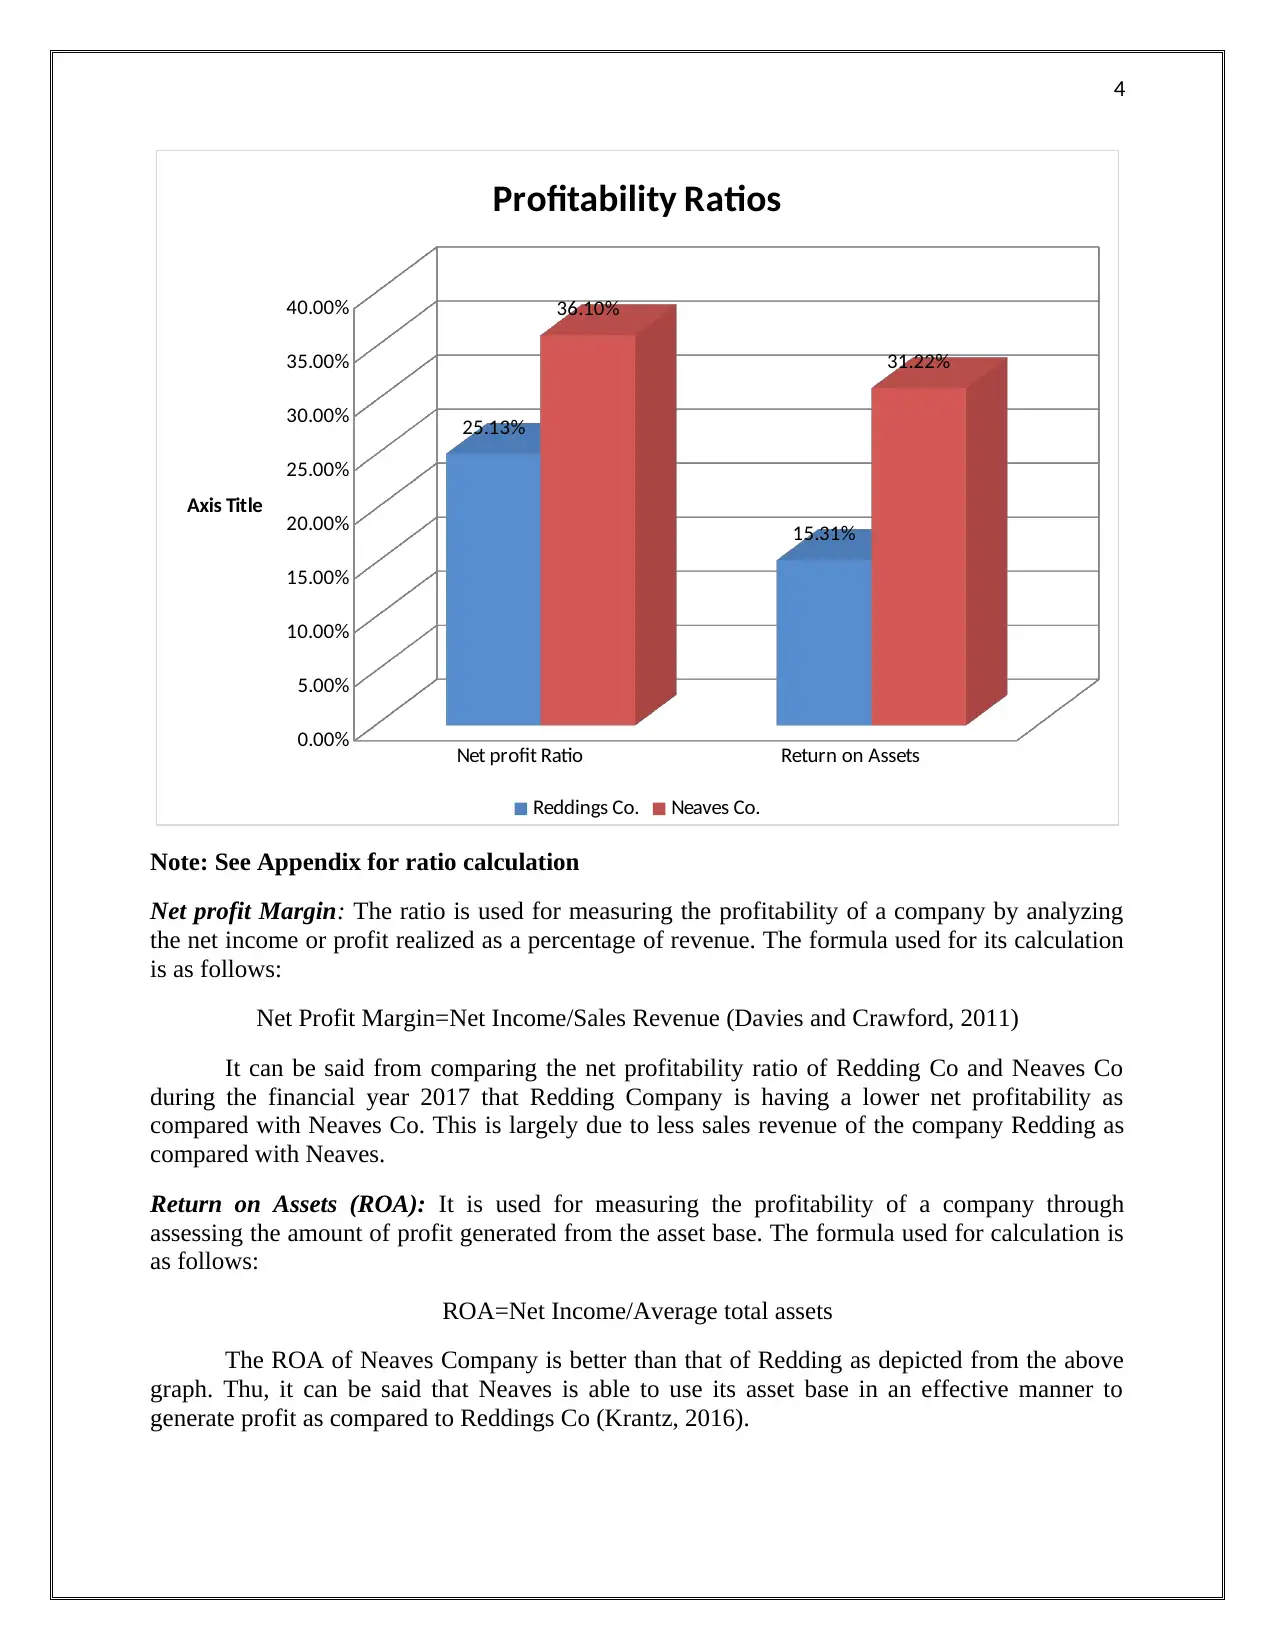
Note: See Appendix for ratio calculation
Net profit Margin: The ratio is used for measuring the profitability of a company by analyzing
the net income or profit realized as a percentage of revenue. The formula used for its calculation
is as follows:
Net Profit Margin=Net Income/Sales Revenue (Davies and Crawford, 2011)
It can be said from comparing the net profitability ratio of Redding Co and Neaves Co
during the financial year 2017 that Redding Company is having a lower net profitability as
compared with Neaves Co. This is largely due to less sales revenue of the company Redding as
compared with Neaves.
Return on Assets (ROA): It is used for measuring the profitability of a company through
assessing the amount of profit generated from the asset base. The formula used for calculation is
as follows:
ROA=Net Income/Average total assets
The ROA of Neaves Company is better than that of Redding as depicted from the above
graph. Thu, it can be said that Neaves is able to use its asset base in an effective manner to
generate profit as compared to Reddings Co (Krantz, 2016).
Net profit Ratio Return on Assets
0.00%
5.00%
10.00%
15.00%
20.00%
25.00%
30.00%
35.00%
40.00%
25.13%
15.31%
36.10%
31.22%
Profitability Ratios
Reddings Co. Neaves Co.
Axis Title
Note: See Appendix for ratio calculation
Net profit Margin: The ratio is used for measuring the profitability of a company by analyzing
the net income or profit realized as a percentage of revenue. The formula used for its calculation
is as follows:
Net Profit Margin=Net Income/Sales Revenue (Davies and Crawford, 2011)
It can be said from comparing the net profitability ratio of Redding Co and Neaves Co
during the financial year 2017 that Redding Company is having a lower net profitability as
compared with Neaves Co. This is largely due to less sales revenue of the company Redding as
compared with Neaves.
Return on Assets (ROA): It is used for measuring the profitability of a company through
assessing the amount of profit generated from the asset base. The formula used for calculation is
as follows:
ROA=Net Income/Average total assets
The ROA of Neaves Company is better than that of Redding as depicted from the above
graph. Thu, it can be said that Neaves is able to use its asset base in an effective manner to
generate profit as compared to Reddings Co (Krantz, 2016).
Paraphrase This Document
Need a fresh take? Get an instant paraphrase of this document with our AI Paraphraser
5
As such, it can be said on the basis of profitability analysis that Redding Co. profitability
position is weaker as compared with Neaves Co. Thus, it is required on the part of Redding to
develop adequate strategies for meeting customer needs and thus enhancing its sales revenue.
Efficiency Ratios
The efficiency ratios are used for assessing the ability of a company to generate sales
from the use of its asset base. The efficiency analysis of both the companies is carried out by
calculation of the following ratios:
Inventory Turnover ratio Asset turnover ratio
0.00
1.00
2.00
3.00
4.00
5.00
6.00
7.00
8.00
9.00
Efficiency Ratios
Times
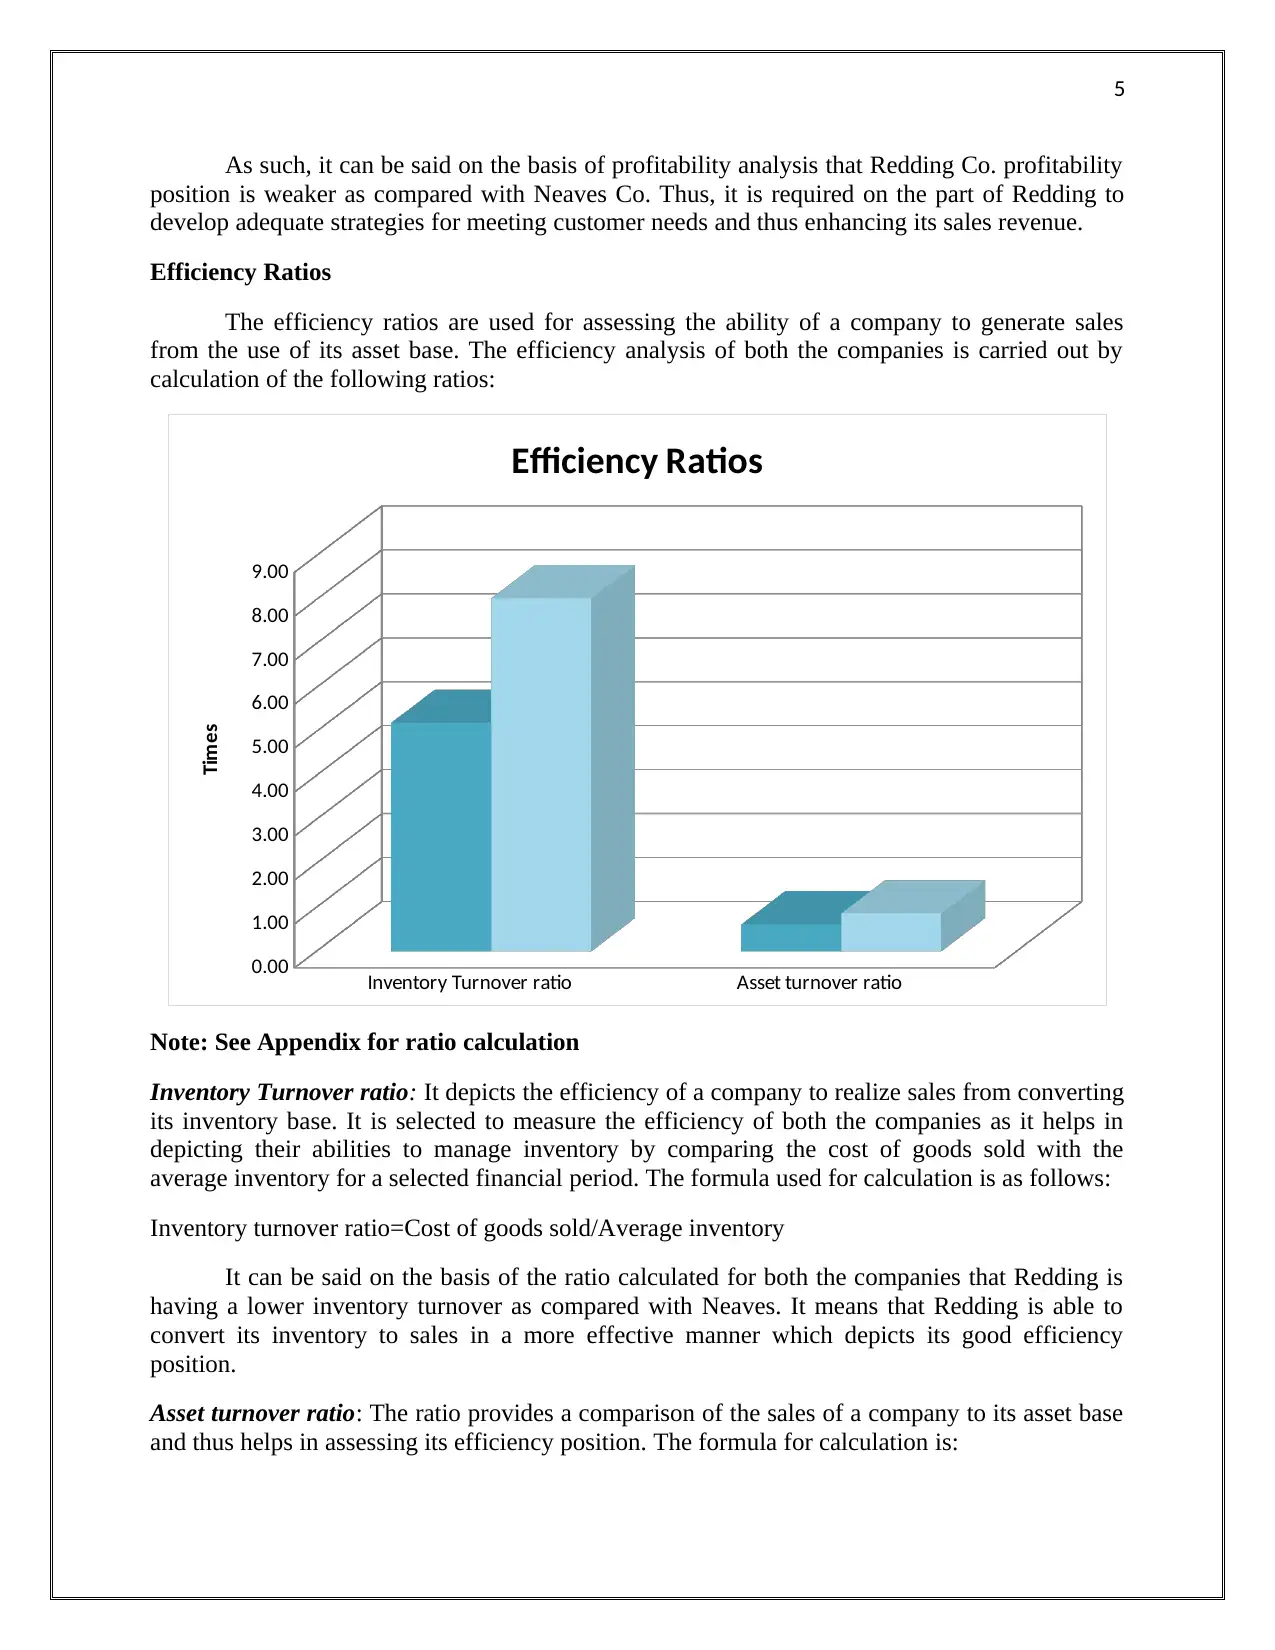
Note: See Appendix for ratio calculation
Inventory Turnover ratio: It depicts the efficiency of a company to realize sales from converting
its inventory base. It is selected to measure the efficiency of both the companies as it helps in
depicting their abilities to manage inventory by comparing the cost of goods sold with the
average inventory for a selected financial period. The formula used for calculation is as follows:
Inventory turnover ratio=Cost of goods sold/Average inventory
It can be said on the basis of the ratio calculated for both the companies that Redding is
having a lower inventory turnover as compared with Neaves. It means that Redding is able to
convert its inventory to sales in a more effective manner which depicts its good efficiency
position.
Asset turnover ratio: The ratio provides a comparison of the sales of a company to its asset base
and thus helps in assessing its efficiency position. The formula for calculation is:
As such, it can be said on the basis of profitability analysis that Redding Co. profitability
position is weaker as compared with Neaves Co. Thus, it is required on the part of Redding to
develop adequate strategies for meeting customer needs and thus enhancing its sales revenue.
Efficiency Ratios
The efficiency ratios are used for assessing the ability of a company to generate sales
from the use of its asset base. The efficiency analysis of both the companies is carried out by
calculation of the following ratios:
Inventory Turnover ratio Asset turnover ratio
0.00
1.00
2.00
3.00
4.00
5.00
6.00
7.00
8.00
9.00
Efficiency Ratios
Times
Note: See Appendix for ratio calculation
Inventory Turnover ratio: It depicts the efficiency of a company to realize sales from converting
its inventory base. It is selected to measure the efficiency of both the companies as it helps in
depicting their abilities to manage inventory by comparing the cost of goods sold with the
average inventory for a selected financial period. The formula used for calculation is as follows:
Inventory turnover ratio=Cost of goods sold/Average inventory
It can be said on the basis of the ratio calculated for both the companies that Redding is
having a lower inventory turnover as compared with Neaves. It means that Redding is able to
convert its inventory to sales in a more effective manner which depicts its good efficiency
position.
Asset turnover ratio: The ratio provides a comparison of the sales of a company to its asset base
and thus helps in assessing its efficiency position. The formula for calculation is:
6
Asset Turnover ratio=Net Sales/Average total assets
The ratio for Neaves Company is better as compared with Redding which means that it is
able to realize higher sales from its asset base (Moles and Kidwekk, 2011).
The efficiency position of Neaves is better as compared with Redding Company as
inferred from calculation of the efficiency ratios.
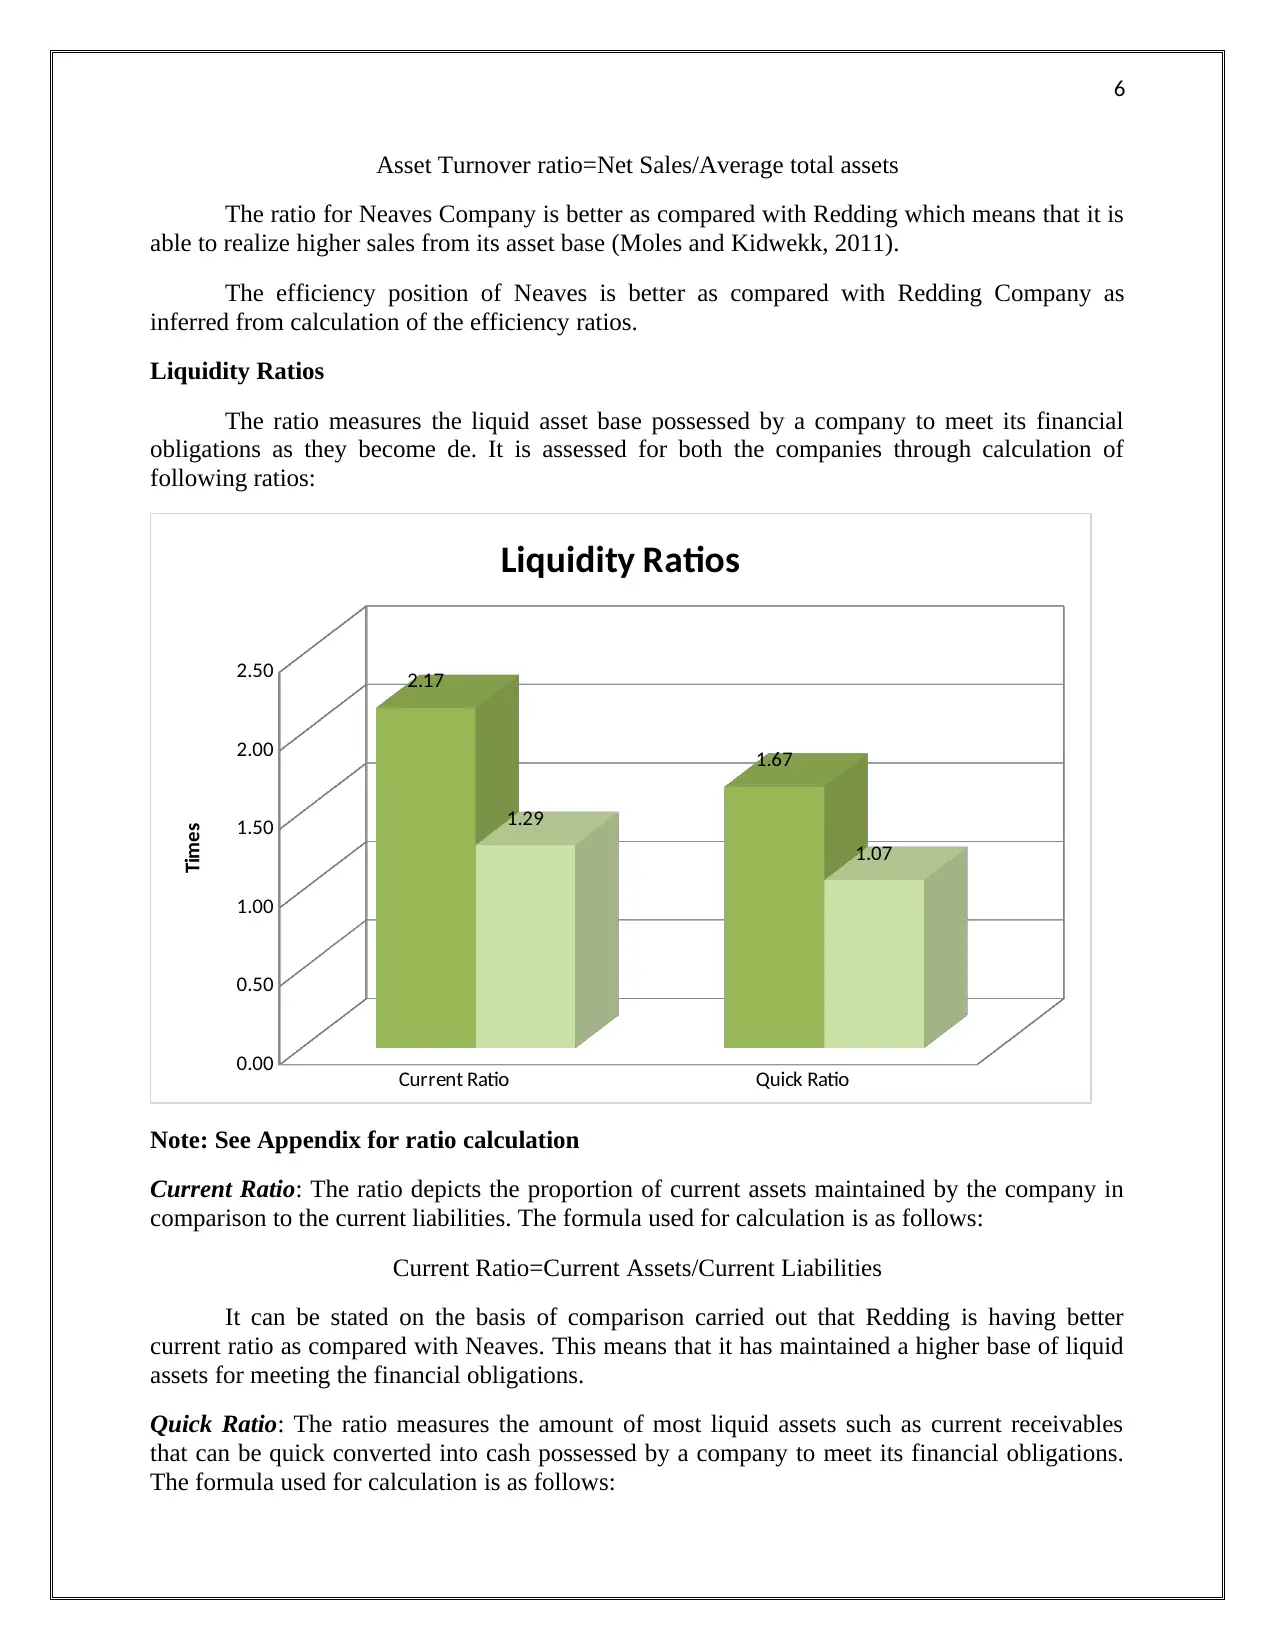
Liquidity Ratios
The ratio measures the liquid asset base possessed by a company to meet its financial
obligations as they become de. It is assessed for both the companies through calculation of
following ratios:
Current Ratio Quick Ratio
0.00
0.50
1.00
1.50
2.00
2.50 2.17
1.67
1.29
1.07
Liquidity Ratios
Times
Note: See Appendix for ratio calculation
Current Ratio: The ratio depicts the proportion of current assets maintained by the company in
comparison to the current liabilities. The formula used for calculation is as follows:
Current Ratio=Current Assets/Current Liabilities
It can be stated on the basis of comparison carried out that Redding is having better
current ratio as compared with Neaves. This means that it has maintained a higher base of liquid
assets for meeting the financial obligations.
Quick Ratio: The ratio measures the amount of most liquid assets such as current receivables
that can be quick converted into cash possessed by a company to meet its financial obligations.
The formula used for calculation is as follows:
Asset Turnover ratio=Net Sales/Average total assets
The ratio for Neaves Company is better as compared with Redding which means that it is
able to realize higher sales from its asset base (Moles and Kidwekk, 2011).
The efficiency position of Neaves is better as compared with Redding Company as
inferred from calculation of the efficiency ratios.
Liquidity Ratios
The ratio measures the liquid asset base possessed by a company to meet its financial
obligations as they become de. It is assessed for both the companies through calculation of
following ratios:
Current Ratio Quick Ratio
0.00
0.50
1.00
1.50
2.00
2.50 2.17
1.67
1.29
1.07
Liquidity Ratios
Times
Note: See Appendix for ratio calculation
Current Ratio: The ratio depicts the proportion of current assets maintained by the company in
comparison to the current liabilities. The formula used for calculation is as follows:
Current Ratio=Current Assets/Current Liabilities
It can be stated on the basis of comparison carried out that Redding is having better
current ratio as compared with Neaves. This means that it has maintained a higher base of liquid
assets for meeting the financial obligations.
Quick Ratio: The ratio measures the amount of most liquid assets such as current receivables
that can be quick converted into cash possessed by a company to meet its financial obligations.
The formula used for calculation is as follows:
⊘ This is a preview!⊘
Do you want full access?
Subscribe today to unlock all pages.
Trusted by 1+ million students worldwide
7
Quick Ratio=Quick assets/Current Liabilities
The ratio for Redding is better than that of Neaves and thus it can be said that Redding
has maintained sufficient inflows of cash to meet its financial obligations in comparison with
Neaves (Phillips and Stawarski, 2016).
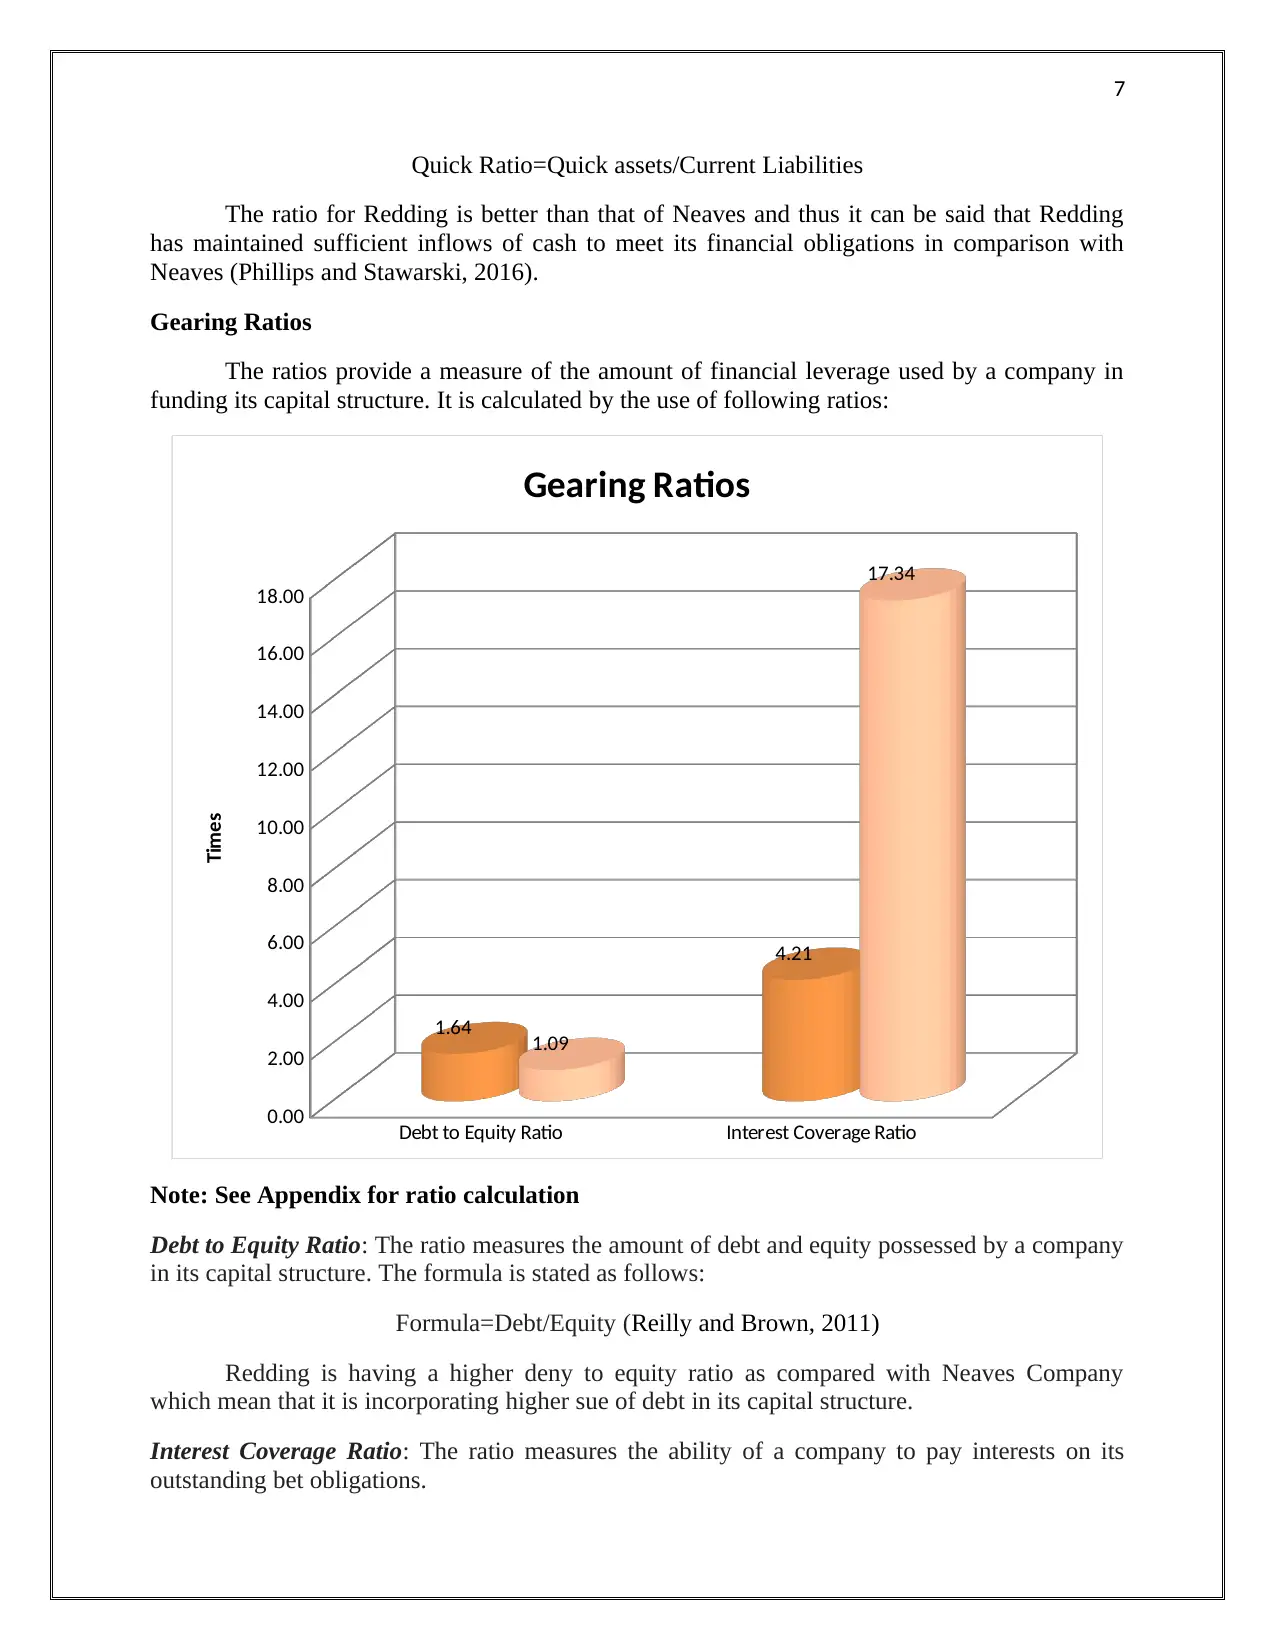
Gearing Ratios
The ratios provide a measure of the amount of financial leverage used by a company in
funding its capital structure. It is calculated by the use of following ratios:
Debt to Equity Ratio Interest Coverage Ratio
0.00
2.00
4.00
6.00
8.00
10.00
12.00
14.00
16.00
18.00
1.64
4.21
1.09
17.34
Gearing Ratios
Times
Note: See Appendix for ratio calculation
Debt to Equity Ratio: The ratio measures the amount of debt and equity possessed by a company
in its capital structure. The formula is stated as follows:
Formula=Debt/Equity (Reilly and Brown, 2011)
Redding is having a higher deny to equity ratio as compared with Neaves Company
which mean that it is incorporating higher sue of debt in its capital structure.
Interest Coverage Ratio: The ratio measures the ability of a company to pay interests on its
outstanding bet obligations.
Quick Ratio=Quick assets/Current Liabilities
The ratio for Redding is better than that of Neaves and thus it can be said that Redding
has maintained sufficient inflows of cash to meet its financial obligations in comparison with
Neaves (Phillips and Stawarski, 2016).
Gearing Ratios
The ratios provide a measure of the amount of financial leverage used by a company in
funding its capital structure. It is calculated by the use of following ratios:
Debt to Equity Ratio Interest Coverage Ratio
0.00
2.00
4.00
6.00
8.00
10.00
12.00
14.00
16.00
18.00
1.64
4.21
1.09
17.34
Gearing Ratios
Times
Note: See Appendix for ratio calculation
Debt to Equity Ratio: The ratio measures the amount of debt and equity possessed by a company
in its capital structure. The formula is stated as follows:
Formula=Debt/Equity (Reilly and Brown, 2011)
Redding is having a higher deny to equity ratio as compared with Neaves Company
which mean that it is incorporating higher sue of debt in its capital structure.
Interest Coverage Ratio: The ratio measures the ability of a company to pay interests on its
outstanding bet obligations.
Paraphrase This Document
Need a fresh take? Get an instant paraphrase of this document with our AI Paraphraser
8
Formula: EBIT/Interest Expenses
The ratio for Neaves Company is far better than Redding depicting that it is able to meet
its interest obligations more adequately (Schlichting, 2013).
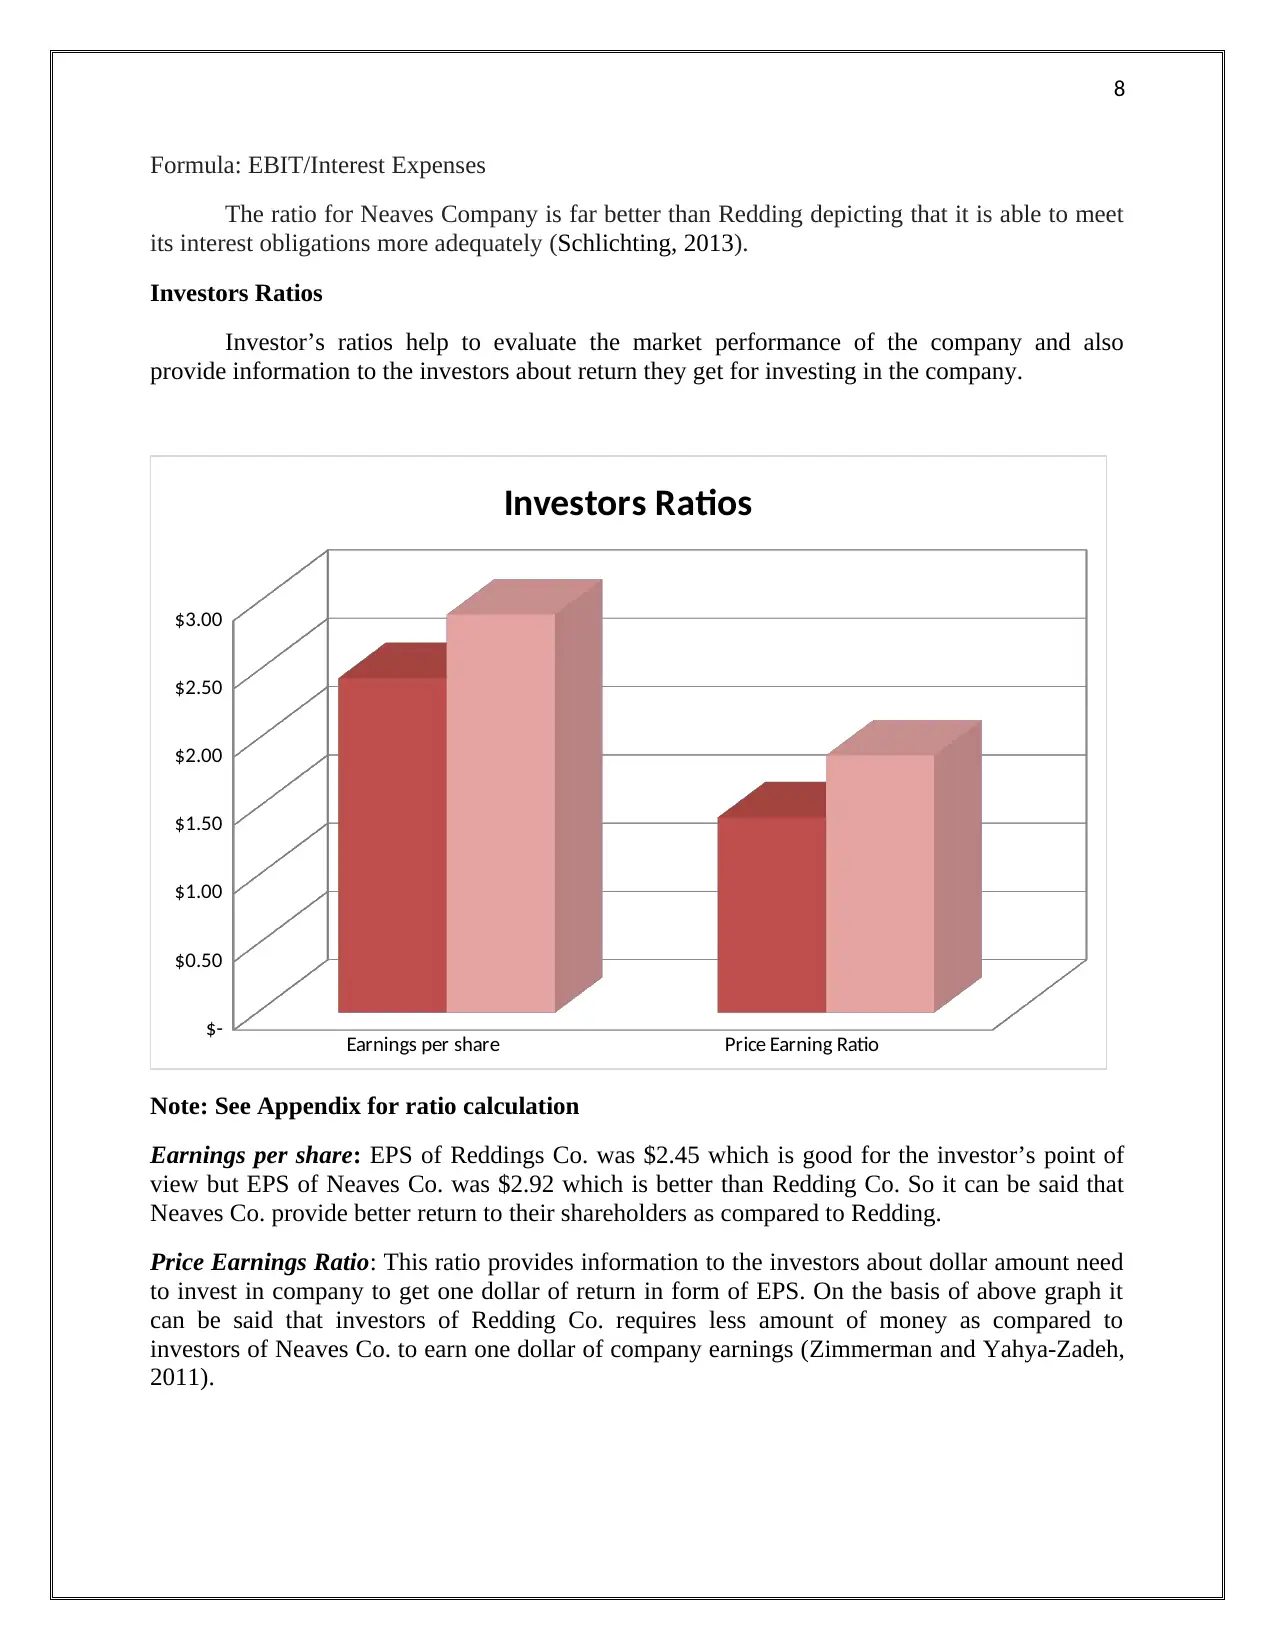
Investors Ratios
Investor’s ratios help to evaluate the market performance of the company and also
provide information to the investors about return they get for investing in the company.
Earnings per share Price Earning Ratio
$-
$0.50
$1.00
$1.50
$2.00
$2.50
$3.00
Investors Ratios
Note: See Appendix for ratio calculation
Earnings per share: EPS of Reddings Co. was $2.45 which is good for the investor’s point of
view but EPS of Neaves Co. was $2.92 which is better than Redding Co. So it can be said that
Neaves Co. provide better return to their shareholders as compared to Redding.
Price Earnings Ratio: This ratio provides information to the investors about dollar amount need
to invest in company to get one dollar of return in form of EPS. On the basis of above graph it
can be said that investors of Redding Co. requires less amount of money as compared to
investors of Neaves Co. to earn one dollar of company earnings (Zimmerman and Yahya-Zadeh,
2011).
Formula: EBIT/Interest Expenses
The ratio for Neaves Company is far better than Redding depicting that it is able to meet
its interest obligations more adequately (Schlichting, 2013).
Investors Ratios
Investor’s ratios help to evaluate the market performance of the company and also
provide information to the investors about return they get for investing in the company.
Earnings per share Price Earning Ratio
$-
$0.50
$1.00
$1.50
$2.00
$2.50
$3.00
Investors Ratios
Note: See Appendix for ratio calculation
Earnings per share: EPS of Reddings Co. was $2.45 which is good for the investor’s point of
view but EPS of Neaves Co. was $2.92 which is better than Redding Co. So it can be said that
Neaves Co. provide better return to their shareholders as compared to Redding.
Price Earnings Ratio: This ratio provides information to the investors about dollar amount need
to invest in company to get one dollar of return in form of EPS. On the basis of above graph it
can be said that investors of Redding Co. requires less amount of money as compared to
investors of Neaves Co. to earn one dollar of company earnings (Zimmerman and Yahya-Zadeh,
2011).
9
Part 1.iii: Use of Financial Ratios as a tool for Interpreting and Assessing Business
Performance
The ratio analysis can be regarded as the most important method that is used for
evaluation of the financial performance of a company for facilitating investment making
decisions. The method is largely used as it is relatively simple to apply and helps in achieving
valid financial results to assess the potential of the future growth of a company. The financial
strength of companies can be assessed by the use of financial information provided in the income
statement, balance sheets and cash flow statement. The financial ratios prove to be useful in
analyzing operational efficiency, liquidity, leverage, market performance and profitability of a
firm. The data assessed form the financial statement of a company can be used for comparing its
performance over time and to assess whether it is progressing or deteriorating. Thus, it helps in
evaluating the long-term financial condition of a company and thus assessing its competitive
position (Arnold, 2013).
The method also proves to be highly useful for comparing the performance of different
companies operating within an industry sector and as such facilitating the best company having
higher growth prospects for investment purpose. The comparison of the financial performance of
a company to its peers or with the industry averages can be regarded as another important benefit
realized by the use of ratio analysis. The method helps in developing benchmarks for evaluation
of the financial performance of a company against all the industry players. It helps investors and
analysts to evaluate the strengths and weakness of individual companies or industries and
thereby largely supporting their investment decisions.
The meaningfulness of the information obtained by the use of ratio analysis technique
can be further supported with the use of trend horizontal analysis. Horizontal analysis can be
regarded as the financial statement analysis technique that depicts the changes in the financial
statement items over a period of time. This is usually done by the use of a base period and
comparing the items on the financial statement with that of the base period. The changes
reflected helps in depicting the growth incurred by a company over a period of time. The
analysis may be carried for each type of financial statement developed by a company, that is,
balance sheet, current assets, income and cash flow statement (Schlichting, 2013).
Part 2: Definition of the term ‘Agency’ and its used in Achieving the Objectives of Redding
Co. and Neaves Co
The term ‘agency’ is being used in the listed companies to depict the relation between
the principal, that are the shareholders who owns the company and the agent, that are the
business managers who act on the behalf of the shareholders for maximizing their interest and
value. The principal-agent problem has been described by the agency theory for defining the
relation between shareholders and the business managers and ensuring the development of
harmonious relation between them. The theory has also addressed the disputes that can occur
between the principal and agent due to incompatibility between their financial goals. The conflict
of interest can occur between the shareholders and the agents as they may pursue different
growth objectives and strategies. The business managers may sometimes emphasize on achieving
their growth objectives of a firm rather than maximizing the interest of the shareholders
(Bergstein, 2014).
⊘ This is a preview!⊘
Do you want full access?
Subscribe today to unlock all pages.
Trusted by 1+ million students worldwide
10
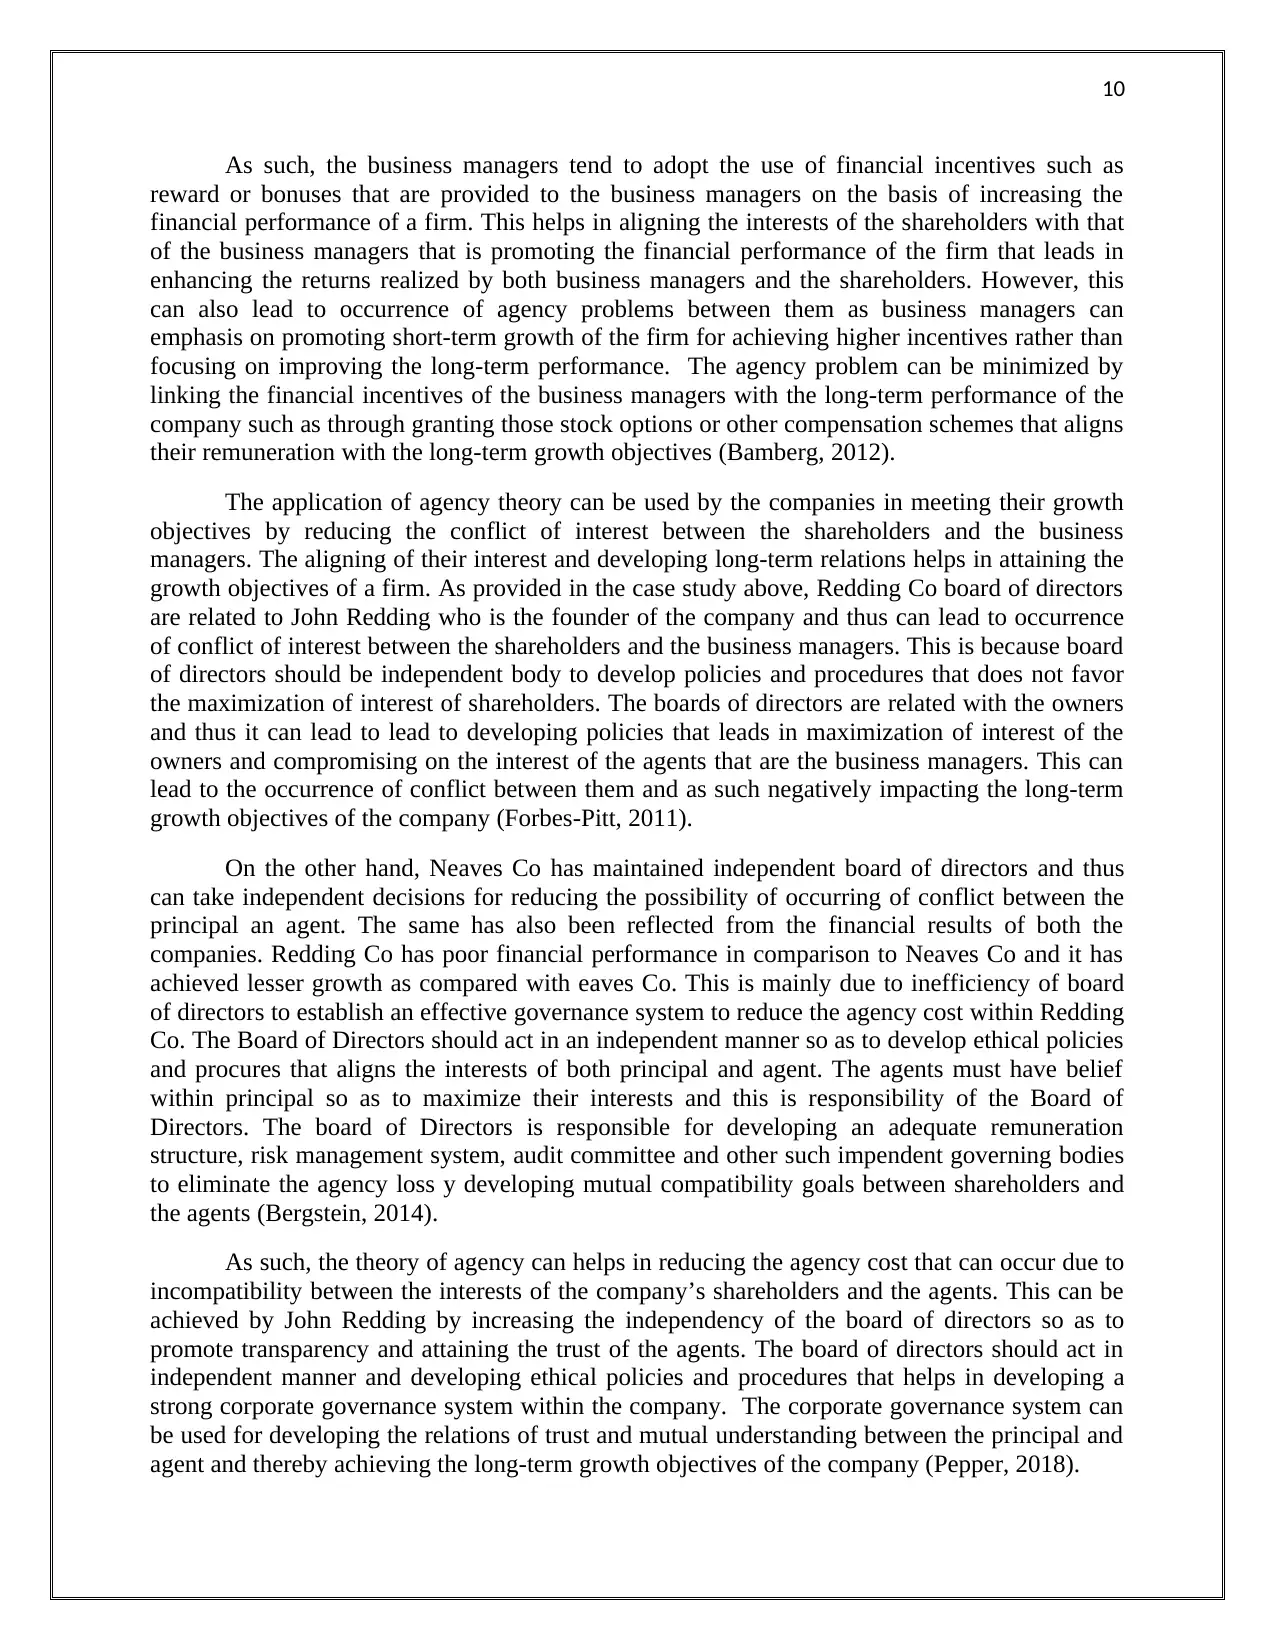
As such, the business managers tend to adopt the use of financial incentives such as
reward or bonuses that are provided to the business managers on the basis of increasing the
financial performance of a firm. This helps in aligning the interests of the shareholders with that
of the business managers that is promoting the financial performance of the firm that leads in
enhancing the returns realized by both business managers and the shareholders. However, this
can also lead to occurrence of agency problems between them as business managers can
emphasis on promoting short-term growth of the firm for achieving higher incentives rather than
focusing on improving the long-term performance. The agency problem can be minimized by
linking the financial incentives of the business managers with the long-term performance of the
company such as through granting those stock options or other compensation schemes that aligns
their remuneration with the long-term growth objectives (Bamberg, 2012).
The application of agency theory can be used by the companies in meeting their growth
objectives by reducing the conflict of interest between the shareholders and the business
managers. The aligning of their interest and developing long-term relations helps in attaining the
growth objectives of a firm. As provided in the case study above, Redding Co board of directors
are related to John Redding who is the founder of the company and thus can lead to occurrence
of conflict of interest between the shareholders and the business managers. This is because board
of directors should be independent body to develop policies and procedures that does not favor
the maximization of interest of shareholders. The boards of directors are related with the owners
and thus it can lead to lead to developing policies that leads in maximization of interest of the
owners and compromising on the interest of the agents that are the business managers. This can
lead to the occurrence of conflict between them and as such negatively impacting the long-term
growth objectives of the company (Forbes-Pitt, 2011).
On the other hand, Neaves Co has maintained independent board of directors and thus
can take independent decisions for reducing the possibility of occurring of conflict between the
principal an agent. The same has also been reflected from the financial results of both the
companies. Redding Co has poor financial performance in comparison to Neaves Co and it has
achieved lesser growth as compared with eaves Co. This is mainly due to inefficiency of board
of directors to establish an effective governance system to reduce the agency cost within Redding
Co. The Board of Directors should act in an independent manner so as to develop ethical policies
and procures that aligns the interests of both principal and agent. The agents must have belief
within principal so as to maximize their interests and this is responsibility of the Board of
Directors. The board of Directors is responsible for developing an adequate remuneration
structure, risk management system, audit committee and other such impendent governing bodies
to eliminate the agency loss y developing mutual compatibility goals between shareholders and
the agents (Bergstein, 2014).
As such, the theory of agency can helps in reducing the agency cost that can occur due to
incompatibility between the interests of the company’s shareholders and the agents. This can be
achieved by John Redding by increasing the independency of the board of directors so as to
promote transparency and attaining the trust of the agents. The board of directors should act in
independent manner and developing ethical policies and procedures that helps in developing a
strong corporate governance system within the company. The corporate governance system can
be used for developing the relations of trust and mutual understanding between the principal and
agent and thereby achieving the long-term growth objectives of the company (Pepper, 2018).
Paraphrase This Document
Need a fresh take? Get an instant paraphrase of this document with our AI Paraphraser
11
Also, it is highly essential for both the companies that are Redding Co. and Neaves Co.
that they should develop proper remuneration structure for aligning the interests of the agent and
principal. The remuneration structure should be developed in a manner so that it aligns the long-
term interests of the shareholders with that of the agents. The agents can be motivated to enhance
the long-term financial performance of the company by aligning their monetary benefits with
that of achieving the growth objectives of the company. The financial incentives such as rewards
and bonuses offered to the business managers must be linked with achieving the determined
long-term growth and objectives. However, in this context it is essential that financial incentives
that promote unethical behavior within the company and negatively impact the long-term
performance must be removed. The agency theory can help both the companies to develop better
corporate policy that promotes to achievement of optimum results for both the principal and
agents. Thus, it can be said strengthening of corporate governance system and developing
adequate remuneration structure that reduces the agency loss and ensure that agents acts in the
best interest of the principal and thus maximizing the growth and development of a company.
The agency theory helps in developing similar inters of principal and agents for both the
companies helping them to meet their goals and objectives (Tosi, 2009).
Part 3: Impact of raising funds for the refurbishment of equipments through using
additional loans or equity on Redding Company
Raising fund through using the additional loans or equity will significantly increase the
proportion of debt capital or equity and leverage position of the company will be change.
Increasing the debt capital will certainly increase the interest payable during the year and lower
the profit available for the equity shareholders. While considering the option of debt capital or
equity as the sources of finance it is required to assess the benefits that will generate to company.
In case of Redding Company, the plan is to refurbishment of equipments and premises which are
old and requires major repair work. There are both financial as well as non-financial factors that
are impacted when Redding Company plan to raise the debt capital through use of bank loan.
It is certain the raising the capital will critically impact the leverage position of the
company and profit available to the equity shareholders will also be impacted. Some of
important financial ratios that will be changed after the amount have been raised through use of
bank loan or equity share (Phillips and Stawarski, 2016).
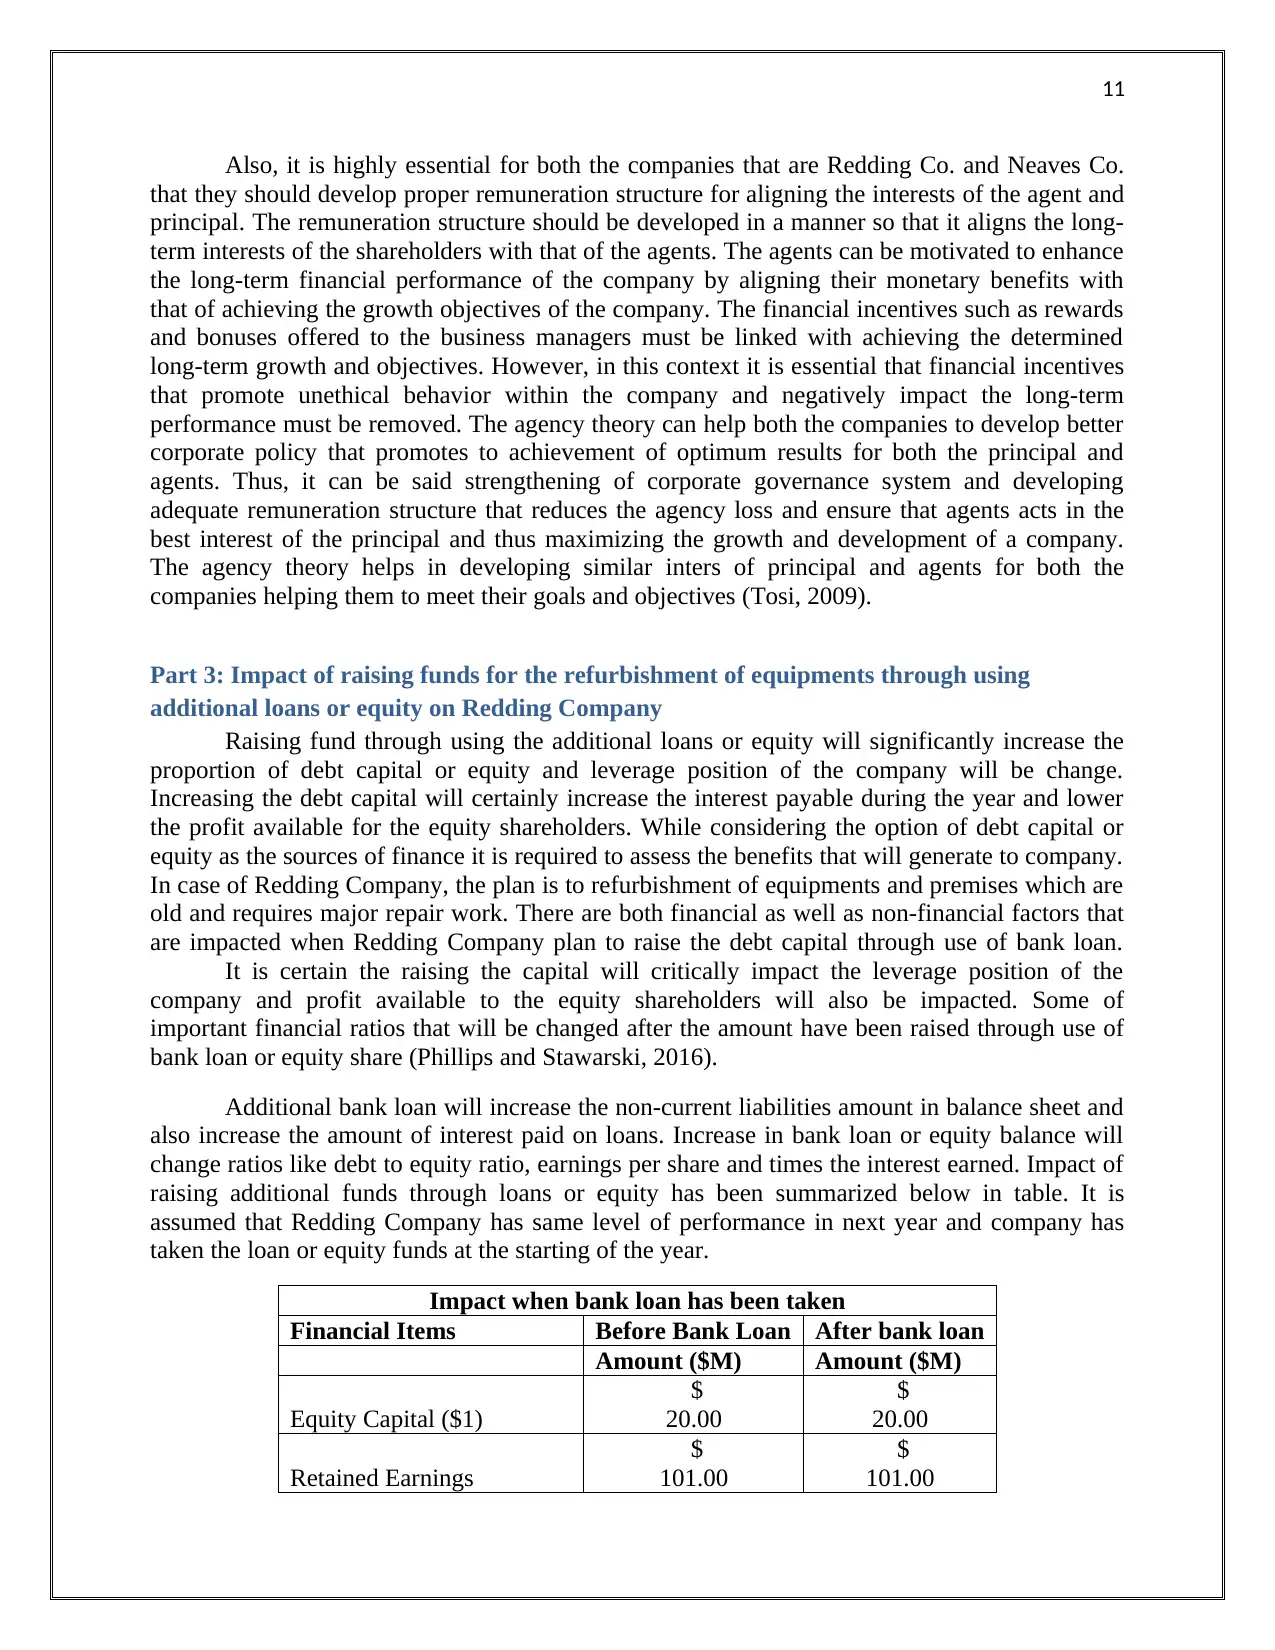
Additional bank loan will increase the non-current liabilities amount in balance sheet and
also increase the amount of interest paid on loans. Increase in bank loan or equity balance will
change ratios like debt to equity ratio, earnings per share and times the interest earned. Impact of
raising additional funds through loans or equity has been summarized below in table. It is
assumed that Redding Company has same level of performance in next year and company has
taken the loan or equity funds at the starting of the year.
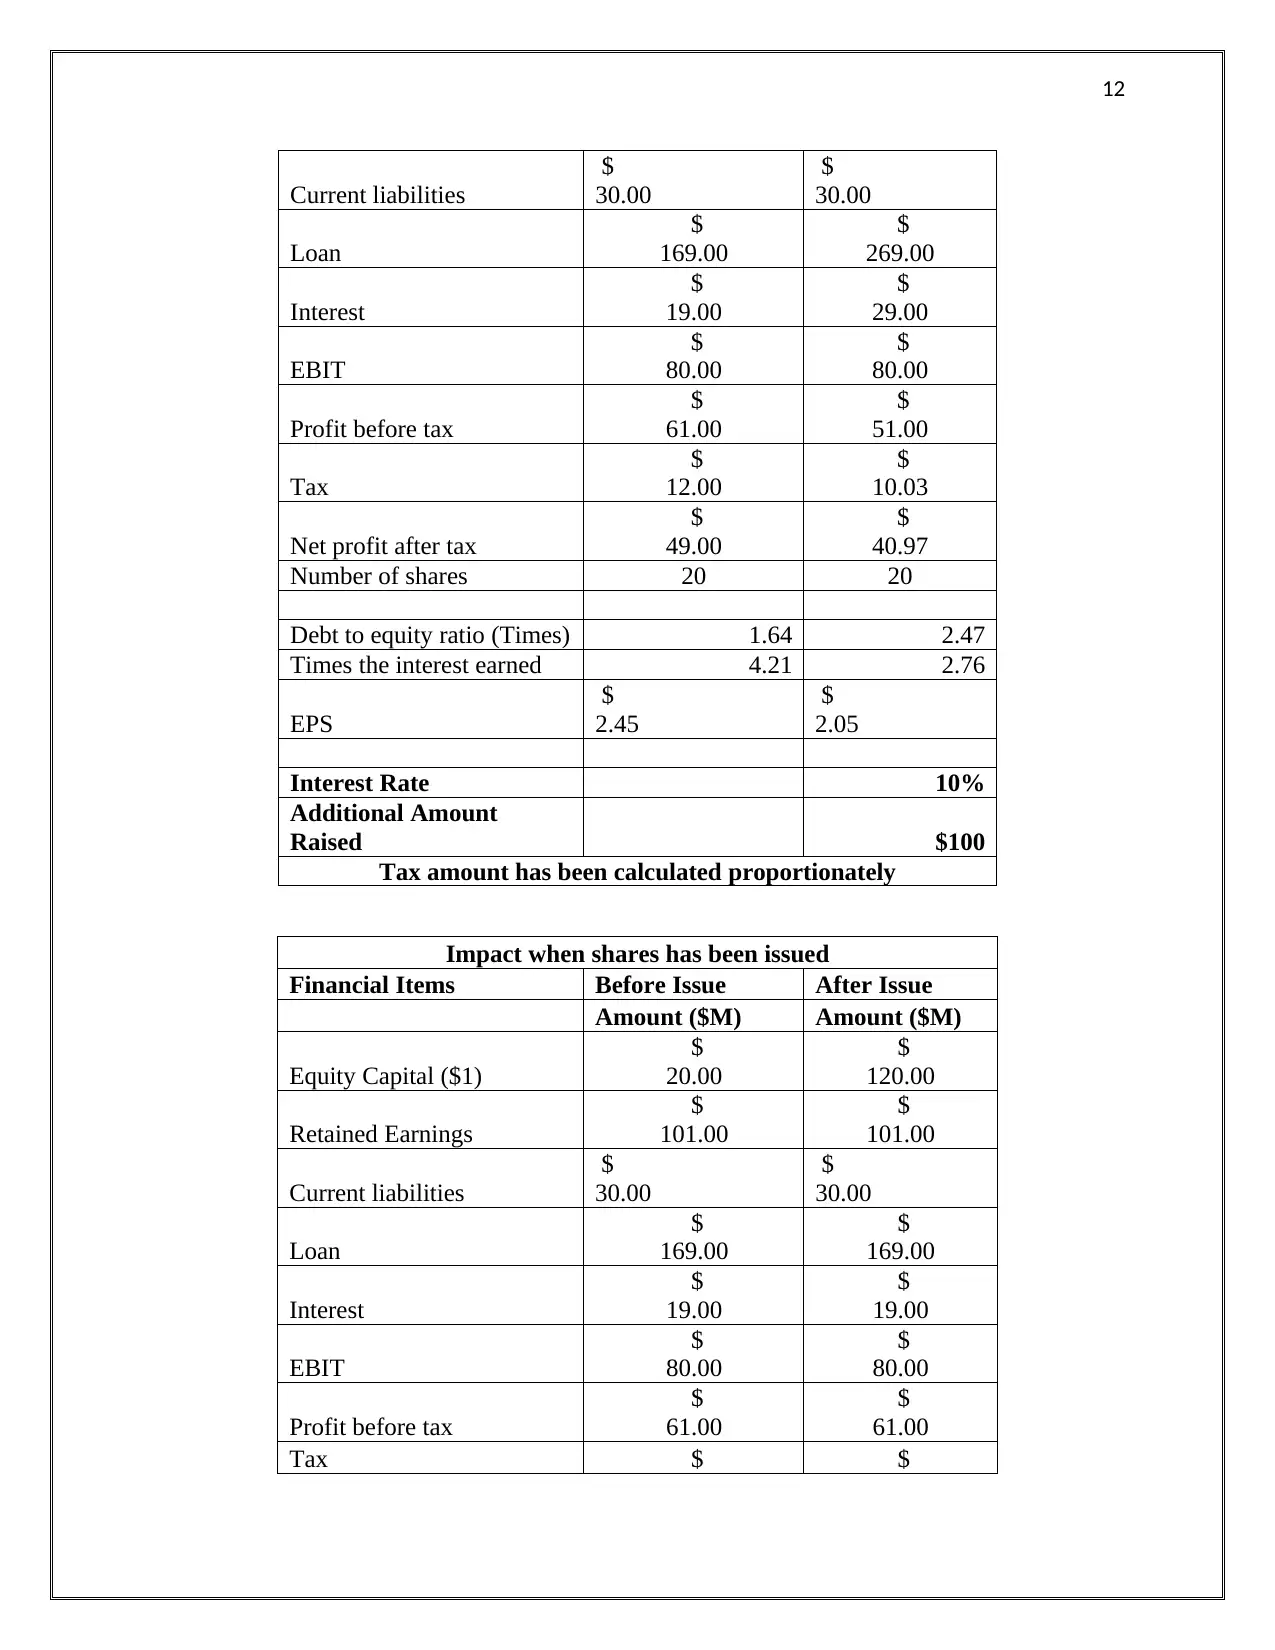
Impact when bank loan has been taken
Financial Items Before Bank Loan After bank loan
Amount ($M) Amount ($M)
Equity Capital ($1)
$
20.00
$
20.00
Retained Earnings
$
101.00
$
101.00
Also, it is highly essential for both the companies that are Redding Co. and Neaves Co.
that they should develop proper remuneration structure for aligning the interests of the agent and
principal. The remuneration structure should be developed in a manner so that it aligns the long-
term interests of the shareholders with that of the agents. The agents can be motivated to enhance
the long-term financial performance of the company by aligning their monetary benefits with
that of achieving the growth objectives of the company. The financial incentives such as rewards
and bonuses offered to the business managers must be linked with achieving the determined
long-term growth and objectives. However, in this context it is essential that financial incentives
that promote unethical behavior within the company and negatively impact the long-term
performance must be removed. The agency theory can help both the companies to develop better
corporate policy that promotes to achievement of optimum results for both the principal and
agents. Thus, it can be said strengthening of corporate governance system and developing
adequate remuneration structure that reduces the agency loss and ensure that agents acts in the
best interest of the principal and thus maximizing the growth and development of a company.
The agency theory helps in developing similar inters of principal and agents for both the
companies helping them to meet their goals and objectives (Tosi, 2009).
Part 3: Impact of raising funds for the refurbishment of equipments through using
additional loans or equity on Redding Company
Raising fund through using the additional loans or equity will significantly increase the
proportion of debt capital or equity and leverage position of the company will be change.
Increasing the debt capital will certainly increase the interest payable during the year and lower
the profit available for the equity shareholders. While considering the option of debt capital or
equity as the sources of finance it is required to assess the benefits that will generate to company.
In case of Redding Company, the plan is to refurbishment of equipments and premises which are
old and requires major repair work. There are both financial as well as non-financial factors that
are impacted when Redding Company plan to raise the debt capital through use of bank loan.
It is certain the raising the capital will critically impact the leverage position of the
company and profit available to the equity shareholders will also be impacted. Some of
important financial ratios that will be changed after the amount have been raised through use of
bank loan or equity share (Phillips and Stawarski, 2016).
Additional bank loan will increase the non-current liabilities amount in balance sheet and
also increase the amount of interest paid on loans. Increase in bank loan or equity balance will
change ratios like debt to equity ratio, earnings per share and times the interest earned. Impact of
raising additional funds through loans or equity has been summarized below in table. It is
assumed that Redding Company has same level of performance in next year and company has
taken the loan or equity funds at the starting of the year.
Impact when bank loan has been taken
Financial Items Before Bank Loan After bank loan
Amount ($M) Amount ($M)
Equity Capital ($1)
$
20.00
$
20.00
Retained Earnings
$
101.00
$
101.00
12
Current liabilities
$
30.00
$
30.00
Loan
$
169.00
$
269.00
Interest
$
19.00
$
29.00
EBIT
$
80.00
$
80.00
Profit before tax
$
61.00
$
51.00
Tax
$
12.00
$
10.03
Net profit after tax
$
49.00
$
40.97
Number of shares 20 20
Debt to equity ratio (Times) 1.64 2.47
Times the interest earned 4.21 2.76
EPS
$
2.45
$
2.05
Interest Rate 10%
Additional Amount
Raised $100
Tax amount has been calculated proportionately
Impact when shares has been issued
Financial Items Before Issue After Issue
Amount ($M) Amount ($M)
Equity Capital ($1)
$
20.00
$
120.00
Retained Earnings
$
101.00
$
101.00
Current liabilities
$
30.00
$
30.00
Loan
$
169.00
$
169.00
Interest
$
19.00
$
19.00
EBIT
$
80.00
$
80.00
Profit before tax
$
61.00
$
61.00
Tax $ $
Current liabilities
$
30.00
$
30.00
Loan
$
169.00
$
269.00
Interest
$
19.00
$
29.00
EBIT
$
80.00
$
80.00
Profit before tax
$
61.00
$
51.00
Tax
$
12.00
$
10.03
Net profit after tax
$
49.00
$
40.97
Number of shares 20 20
Debt to equity ratio (Times) 1.64 2.47
Times the interest earned 4.21 2.76
EPS
$
2.45
$
2.05
Interest Rate 10%
Additional Amount
Raised $100
Tax amount has been calculated proportionately
Impact when shares has been issued
Financial Items Before Issue After Issue
Amount ($M) Amount ($M)
Equity Capital ($1)
$
20.00
$
120.00
Retained Earnings
$
101.00
$
101.00
Current liabilities
$
30.00
$
30.00
Loan
$
169.00
$
169.00
Interest
$
19.00
$
19.00
EBIT
$
80.00
$
80.00
Profit before tax
$
61.00
$
61.00
Tax $ $
⊘ This is a preview!⊘
Do you want full access?
Subscribe today to unlock all pages.
Trusted by 1+ million students worldwide
1 out of 18
Related Documents


Your All-in-One AI-Powered Toolkit for Academic Success.
+13062052269
info@desklib.com
Available 24*7 on WhatsApp / Email
![[object Object]](/_next/static/media/star-bottom.7253800d.svg)
Unlock your academic potential
Copyright © 2020–2026 A2Z Services. All Rights Reserved. Developed and managed by ZUCOL.