Economic Growth and International Trade: Brazil and South Africa
VerifiedAdded on 2022/11/18
|16
|3740
|264
Report
AI Summary
This report investigates the influence of international trade on the economic growth of Brazil and South Africa, both developing countries within the BRICS economies. The methodology involves analyzing data from the World Bank's GDP database, incorporating variables such as GDP, employment rates, investments, imports, exports, and expenses from 1960 to 2018 (with adjusted timeframes for each country due to data availability). The study employs various statistical tools including line graphs, scatter plots, descriptive statistics, correlation, and regression analysis to examine the relationships between the variables. The findings reveal positive correlations between GDP and variables like imports, exports, and employment. Regression analysis, specifically multiple linear regression, is used to model the relationship between GDP and its components, indicating a significant impact of imports and expenses on GDP variation, with exports showing less significance. The report concludes with an ANOVA and model summary, highlighting the model's adequacy and the explanatory power of the independent variables in accounting for the variance in GDP.

1
International trade: Brazil and South Africa
By:
Course Title:
Tutor:
Date:
International trade: Brazil and South Africa
By:
Course Title:
Tutor:
Date:
Paraphrase This Document
Need a fresh take? Get an instant paraphrase of this document with our AI Paraphraser
2
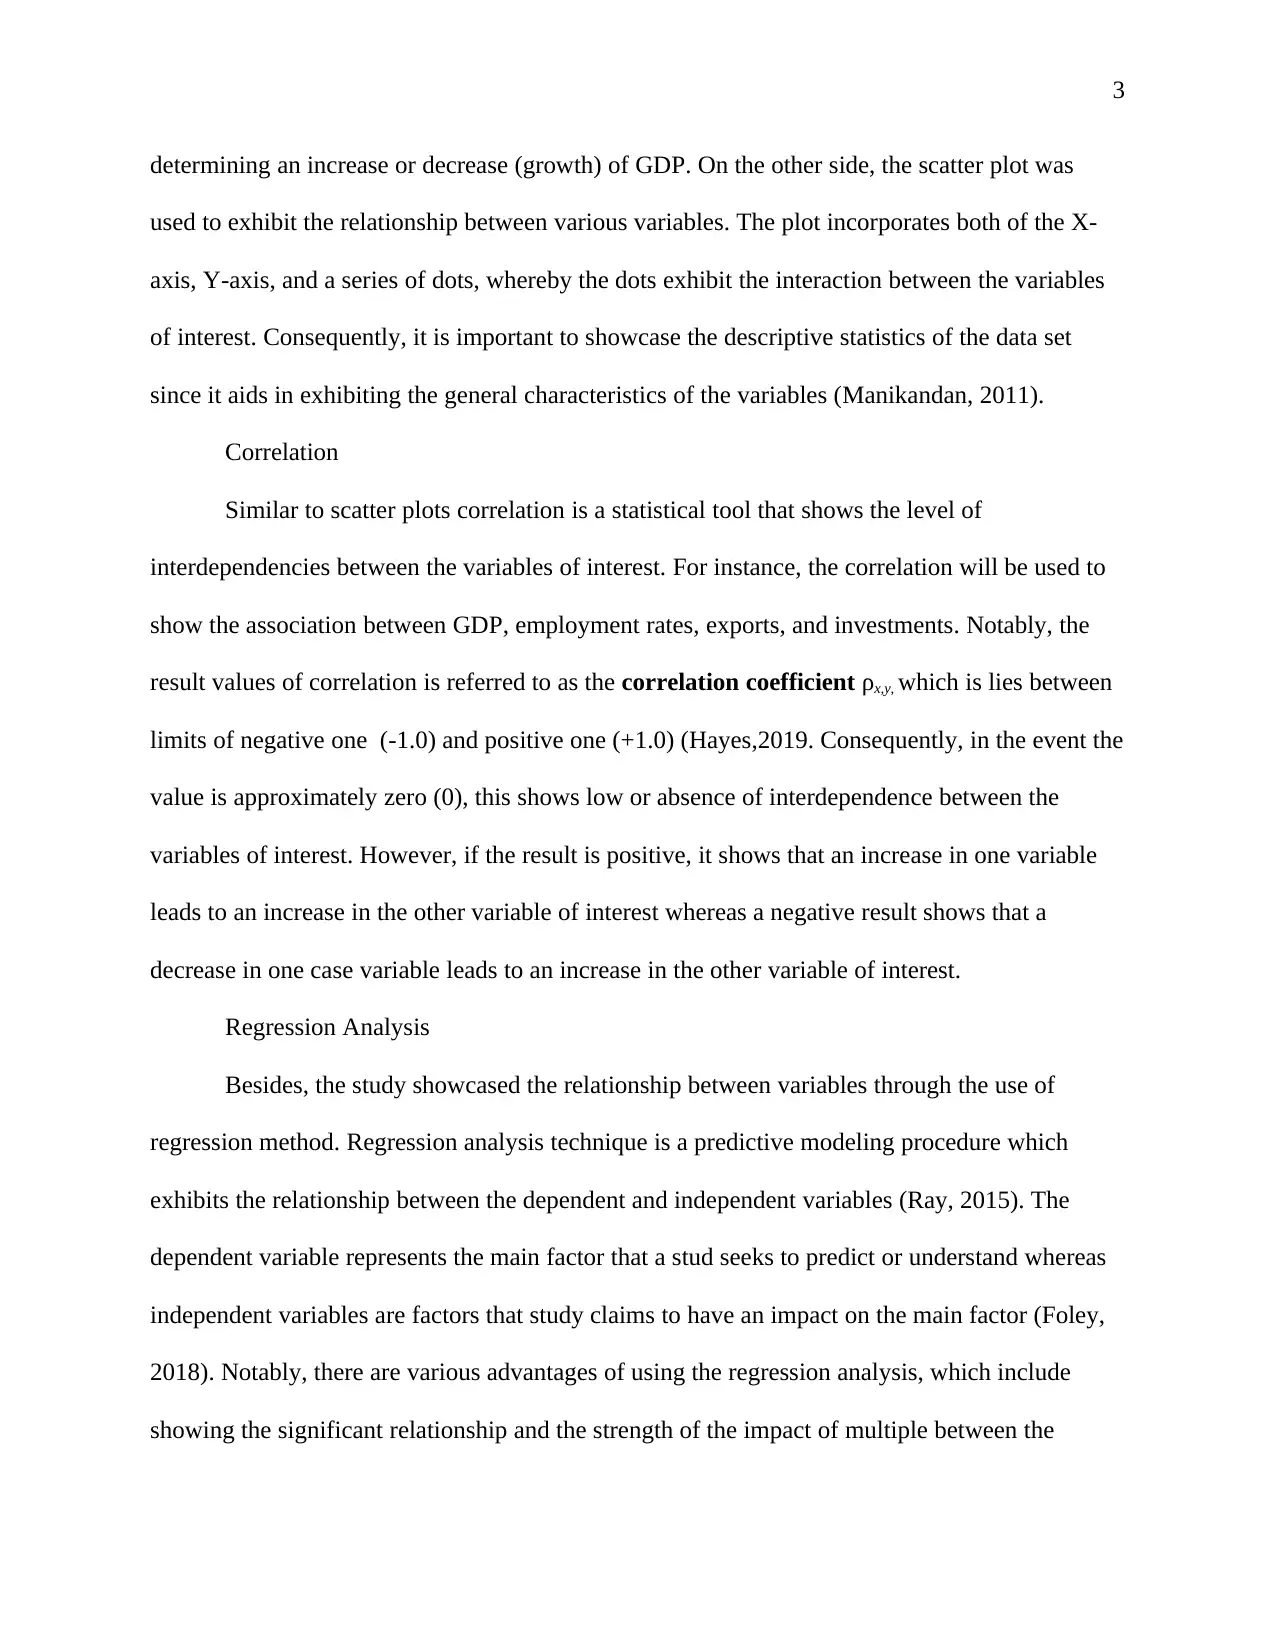
Chapter Three: Methodology
As evident, the study seeks to exhibit the impact of international trade to the country’s
economic growth. Notably, one of the measures applicable, in evaluating the economic growth of
a country is the Gross Domestic Product (GDP). Therefore, the study will use GDP and its
components to examine the economic growth. There are four components of the GDP, which
include investments (I), government expenditure (G), consumption (C), and net exports (NX)
thus GDP (Y) = I + C + G + NX. Notably, among the BRICS, both Brazil and South Africa are
categorized as developing countries hence the study will incorporate these countries to examine
if international trade has an impact on their respective economic growth.
The data used in the study was sourced from the world bank GDP database, which is
freely available to users. The GDP metadata has approximately 1600 variables, which include
GDP, year, imports, exports, land area, population, expenditure, manufacturing, and agricultures,
among others (World Bank, 2018). However, the study incorporated seven variables, which
include year, GDP, employment rates, investments, imports, exports, and expenses. Moreover,
the data has values from 1960 to 2018; however, some variables such as investment and
expenses have missing values. As a result, Brazil data used values from 1990 to 2018 whereas
South Africa used Data from 1972 to 2018. Moreover, the study omitted investments from the
South African data set due to numerous missing values. Notably, the study used the Statistical
Package for Social Sciences (SPSS) to perform data analysis.
Visualization
It is essential for a research to have a clear picture about the data set before any analysis.
As a result, the study incorporated two visualization tools, which include the line and scatter
graphs. The line graph was used to exhibit the trend of GDP over the years thus aid in
3
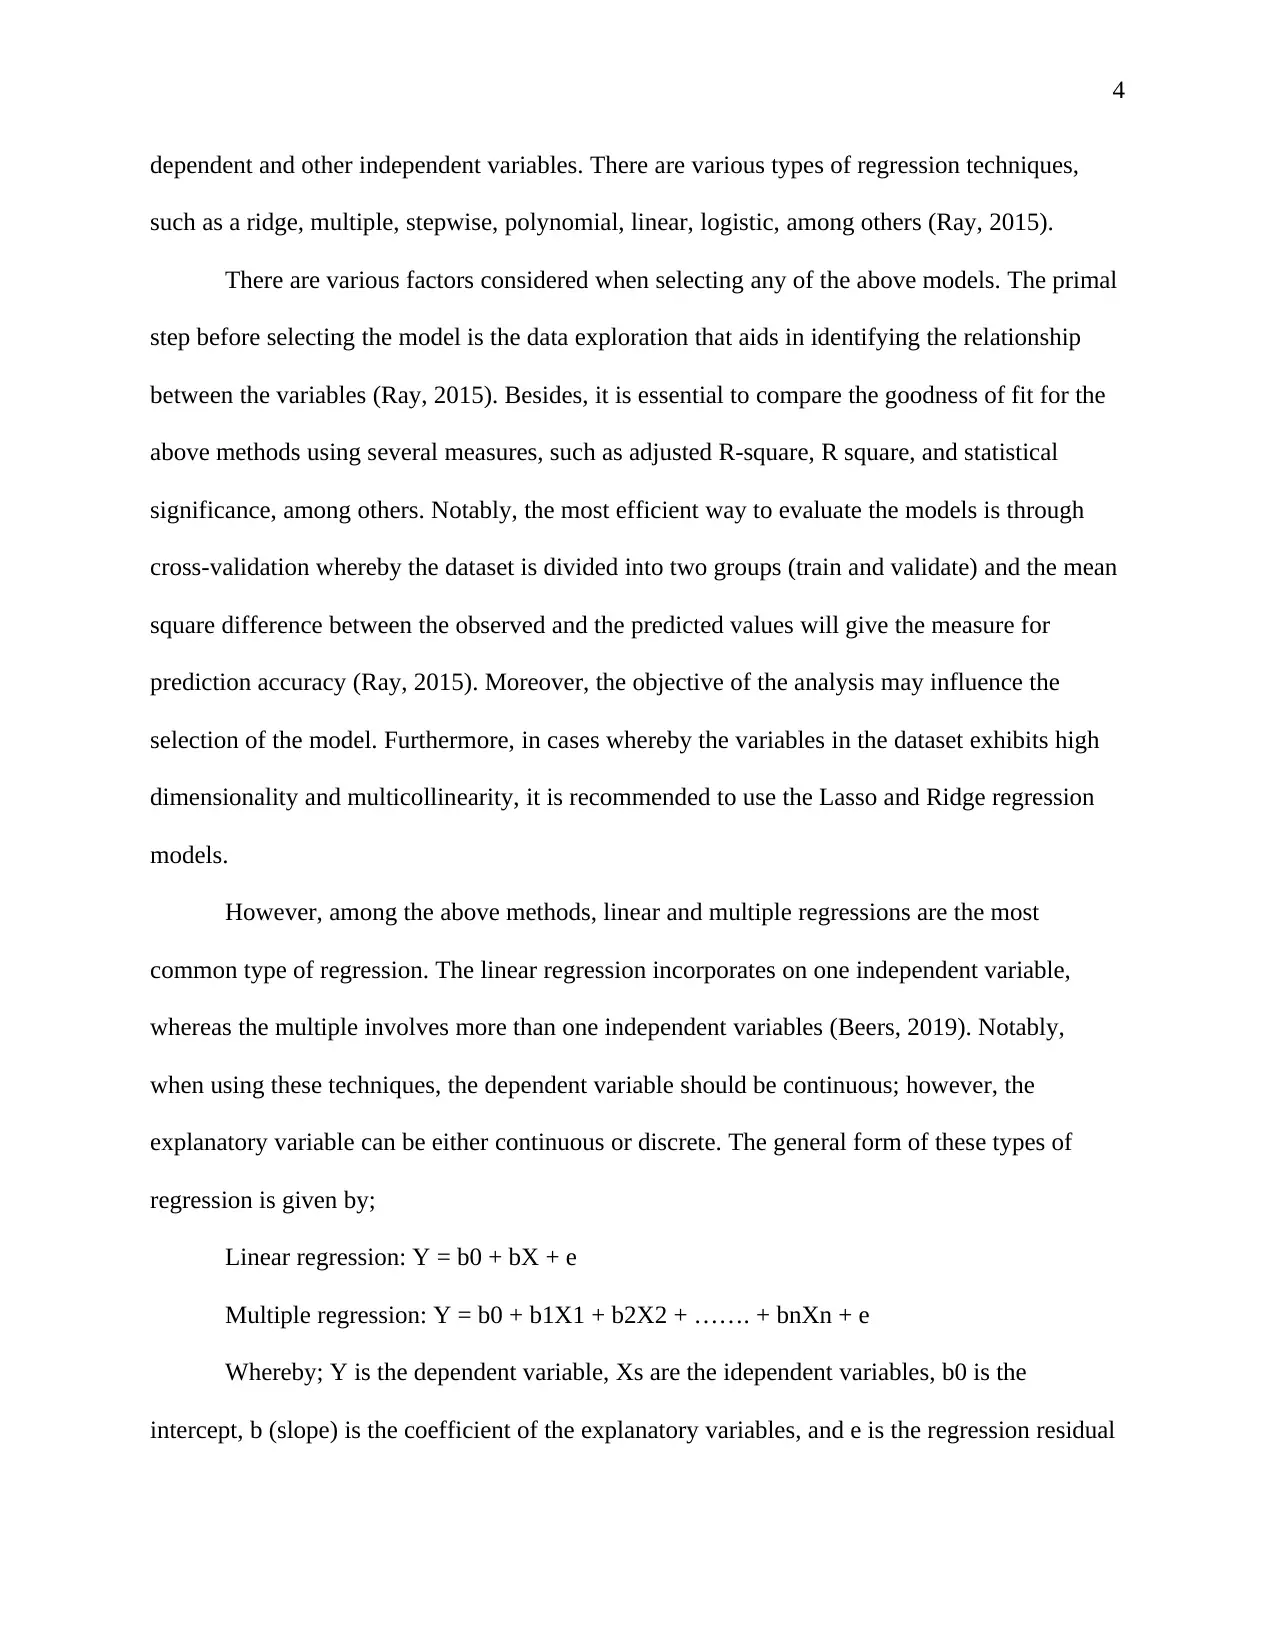
determining an increase or decrease (growth) of GDP. On the other side, the scatter plot was
used to exhibit the relationship between various variables. The plot incorporates both of the X-
axis, Y-axis, and a series of dots, whereby the dots exhibit the interaction between the variables
of interest. Consequently, it is important to showcase the descriptive statistics of the data set
since it aids in exhibiting the general characteristics of the variables (Manikandan, 2011).
Correlation
Similar to scatter plots correlation is a statistical tool that shows the level of
interdependencies between the variables of interest. For instance, the correlation will be used to
show the association between GDP, employment rates, exports, and investments. Notably, the
result values of correlation is referred to as the correlation coefficient ρx,y, which is lies between
limits of negative one (-1.0) and positive one (+1.0) (Hayes,2019. Consequently, in the event the
value is approximately zero (0), this shows low or absence of interdependence between the
variables of interest. However, if the result is positive, it shows that an increase in one variable
leads to an increase in the other variable of interest whereas a negative result shows that a
decrease in one case variable leads to an increase in the other variable of interest.
Regression Analysis
Besides, the study showcased the relationship between variables through the use of
regression method. Regression analysis technique is a predictive modeling procedure which
exhibits the relationship between the dependent and independent variables (Ray, 2015). The
dependent variable represents the main factor that a stud seeks to predict or understand whereas
independent variables are factors that study claims to have an impact on the main factor (Foley,
2018). Notably, there are various advantages of using the regression analysis, which include
showing the significant relationship and the strength of the impact of multiple between the
⊘ This is a preview!⊘
Do you want full access?
Subscribe today to unlock all pages.
Trusted by 1+ million students worldwide
4
dependent and other independent variables. There are various types of regression techniques,
such as a ridge, multiple, stepwise, polynomial, linear, logistic, among others (Ray, 2015).
There are various factors considered when selecting any of the above models. The primal
step before selecting the model is the data exploration that aids in identifying the relationship
between the variables (Ray, 2015). Besides, it is essential to compare the goodness of fit for the
above methods using several measures, such as adjusted R-square, R square, and statistical
significance, among others. Notably, the most efficient way to evaluate the models is through
cross-validation whereby the dataset is divided into two groups (train and validate) and the mean
square difference between the observed and the predicted values will give the measure for
prediction accuracy (Ray, 2015). Moreover, the objective of the analysis may influence the
selection of the model. Furthermore, in cases whereby the variables in the dataset exhibits high
dimensionality and multicollinearity, it is recommended to use the Lasso and Ridge regression
models.
However, among the above methods, linear and multiple regressions are the most
common type of regression. The linear regression incorporates on one independent variable,
whereas the multiple involves more than one independent variables (Beers, 2019). Notably,
when using these techniques, the dependent variable should be continuous; however, the
explanatory variable can be either continuous or discrete. The general form of these types of
regression is given by;
Linear regression: Y = b0 + bX + e
Multiple regression: Y = b0 + b1X1 + b2X2 + ……. + bnXn + e
Whereby; Y is the dependent variable, Xs are the idependent variables, b0 is the
intercept, b (slope) is the coefficient of the explanatory variables, and e is the regression residual
Paraphrase This Document
Need a fresh take? Get an instant paraphrase of this document with our AI Paraphraser
5
or error value of the model. As evident, the study seeks to show the relationship between the
GDP (dependent) and the components of GDP, which include investments (I), government
expenditure (G), consumption (C), and net exports (NX) (independent variables). Hence, the
most applicable method for the is multiple linear regression.
Consequently, a standard regression method tends to have various assumptions, such as
the error terms (e) should have a normal distribution with a mean of 0 (Prabhakaran, 2017).
Moreover, the dependent variable should show linearity, whereby the mean of main factor is a
linear combination of the parameters (coefficients) and the explanatory variables. Besides, the
error terms should be homoscedastic whereby the variance of the regression residuals opt to be
constant and independent of the variables in the model. Besides, the value of the error term for a
given case is independent of the values of the variables in the model and the values of the
regression residuals from other cases. Furthermore, the predictor variables should not exhibit
multicollinearity whereby in a given least-square estimation (LSE) method the design matrix X
must have full column rank p (be invertible) otherwise the dependent variable will exhibit
multicollinearity.
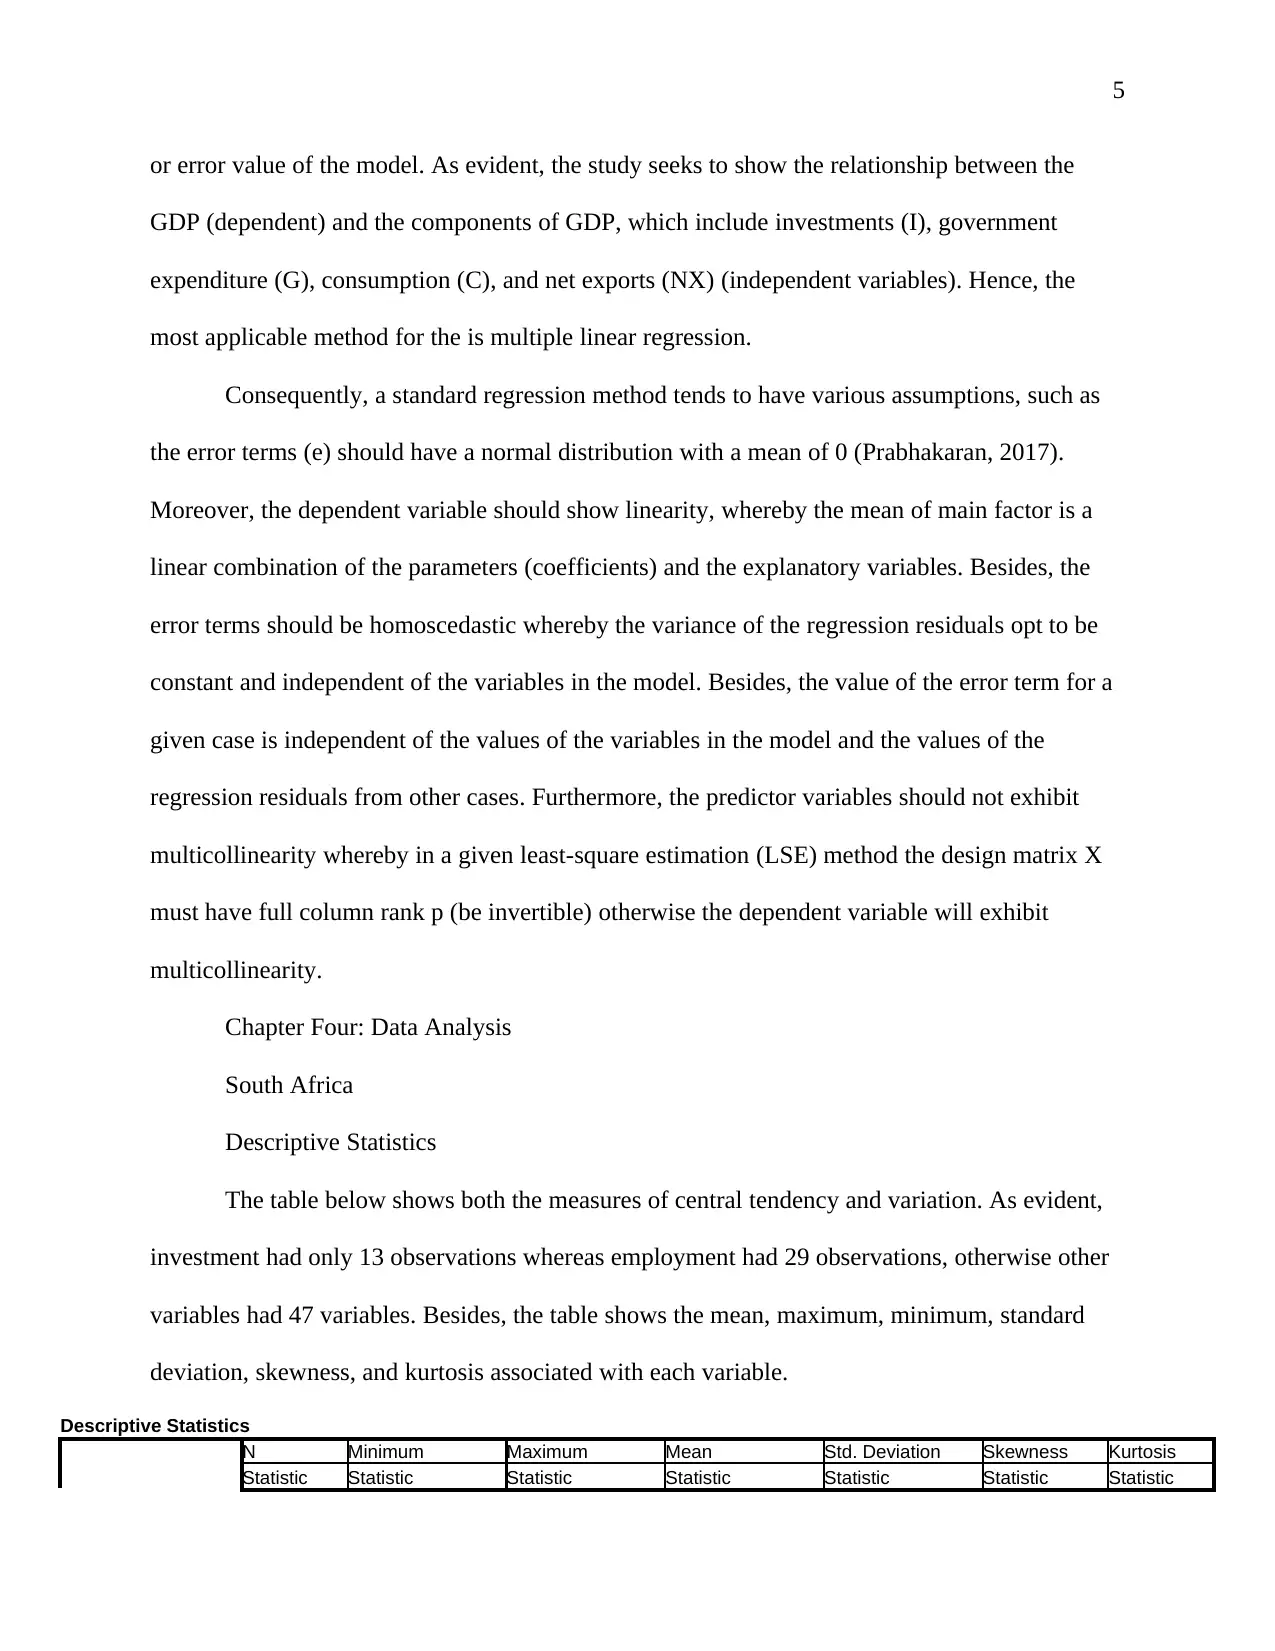
Chapter Four: Data Analysis
South Africa
Descriptive Statistics
The table below shows both the measures of central tendency and variation. As evident,
investment had only 13 observations whereas employment had 29 observations, otherwise other
variables had 47 variables. Besides, the table shows the mean, maximum, minimum, standard
deviation, skewness, and kurtosis associated with each variable.
Descriptive Statistics
N Minimum Maximum Mean Std. Deviation Skewness Kurtosis
Statistic Statistic Statistic Statistic Statistic Statistic Statistic
or error value of the model. As evident, the study seeks to show the relationship between the
GDP (dependent) and the components of GDP, which include investments (I), government
expenditure (G), consumption (C), and net exports (NX) (independent variables). Hence, the
most applicable method for the is multiple linear regression.
Consequently, a standard regression method tends to have various assumptions, such as
the error terms (e) should have a normal distribution with a mean of 0 (Prabhakaran, 2017).
Moreover, the dependent variable should show linearity, whereby the mean of main factor is a
linear combination of the parameters (coefficients) and the explanatory variables. Besides, the
error terms should be homoscedastic whereby the variance of the regression residuals opt to be
constant and independent of the variables in the model. Besides, the value of the error term for a
given case is independent of the values of the variables in the model and the values of the
regression residuals from other cases. Furthermore, the predictor variables should not exhibit
multicollinearity whereby in a given least-square estimation (LSE) method the design matrix X
must have full column rank p (be invertible) otherwise the dependent variable will exhibit
multicollinearity.
Chapter Four: Data Analysis
South Africa
Descriptive Statistics
The table below shows both the measures of central tendency and variation. As evident,
investment had only 13 observations whereas employment had 29 observations, otherwise other
variables had 47 variables. Besides, the table shows the mean, maximum, minimum, standard
deviation, skewness, and kurtosis associated with each variable.
Descriptive Statistics
N Minimum Maximum Mean Std. Deviation Skewness Kurtosis
Statistic Statistic Statistic Statistic Statistic Statistic Statistic
6
GDP 47 1069481509054 3144539000000 1957736704367.6 644972238724.34 .585 -1.035
Imports 47 3640000000 1440883000000 356479962176.60 452963351596.93 1.214 .064
Exports 47 296864000000 929792000000 553872770361.70 224424243280.96 .363 -1.474
Investment 13 3000000 5648610000 1535037692.31 2100244375.262 .999 -.740
Expense 47 2914000000 1663775075392 392667872929.55 498632105536.71 1.355 .610
Employment 29 12034766 22756502 17504388.90 3015477.215 -.128 -.812
Valid N (listwise) 13
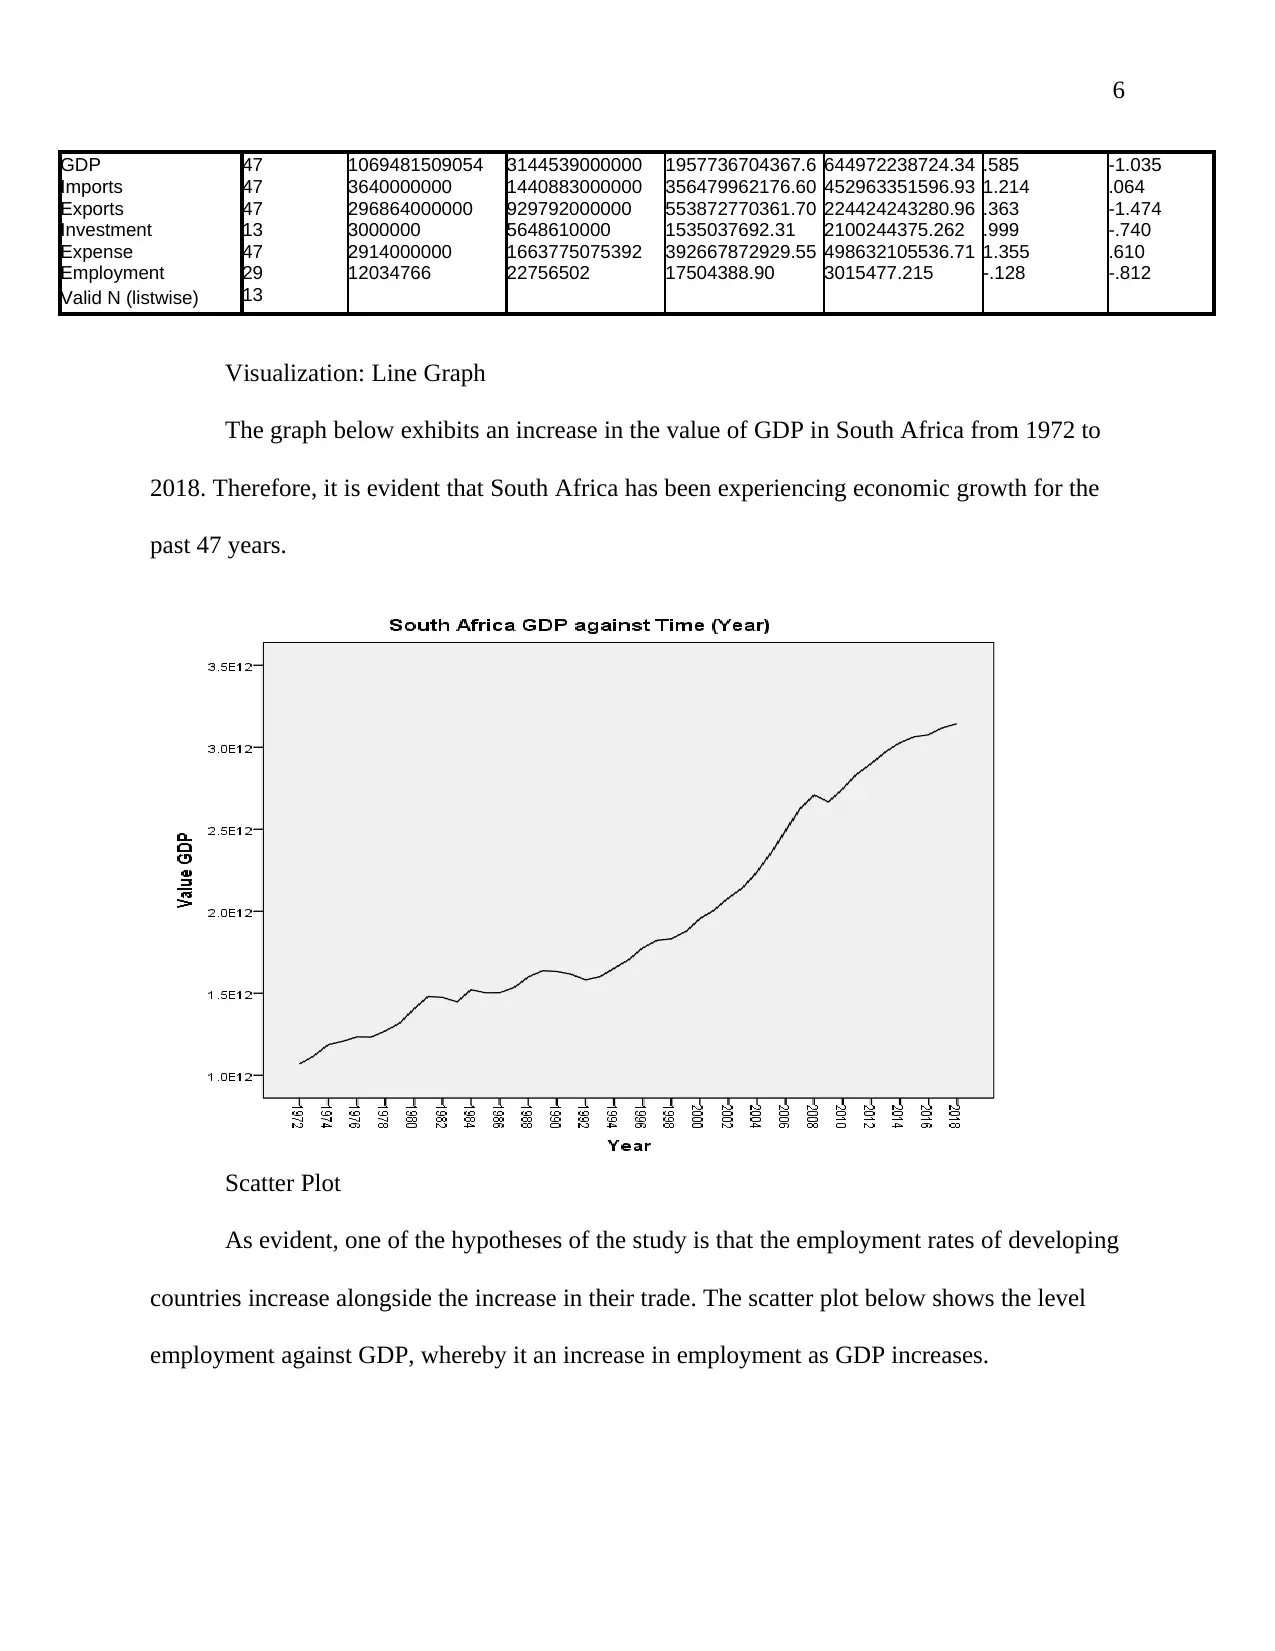
Visualization: Line Graph
The graph below exhibits an increase in the value of GDP in South Africa from 1972 to
2018. Therefore, it is evident that South Africa has been experiencing economic growth for the
past 47 years.
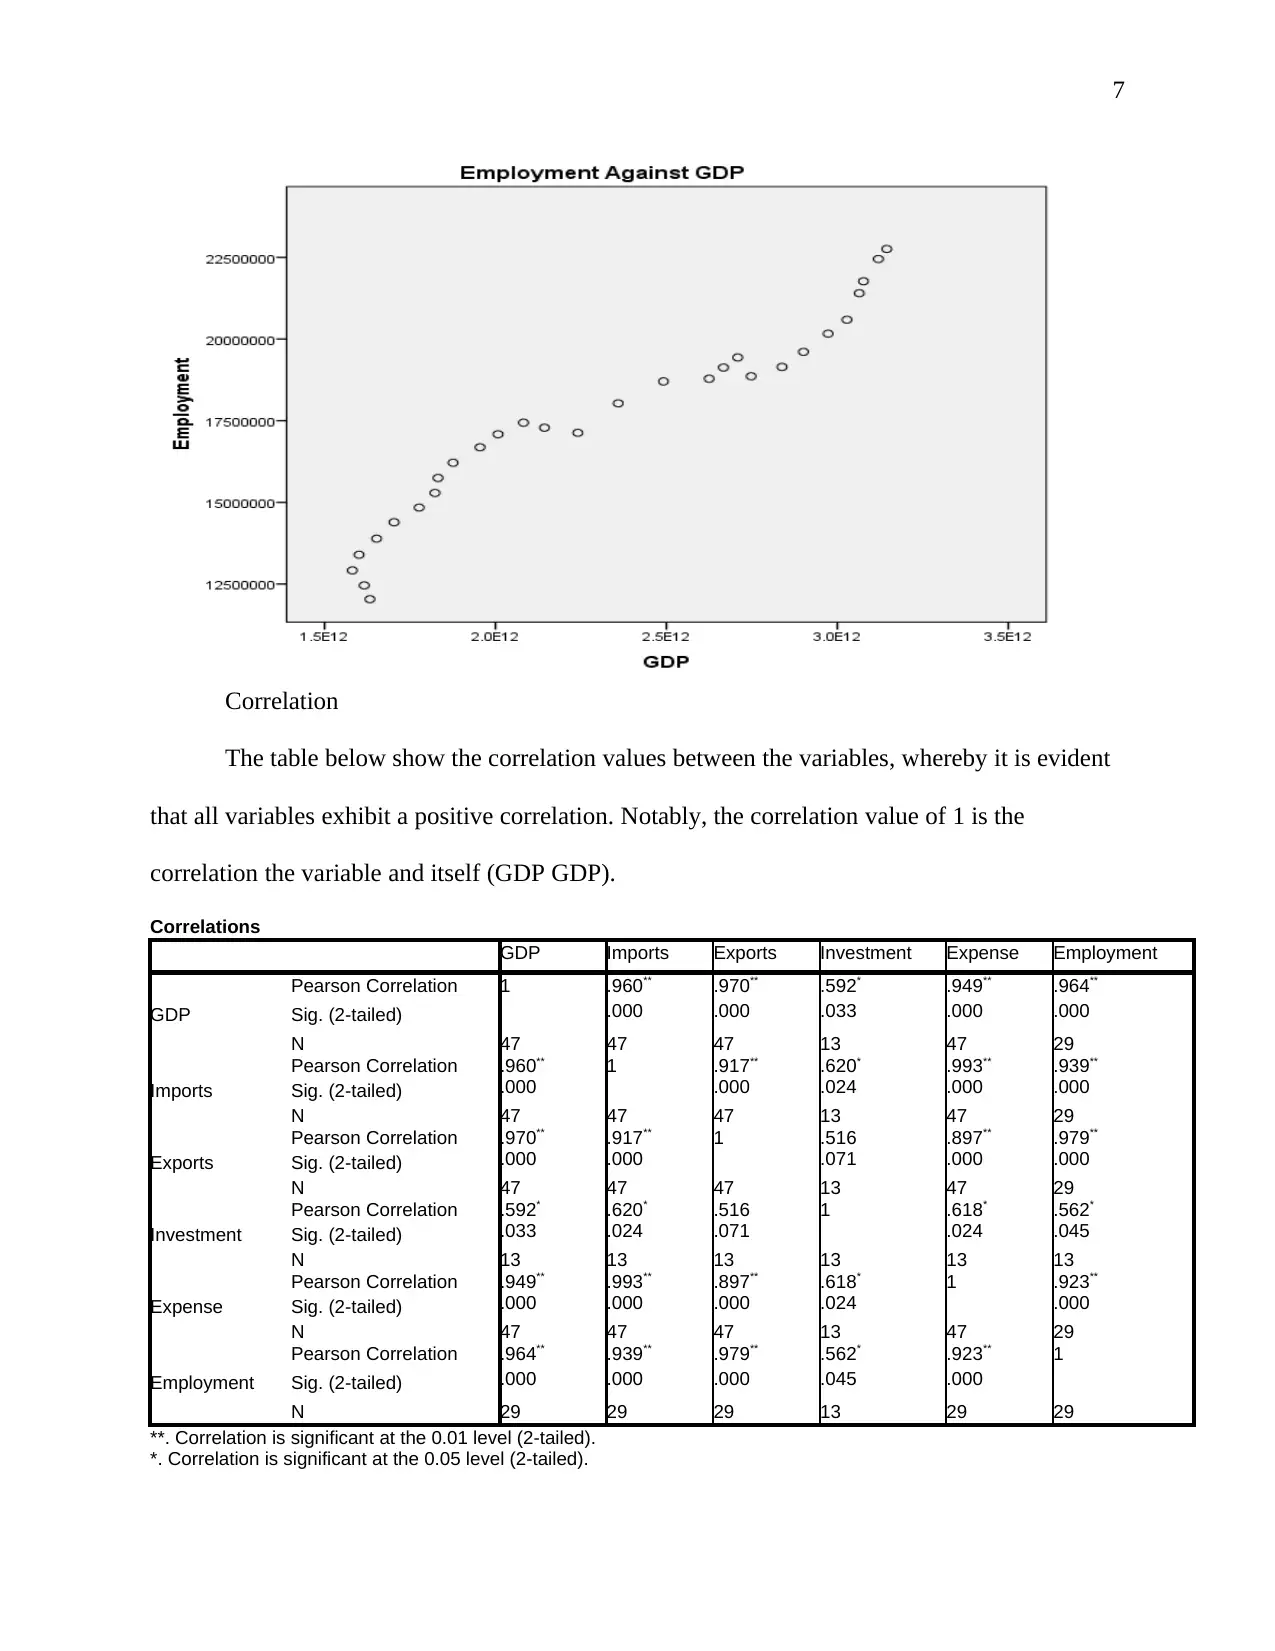
Scatter Plot
As evident, one of the hypotheses of the study is that the employment rates of developing
countries increase alongside the increase in their trade. The scatter plot below shows the level
employment against GDP, whereby it an increase in employment as GDP increases.
GDP 47 1069481509054 3144539000000 1957736704367.6 644972238724.34 .585 -1.035
Imports 47 3640000000 1440883000000 356479962176.60 452963351596.93 1.214 .064
Exports 47 296864000000 929792000000 553872770361.70 224424243280.96 .363 -1.474
Investment 13 3000000 5648610000 1535037692.31 2100244375.262 .999 -.740
Expense 47 2914000000 1663775075392 392667872929.55 498632105536.71 1.355 .610
Employment 29 12034766 22756502 17504388.90 3015477.215 -.128 -.812
Valid N (listwise) 13
Visualization: Line Graph
The graph below exhibits an increase in the value of GDP in South Africa from 1972 to
2018. Therefore, it is evident that South Africa has been experiencing economic growth for the
past 47 years.
Scatter Plot
As evident, one of the hypotheses of the study is that the employment rates of developing
countries increase alongside the increase in their trade. The scatter plot below shows the level
employment against GDP, whereby it an increase in employment as GDP increases.
⊘ This is a preview!⊘
Do you want full access?
Subscribe today to unlock all pages.
Trusted by 1+ million students worldwide
7
Correlation
The table below show the correlation values between the variables, whereby it is evident
that all variables exhibit a positive correlation. Notably, the correlation value of 1 is the
correlation the variable and itself (GDP GDP).
Correlations
GDP Imports Exports Investment Expense Employment
GDP
Pearson Correlation 1 .960** .970** .592* .949** .964**
Sig. (2-tailed) .000 .000 .033 .000 .000
N 47 47 47 13 47 29
Imports
Pearson Correlation .960** 1 .917** .620* .993** .939**
Sig. (2-tailed) .000 .000 .024 .000 .000
N 47 47 47 13 47 29
Exports
Pearson Correlation .970** .917** 1 .516 .897** .979**
Sig. (2-tailed) .000 .000 .071 .000 .000
N 47 47 47 13 47 29
Investment
Pearson Correlation .592* .620* .516 1 .618* .562*
Sig. (2-tailed) .033 .024 .071 .024 .045
N 13 13 13 13 13 13
Expense
Pearson Correlation .949** .993** .897** .618* 1 .923**
Sig. (2-tailed) .000 .000 .000 .024 .000
N 47 47 47 13 47 29
Employment
Pearson Correlation .964** .939** .979** .562* .923** 1
Sig. (2-tailed) .000 .000 .000 .045 .000
N 29 29 29 13 29 29
**. Correlation is significant at the 0.01 level (2-tailed).
*. Correlation is significant at the 0.05 level (2-tailed).
Paraphrase This Document
Need a fresh take? Get an instant paraphrase of this document with our AI Paraphraser
8
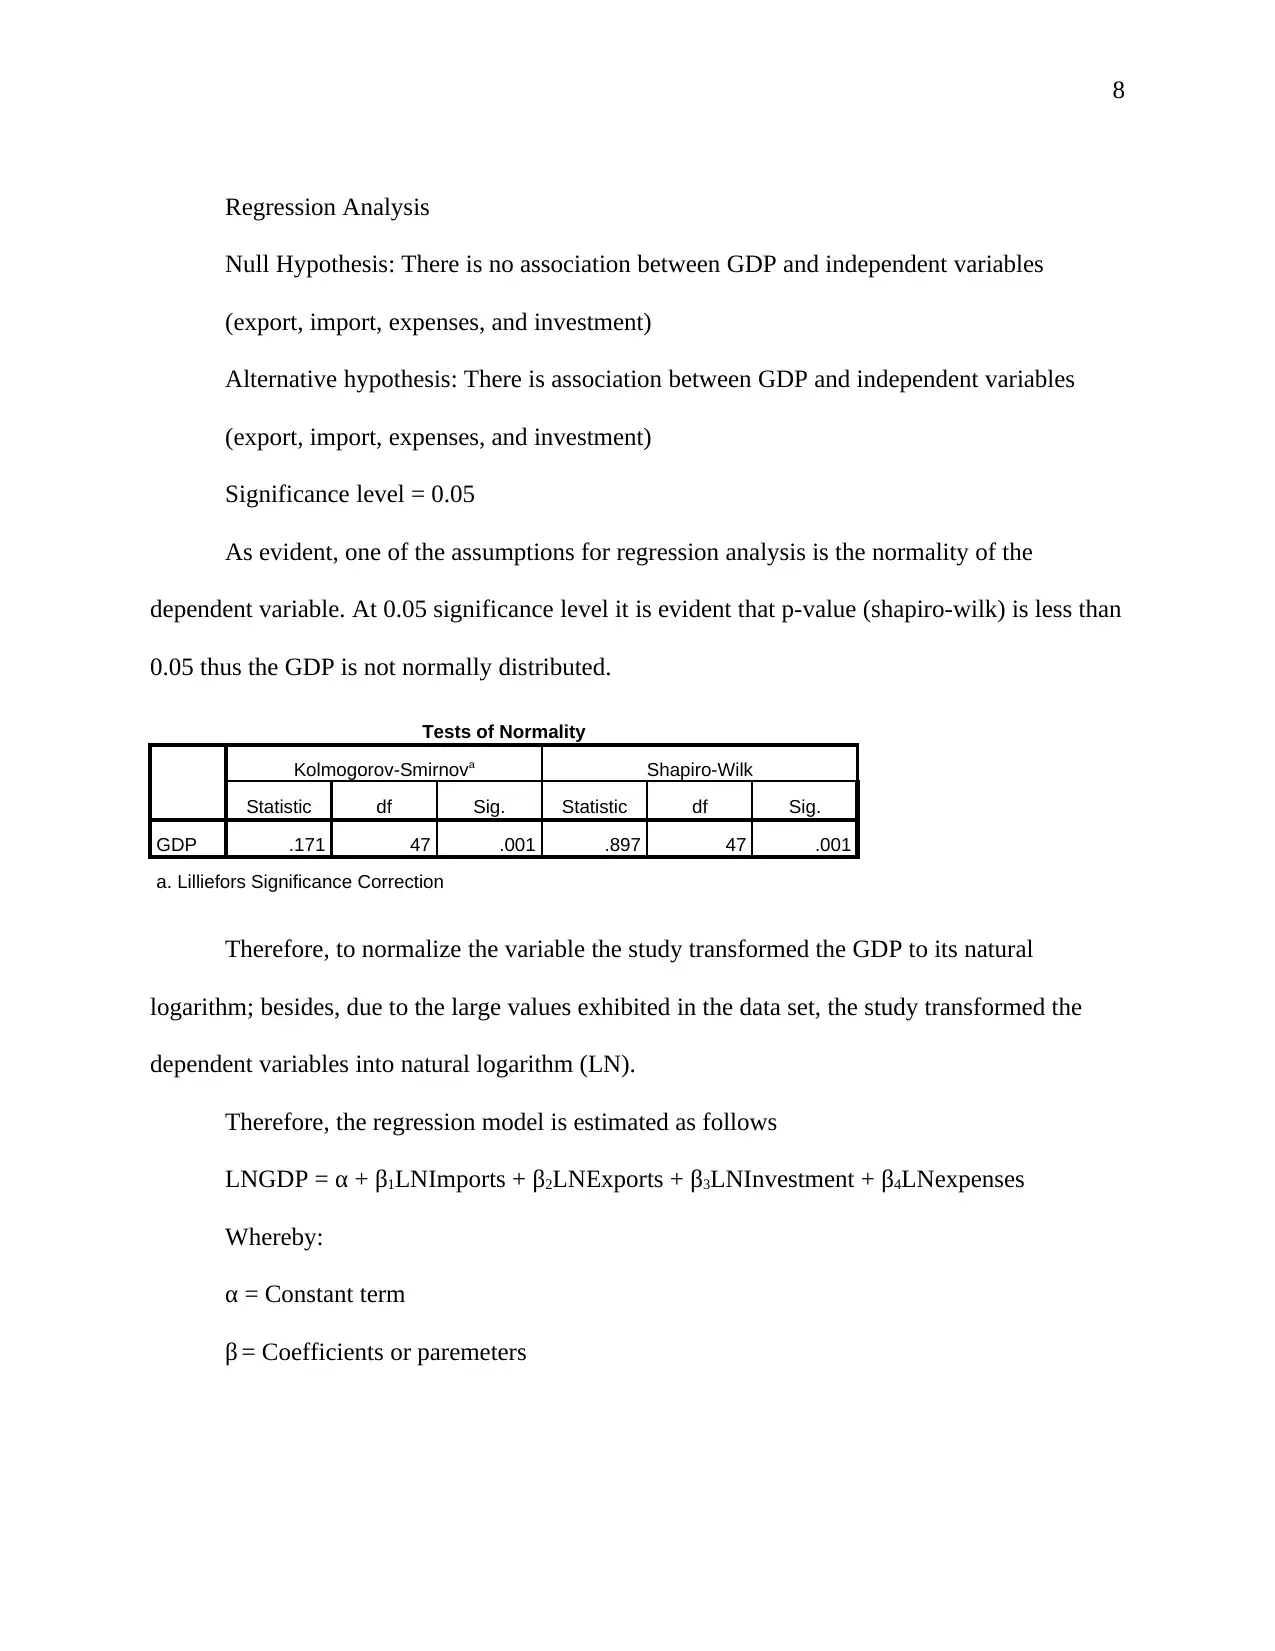
Regression Analysis
Null Hypothesis: There is no association between GDP and independent variables
(export, import, expenses, and investment)
Alternative hypothesis: There is association between GDP and independent variables
(export, import, expenses, and investment)
Significance level = 0.05
As evident, one of the assumptions for regression analysis is the normality of the
dependent variable. At 0.05 significance level it is evident that p-value (shapiro-wilk) is less than
0.05 thus the GDP is not normally distributed.
Tests of Normality
Kolmogorov-Smirnova Shapiro-Wilk
Statistic df Sig. Statistic df Sig.
GDP .171 47 .001 .897 47 .001
a. Lilliefors Significance Correction
Therefore, to normalize the variable the study transformed the GDP to its natural
logarithm; besides, due to the large values exhibited in the data set, the study transformed the
dependent variables into natural logarithm (LN).
Therefore, the regression model is estimated as follows
LNGDP = α + β1LNImports + β2LNExports + β3LNInvestment + β4LNexpenses
Whereby:
α = Constant term
β = Coefficients or paremeters
9
LNImports = Natural logarithm of yearly imports at period t (Imports include finished,
capital, and intermediate goods). Notably, depending on the type of import they tend to
have either positive of negative impact on GDP
LNExports = Natural logarithm of Exports at period t (The exports are expected to have a
positive impact on GDP
LNInvestment = Natural logarithm of Investments at period t (Notably investments
include both government and private investments, they include infrastructures (road,
electricity, and water, among others)
LNGDP = the natural logarithm of GDP at time t
LNexpenses = The natural logarithm of government expenditure at period t (The
government expenditure includes purchase of goods and services intended to create
infrastructure thus it is expected to have a positive impact on the GDP)
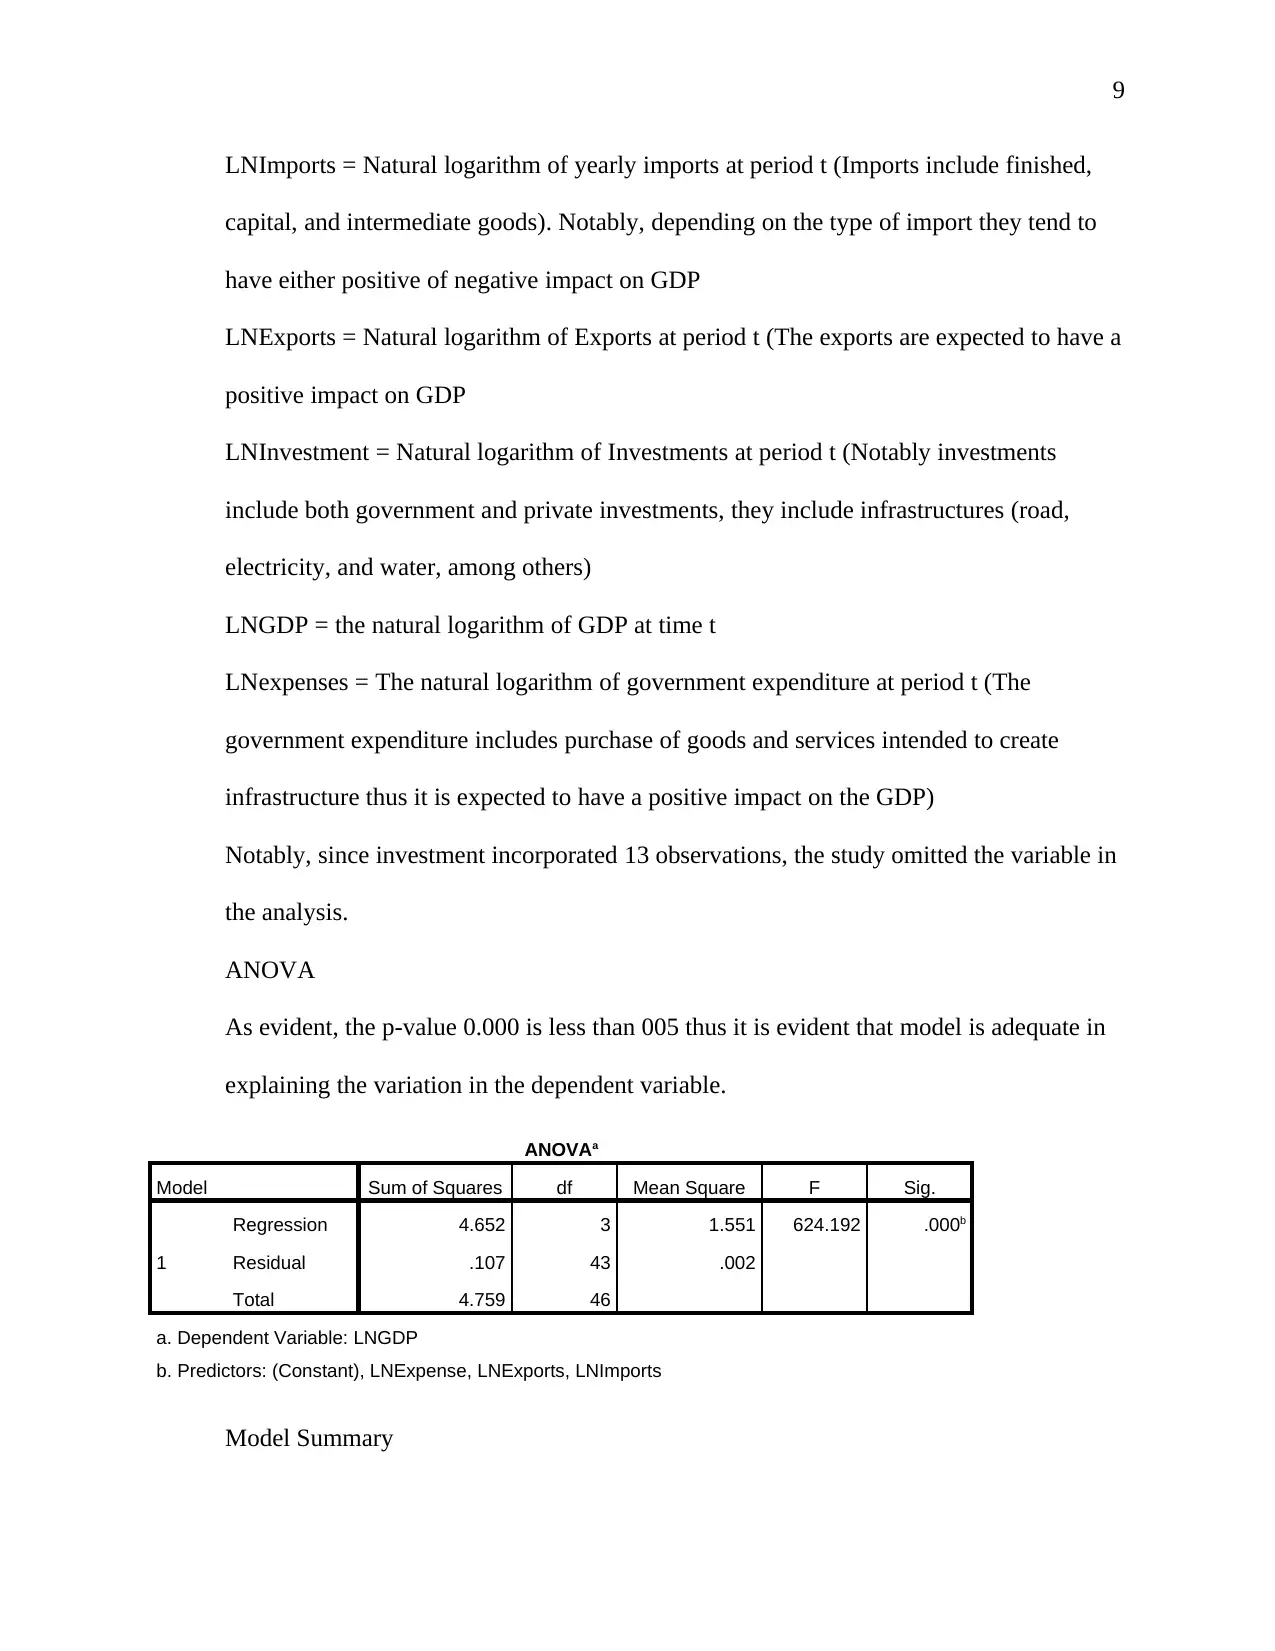
Notably, since investment incorporated 13 observations, the study omitted the variable in
the analysis.
ANOVA
As evident, the p-value 0.000 is less than 005 thus it is evident that model is adequate in
explaining the variation in the dependent variable.
ANOVAa
Model Sum of Squares df Mean Square F Sig.
1
Regression 4.652 3 1.551 624.192 .000b
Residual .107 43 .002
Total 4.759 46
a. Dependent Variable: LNGDP
b. Predictors: (Constant), LNExpense, LNExports, LNImports
Model Summary
LNImports = Natural logarithm of yearly imports at period t (Imports include finished,
capital, and intermediate goods). Notably, depending on the type of import they tend to
have either positive of negative impact on GDP
LNExports = Natural logarithm of Exports at period t (The exports are expected to have a
positive impact on GDP
LNInvestment = Natural logarithm of Investments at period t (Notably investments
include both government and private investments, they include infrastructures (road,
electricity, and water, among others)
LNGDP = the natural logarithm of GDP at time t
LNexpenses = The natural logarithm of government expenditure at period t (The
government expenditure includes purchase of goods and services intended to create
infrastructure thus it is expected to have a positive impact on the GDP)
Notably, since investment incorporated 13 observations, the study omitted the variable in
the analysis.
ANOVA
As evident, the p-value 0.000 is less than 005 thus it is evident that model is adequate in
explaining the variation in the dependent variable.
ANOVAa
Model Sum of Squares df Mean Square F Sig.
1
Regression 4.652 3 1.551 624.192 .000b
Residual .107 43 .002
Total 4.759 46
a. Dependent Variable: LNGDP
b. Predictors: (Constant), LNExpense, LNExports, LNImports
Model Summary
⊘ This is a preview!⊘
Do you want full access?
Subscribe today to unlock all pages.
Trusted by 1+ million students worldwide
10
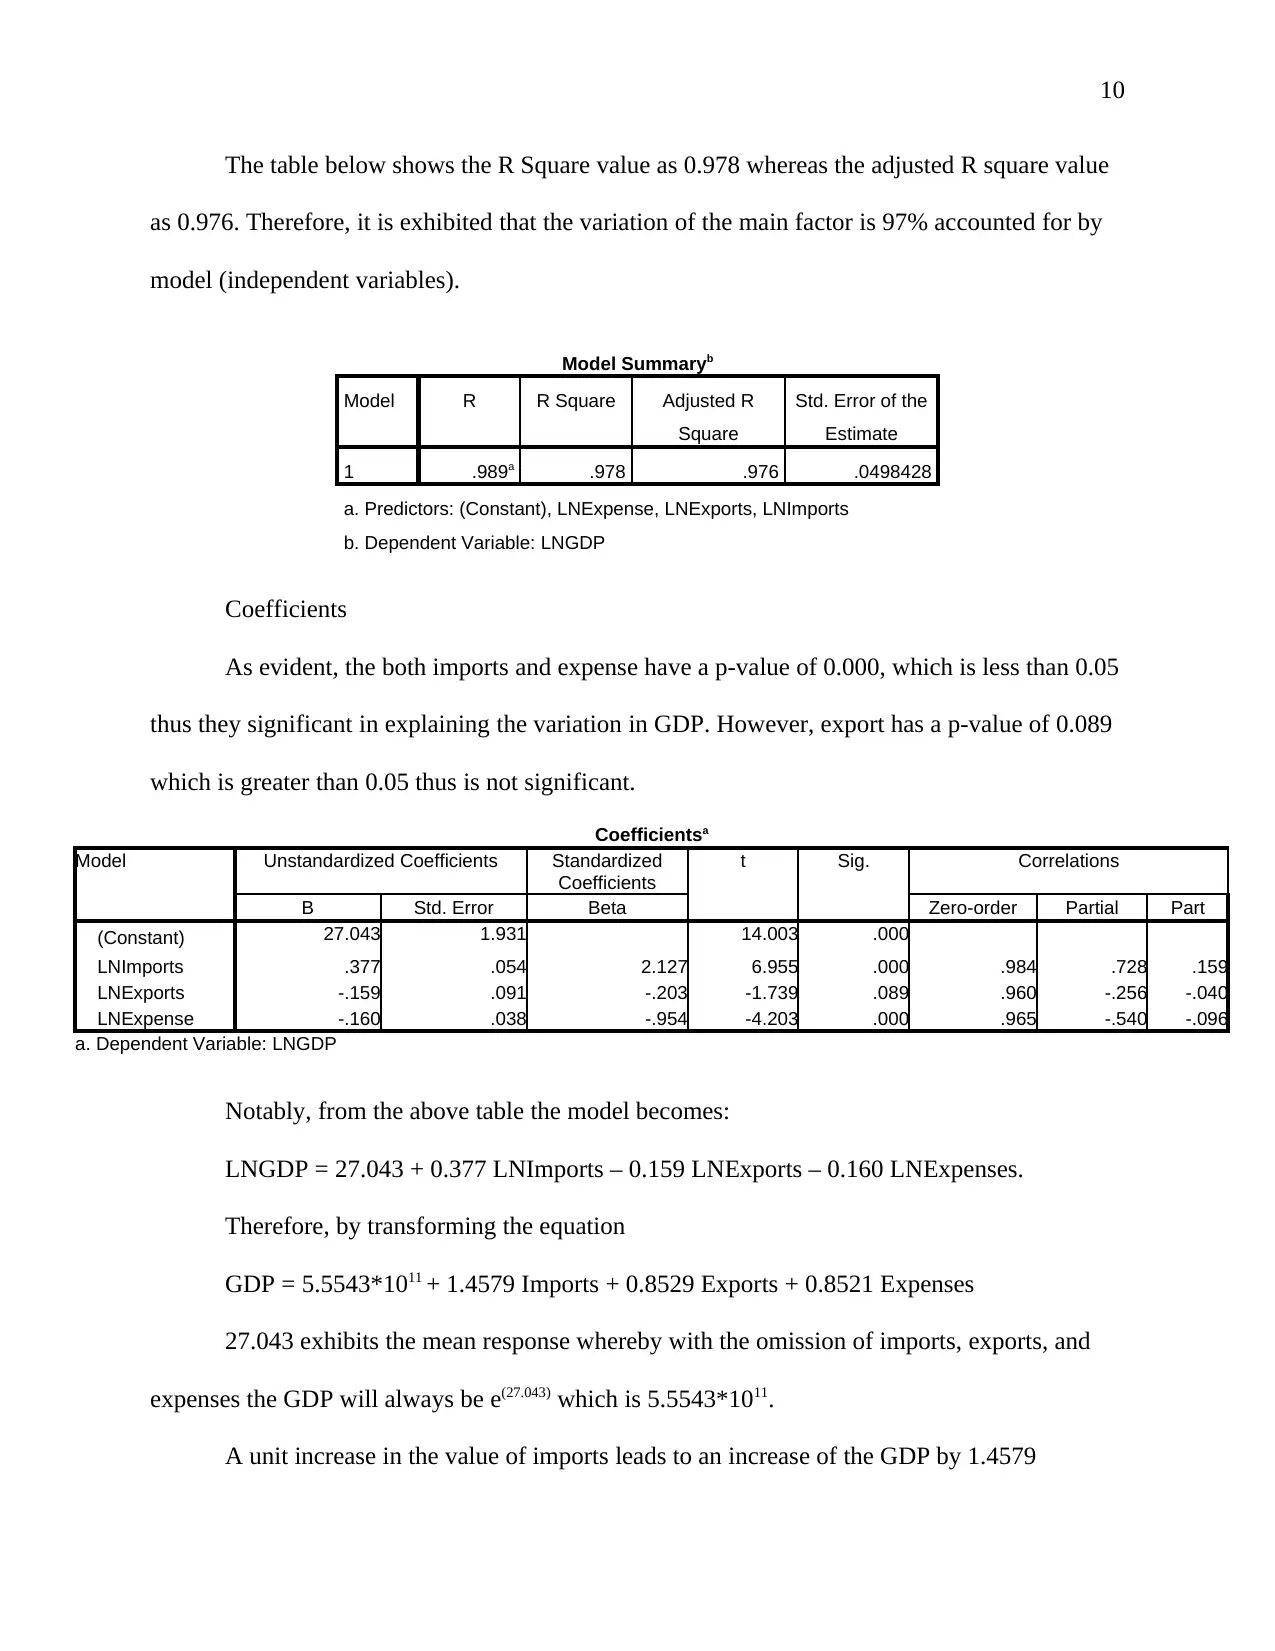
The table below shows the R Square value as 0.978 whereas the adjusted R square value
as 0.976. Therefore, it is exhibited that the variation of the main factor is 97% accounted for by
model (independent variables).
Coefficients
As evident, the both imports and expense have a p-value of 0.000, which is less than 0.05
thus they significant in explaining the variation in GDP. However, export has a p-value of 0.089
which is greater than 0.05 thus is not significant.
Coefficientsa
Model Unstandardized Coefficients Standardized
Coefficients
t Sig. Correlations
B Std. Error Beta Zero-order Partial Part
(Constant) 27.043 1.931 14.003 .000
LNImports .377 .054 2.127 6.955 .000 .984 .728 .159
LNExports -.159 .091 -.203 -1.739 .089 .960 -.256 -.040
LNExpense -.160 .038 -.954 -4.203 .000 .965 -.540 -.096
a. Dependent Variable: LNGDP
Notably, from the above table the model becomes:
LNGDP = 27.043 + 0.377 LNImports – 0.159 LNExports – 0.160 LNExpenses.
Therefore, by transforming the equation
GDP = 5.5543*1011 + 1.4579 Imports + 0.8529 Exports + 0.8521 Expenses
27.043 exhibits the mean response whereby with the omission of imports, exports, and
expenses the GDP will always be e(27.043) which is 5.5543*1011.
A unit increase in the value of imports leads to an increase of the GDP by 1.4579
Model Summaryb
Model R R Square Adjusted R
Square
Std. Error of the
Estimate
1 .989a .978 .976 .0498428
a. Predictors: (Constant), LNExpense, LNExports, LNImports
b. Dependent Variable: LNGDP
Paraphrase This Document
Need a fresh take? Get an instant paraphrase of this document with our AI Paraphraser
11
A unit increase in the value of the exports increase the GDP by 0.8529
A unit increase in the value of the expenses increase the GDP by 0.8521
Generally, it is evident that imports tend to have a greater positive impact to the GDP
compared to other components. Besides, it is evident that the import has a statistical significance
in explaining the GDP.
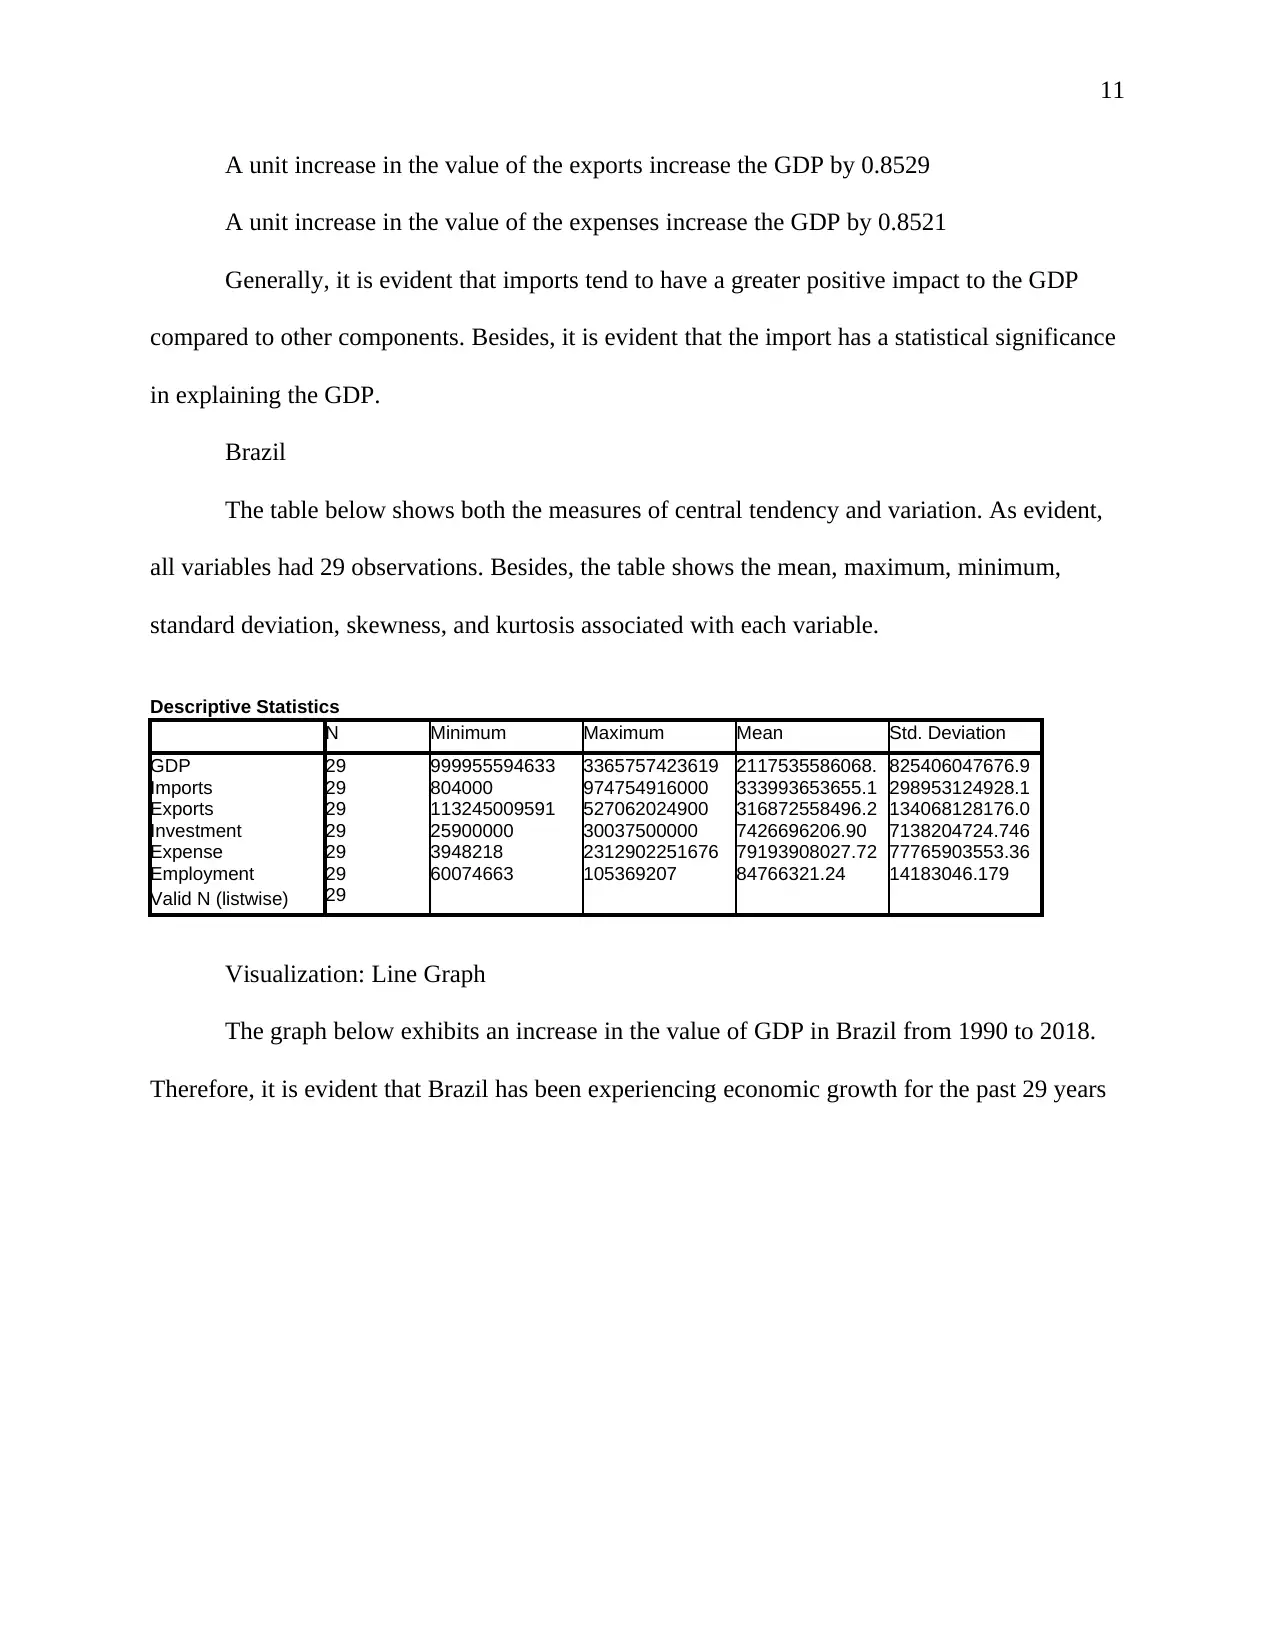
Brazil
The table below shows both the measures of central tendency and variation. As evident,
all variables had 29 observations. Besides, the table shows the mean, maximum, minimum,
standard deviation, skewness, and kurtosis associated with each variable.
Descriptive Statistics
N Minimum Maximum Mean Std. Deviation
GDP 29 999955594633 3365757423619 2117535586068. 825406047676.9
Imports 29 804000 974754916000 333993653655.1 298953124928.1
Exports 29 113245009591 527062024900 316872558496.2 134068128176.0
Investment 29 25900000 30037500000 7426696206.90 7138204724.746
Expense 29 3948218 2312902251676 79193908027.72 77765903553.36
Employment 29 60074663 105369207 84766321.24 14183046.179
Valid N (listwise) 29
Visualization: Line Graph
The graph below exhibits an increase in the value of GDP in Brazil from 1990 to 2018.
Therefore, it is evident that Brazil has been experiencing economic growth for the past 29 years
A unit increase in the value of the exports increase the GDP by 0.8529
A unit increase in the value of the expenses increase the GDP by 0.8521
Generally, it is evident that imports tend to have a greater positive impact to the GDP
compared to other components. Besides, it is evident that the import has a statistical significance
in explaining the GDP.
Brazil
The table below shows both the measures of central tendency and variation. As evident,
all variables had 29 observations. Besides, the table shows the mean, maximum, minimum,
standard deviation, skewness, and kurtosis associated with each variable.
Descriptive Statistics
N Minimum Maximum Mean Std. Deviation
GDP 29 999955594633 3365757423619 2117535586068. 825406047676.9
Imports 29 804000 974754916000 333993653655.1 298953124928.1
Exports 29 113245009591 527062024900 316872558496.2 134068128176.0
Investment 29 25900000 30037500000 7426696206.90 7138204724.746
Expense 29 3948218 2312902251676 79193908027.72 77765903553.36
Employment 29 60074663 105369207 84766321.24 14183046.179
Valid N (listwise) 29
Visualization: Line Graph
The graph below exhibits an increase in the value of GDP in Brazil from 1990 to 2018.
Therefore, it is evident that Brazil has been experiencing economic growth for the past 29 years
12
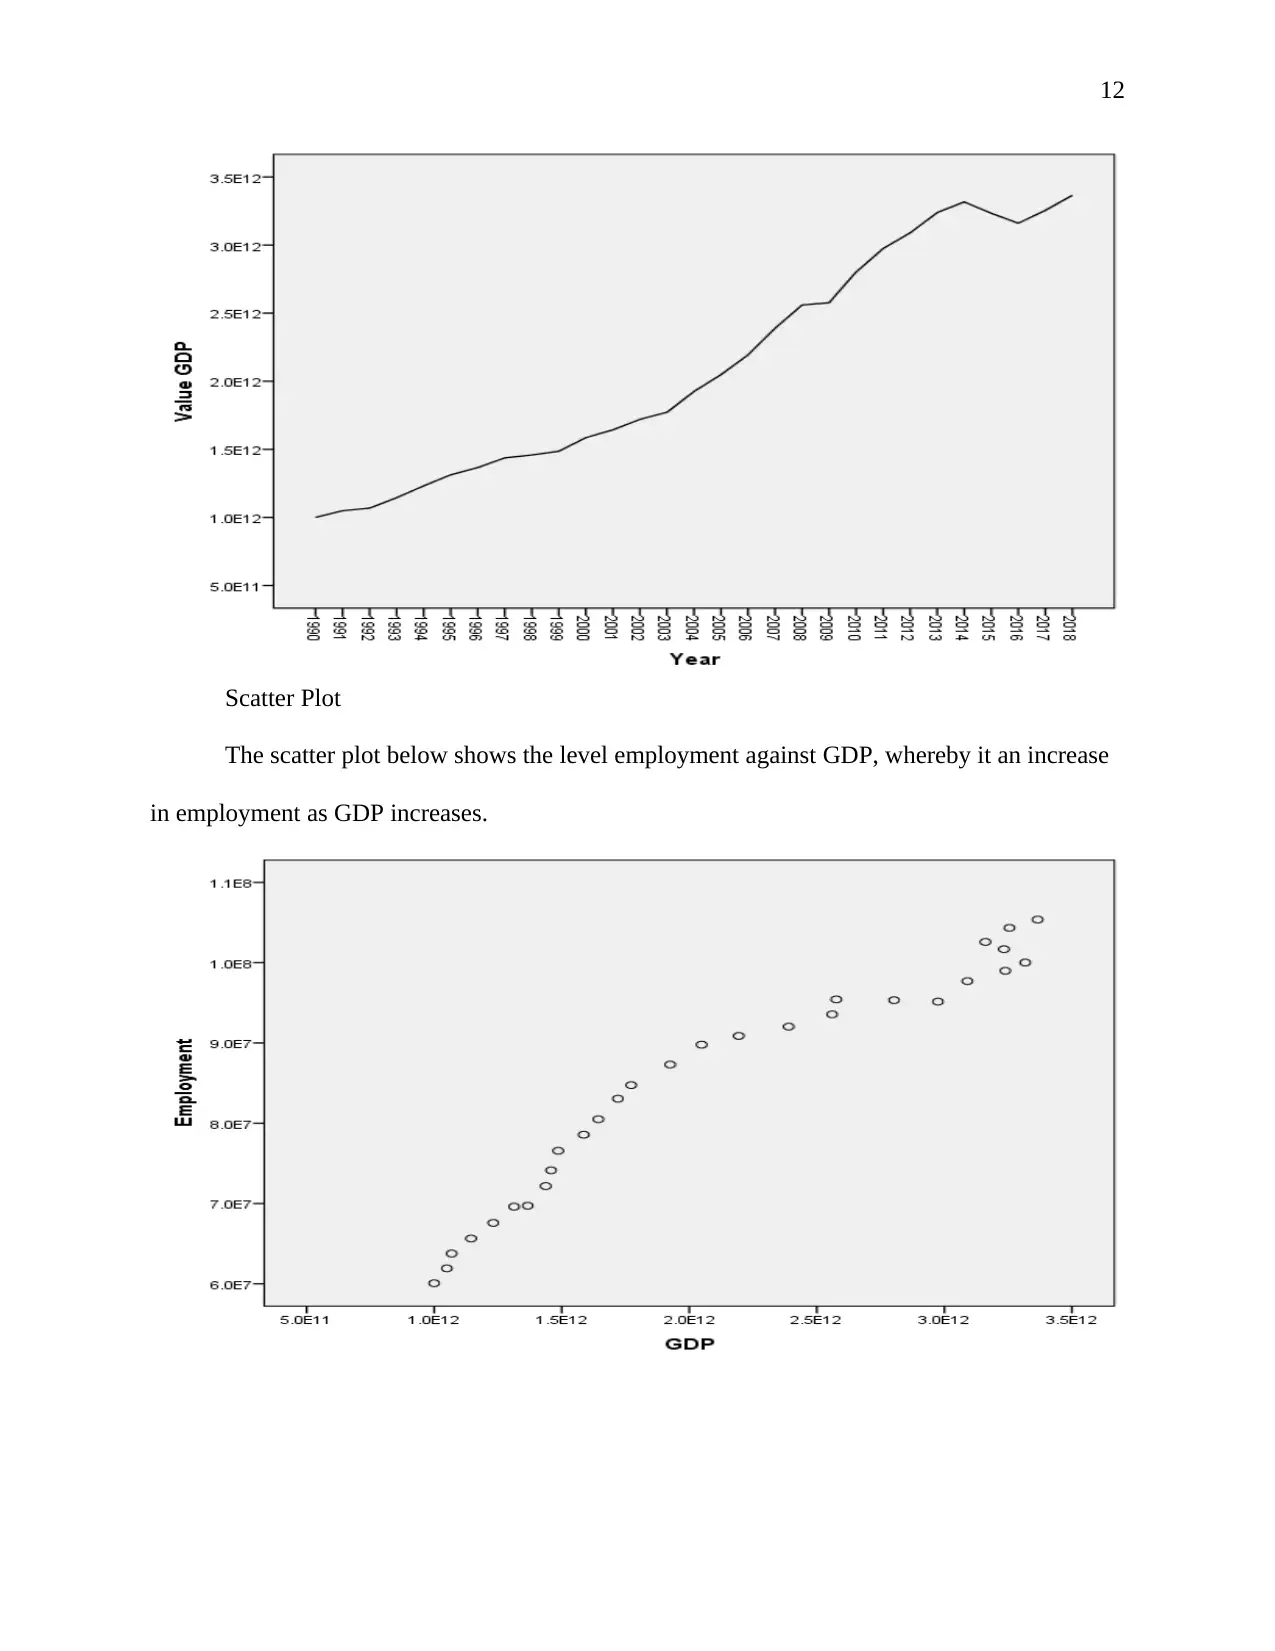
Scatter Plot
The scatter plot below shows the level employment against GDP, whereby it an increase
in employment as GDP increases.
Scatter Plot
The scatter plot below shows the level employment against GDP, whereby it an increase
in employment as GDP increases.
⊘ This is a preview!⊘
Do you want full access?
Subscribe today to unlock all pages.
Trusted by 1+ million students worldwide
1 out of 16
Related Documents


Your All-in-One AI-Powered Toolkit for Academic Success.
+13062052269
info@desklib.com
Available 24*7 on WhatsApp / Email
![[object Object]](/_next/static/media/star-bottom.7253800d.svg)
Unlock your academic potential
Copyright © 2020–2026 A2Z Services. All Rights Reserved. Developed and managed by ZUCOL.