Petrol Price Analysis & Statistical Modelling: BUS708 Assignment
VerifiedAdded on 2023/04/04
|8
|1867
|332
Report
AI Summary
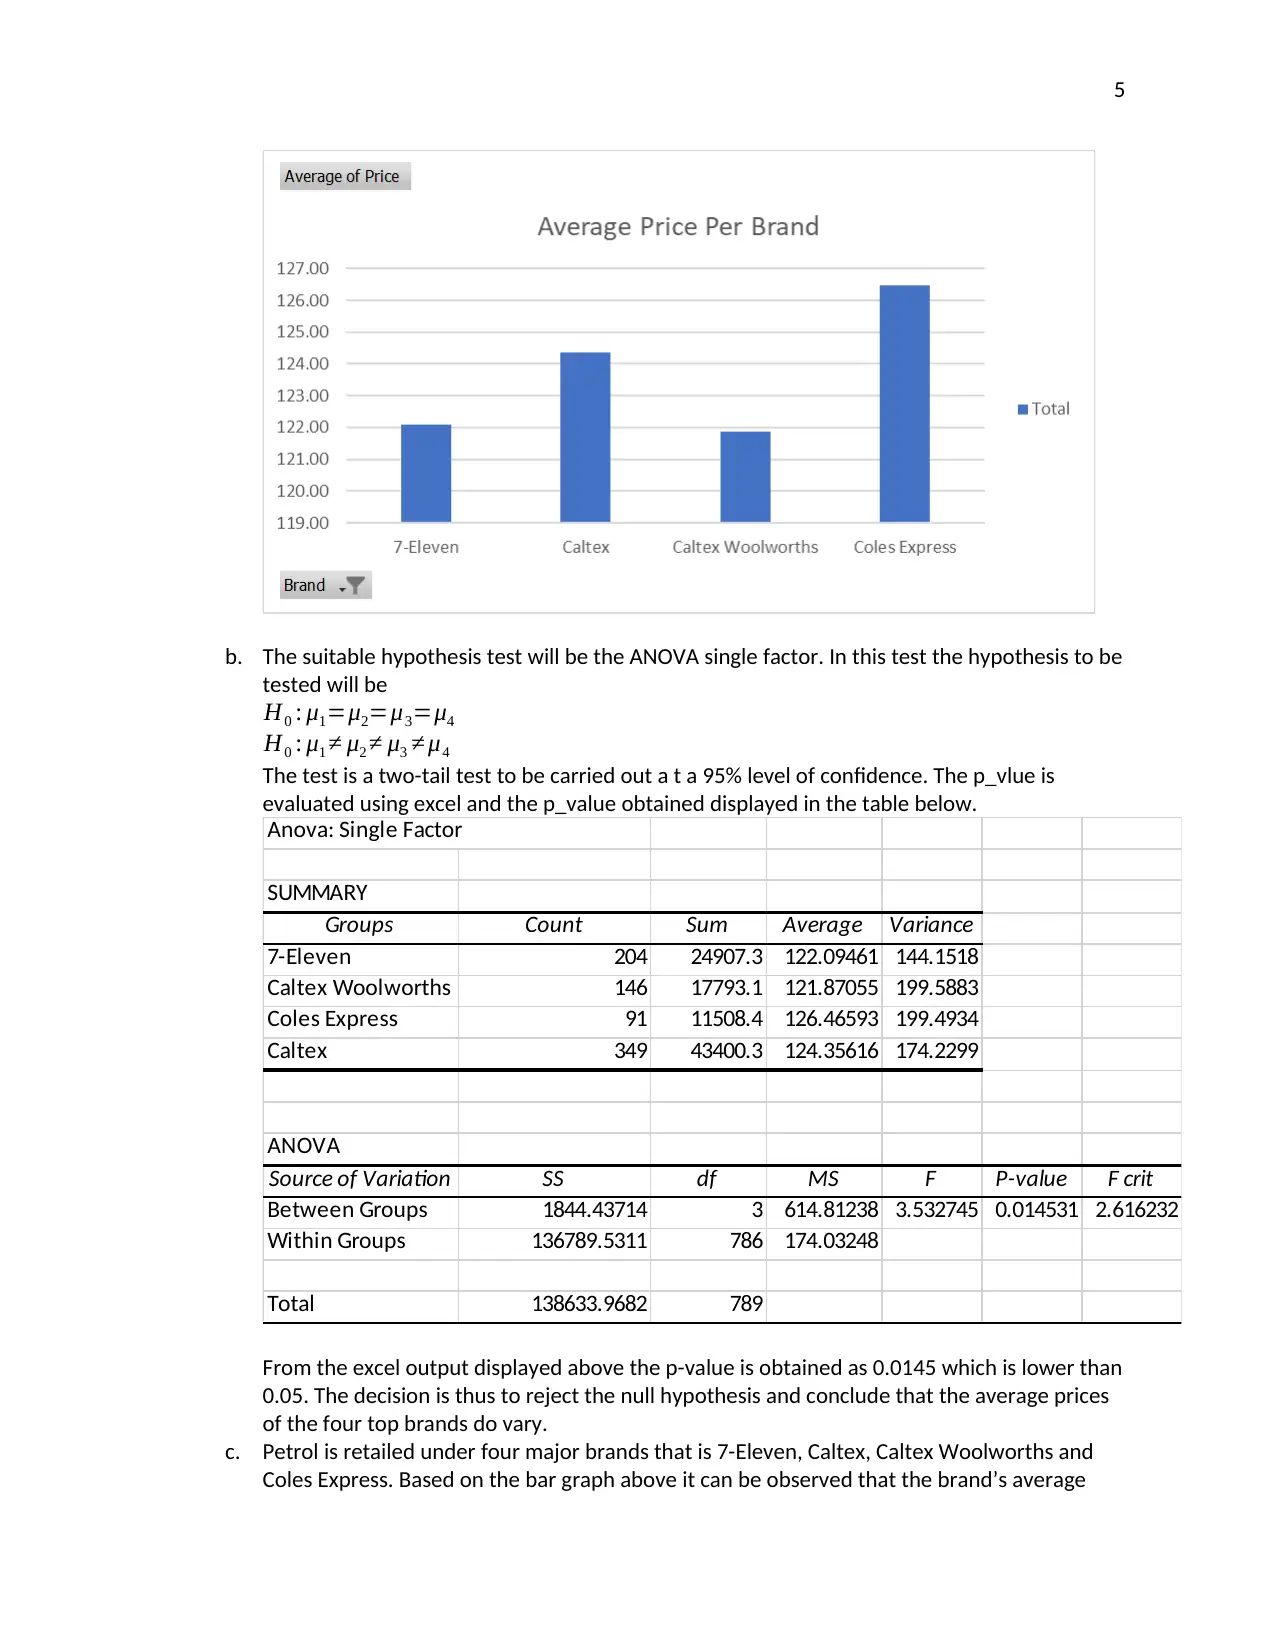
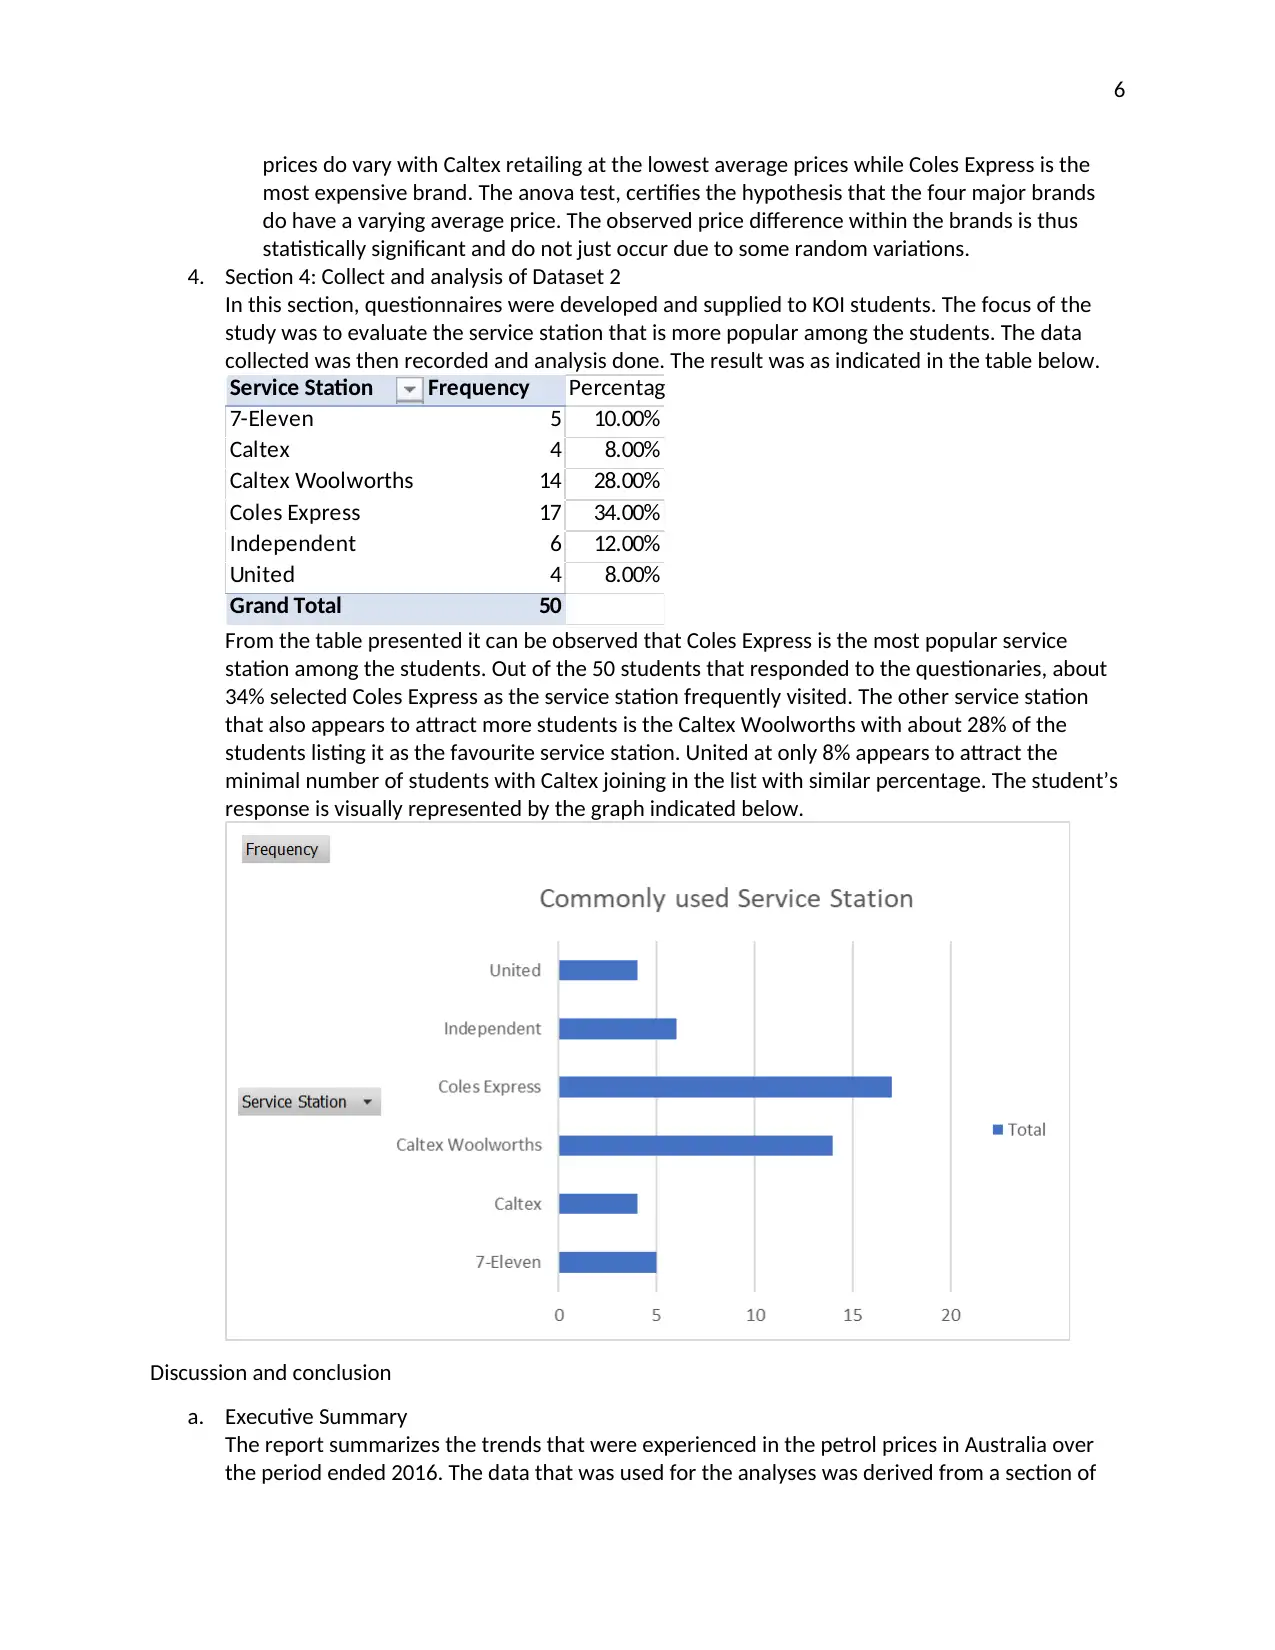
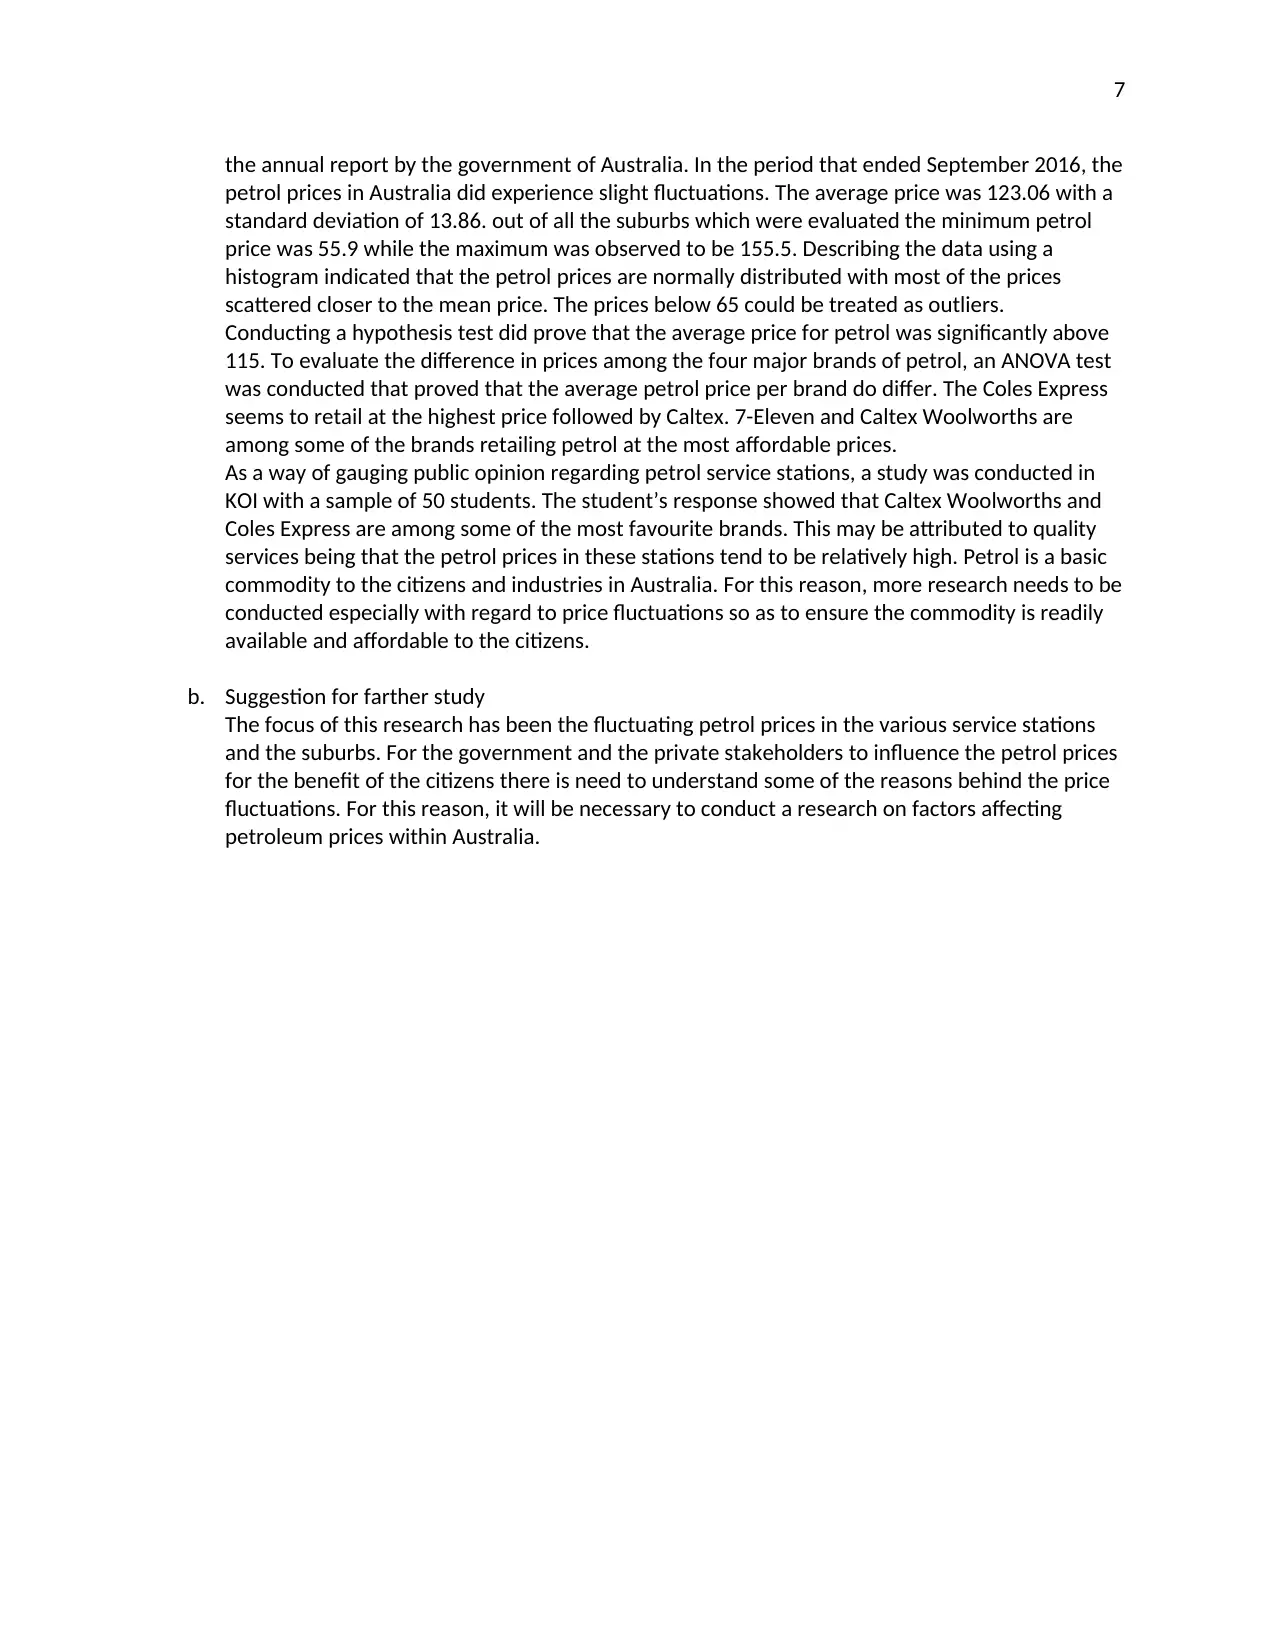
This report provides an analysis of petrol prices in Australia, utilizing data from government sources and a survey of KOI students. The analysis includes statistical modeling to identify trends and variability in petrol prices, with a focus on supporting NRMA's media reporting. Key findings include the average petrol price, price variations across different brands (7-Eleven, Caltex, Caltex Woolworths, and Coles Express), and student preferences for service stations. Hypothesis testing and ANOVA are used to determine the significance of price differences. The report concludes with suggestions for further research, emphasizing the importance of understanding factors affecting petrol price fluctuations to ensure affordability and availability for Australian citizens and industries. Desklib offers a range of similar reports and solved assignments for students.
1 out of 8
Related Documents


Your All-in-One AI-Powered Toolkit for Academic Success.
+13062052269
info@desklib.com
Available 24*7 on WhatsApp / Email
![[object Object]](/_next/static/media/star-bottom.7253800d.svg)
Copyright © 2020–2025 A2Z Services. All Rights Reserved. Developed and managed by ZUCOL.