Financial Analysis of Caltex Australia
VerifiedAdded on 2023/04/03
|22
|4550
|450
AI Summary
This report evaluates the financial performance of Caltex Australia and provides recommendations to potential investors. It includes ratio analysis, cash management, sensitivity analysis, and dividend payout ratio.
Contribute Materials
Your contribution can guide someone’s learning journey. Share your
documents today.
1
Unit Code: HI5002
Unit Title: Finance for Business
Group Assignment
Unit Code: HI5002
Unit Title: Finance for Business
Group Assignment
Secure Best Marks with AI Grader
Need help grading? Try our AI Grader for instant feedback on your assignments.
2
Abstract
The report has evaluated the financial performance of Caltex Australia for proving
recommendation to a potential investors regarding investment within the company. The financial
performance has been analyzed with the use of ratio analysis, cash management, and sensitivity
analysis and dividend payout ratio. It is recommended to an investor to hold back the share and
not to invest within the company due to its weak financial position as depicted with ratio
analysis.
3
Contents
Abstract............................................................................................................................................2
Section I: Introduction.....................................................................................................................4
Section II: Detailed financial analysis of Caltex Australia..............................................................4
Section 2.1: Brief description of Caltex Australia...........................................................................4
Section 2.2: Use of ratios to evaluate the performance of Caltex Australia....................................4
Profitability Ratios of Caltex Australia........................................................................................4
Operating Efficiency Ratio..........................................................................................................7
Section 2.3: Use of marketable securities for cash management.....................................................9
Section 2.4: Sensitivity Analysis through using the given data.....................................................10
Section 2.5: Identification and discussion on systematic risk and Unsystematic risk that impacts
the performance of Caltex Australia..............................................................................................16
Systematic Risks associated with Caltex Australia....................................................................16
Unsystematic Risks associated with the Caltex Australia.........................................................16
Section 2.6: Calculation of dividend payout of Caltex Australia for last three years and
interpretation of dividend policy used by Caltex...........................................................................17
Dividend Payout Ratio of Caltex Australia................................................................................17
Section III: Letter of Recommendation to the client.....................................................................19
Section IV: Conclusion..................................................................................................................19
References......................................................................................................................................20
4
Section I: Introduction
The purpose of the assignment is to provide recommendation to an institutional investor
aiming to invest within Australian market by undertaking an analysis of the financial
performance of an ASX listed entity. The ASX listed entity selected for the purpose of
conducting financial evaluation is Caltex Australia, a supplier of transport fuel and convenience
retailing products. The financial evaluation of the selected company has been done by analysis of
its performance ratios such as profitability and operational efficiency. This is followed by
analyzing its cash management and performing sensitivity analysis on the data provided. Also, it
has outlined the systematic and unsystematic risks related with the company and also evaluated
its dividend policy. Lastly, it provides recommendation to a potential investor regarding the
financial health of the company to support the investment decisions on the basis of overall
evaluation carried out. It also includes a conclusions section in the last to summarize the overall
findings generated through the report.
Section II: Detailed financial analysis of Caltex Australia
Section 2.1: Brief description of Caltex Australia
Caltex Australia is a publicly listed ASX company involved in supplying of transport fuel
and also operates as a convenient retailer within Australian market. The core segments of the
company includes purchasing, refining,, distributing and marketing of petroleum based products
and also having its own convenience stores in the country. It has established in period of 1990s
and is regarded to be only fuel based company of Australia that is listed on the ASX. It has
presently attained a distinctive position within the oil and gas sector of the country owing to its
leading position in transporting fuels. It is known to supply about one third of transport fuel
needs within Australian market. The leading position has been attained by the company owning
to its agile supply chain that enables it in providing safe and high quality fuel based products to
its diverse customers such as retail, mining, aviation, agriculture, automotive sector and the
government. It has developed its unique position among all the refiner and marketers in Australia
by conducting its operations in an independent manner and all the decisions are taken by the
management and Board members as it is only publicly listed company. It has the presence of
about 3,500 employees working across the country and is known to be one of the biggest
companies developing attractive job opportunities and supporting the development of
employment sector within the country (Caltex Australia: Our Company, 2018).
Section 2.2: Use of ratios to evaluate the performance of Caltex Australia
Profitability Ratios of Caltex Australia
Financial Data of Caltex Australia for calculation of Profitability Ratio
Secure Best Marks with AI Grader
Need help grading? Try our AI Grader for instant feedback on your assignments.
5
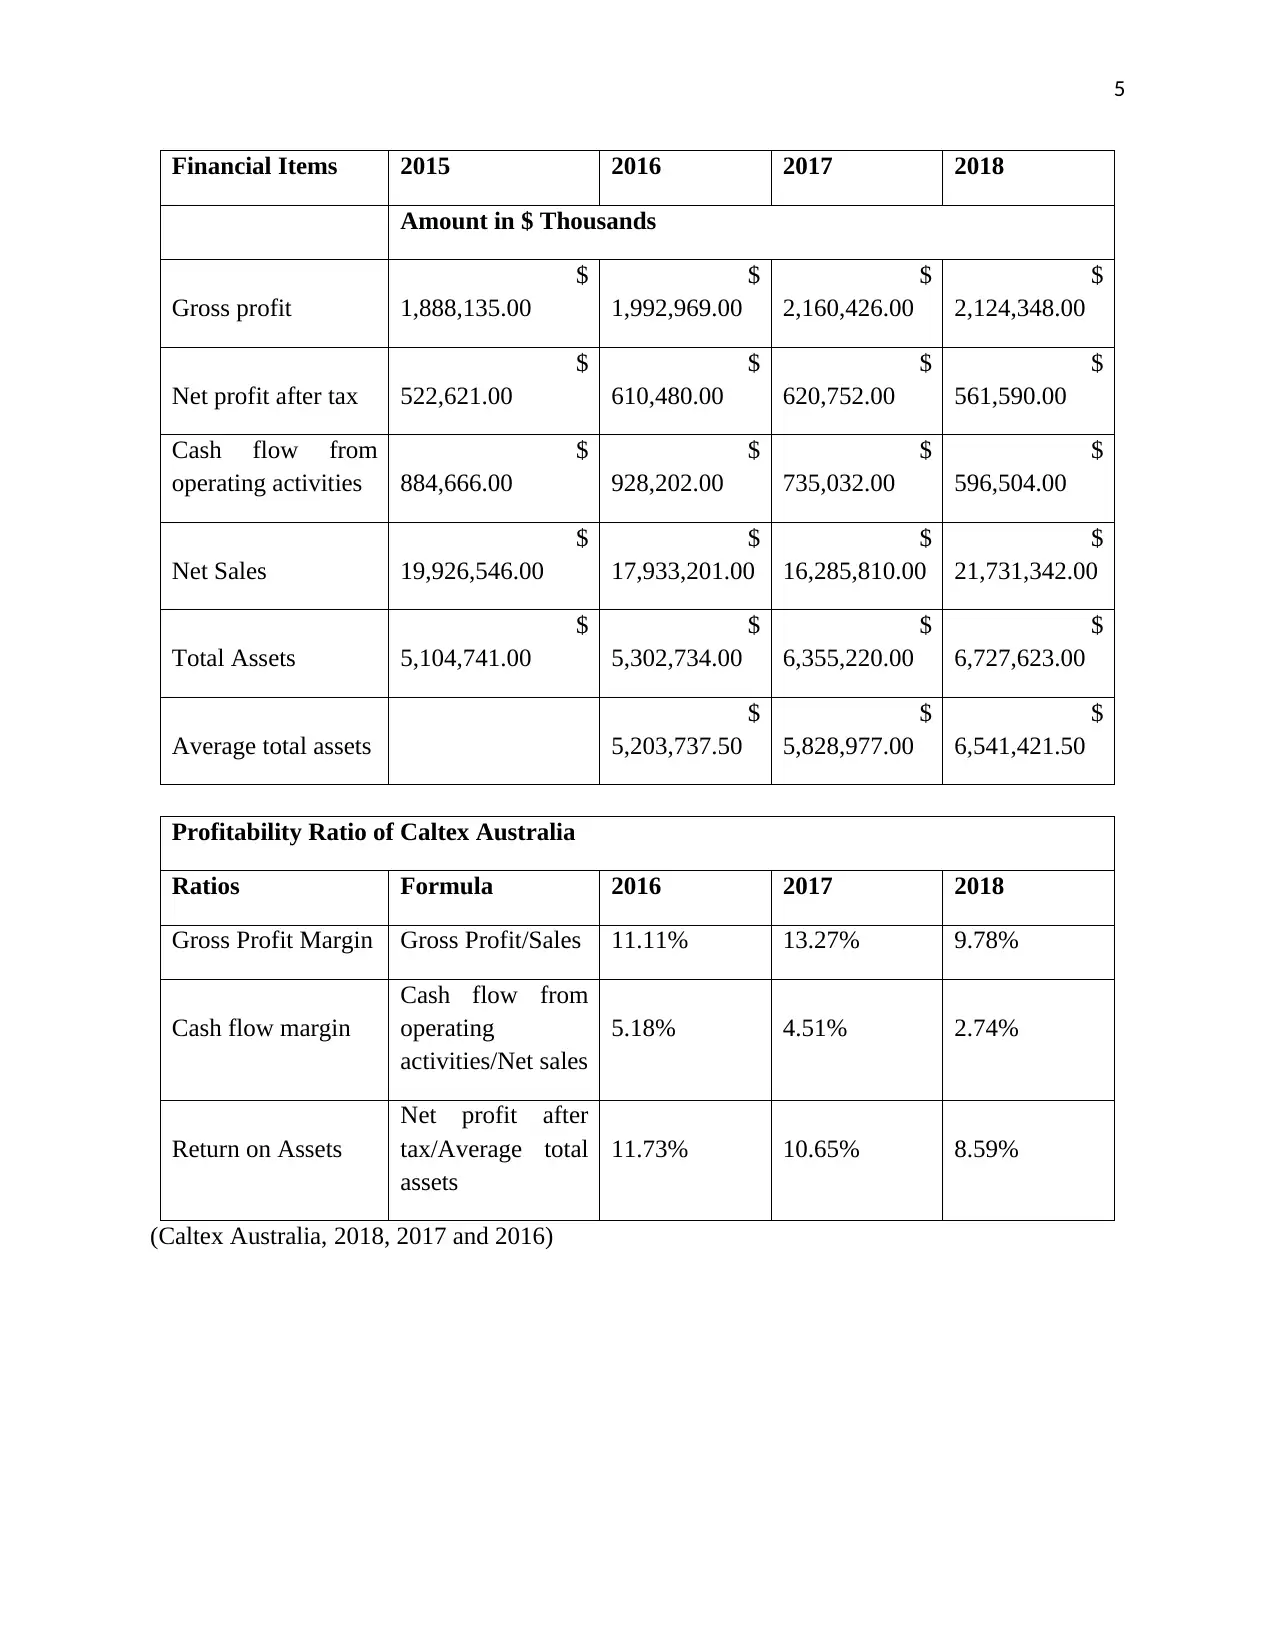
Financial Items 2015 2016 2017 2018
Amount in $ Thousands
Gross profit
$
1,888,135.00
$
1,992,969.00
$
2,160,426.00
$
2,124,348.00
Net profit after tax
$
522,621.00
$
610,480.00
$
620,752.00
$
561,590.00
Cash flow from
operating activities
$
884,666.00
$
928,202.00
$
735,032.00
$
596,504.00
Net Sales
$
19,926,546.00
$
17,933,201.00
$
16,285,810.00
$
21,731,342.00
Total Assets
$
5,104,741.00
$
5,302,734.00
$
6,355,220.00
$
6,727,623.00
Average total assets
$
5,203,737.50
$
5,828,977.00
$
6,541,421.50
Profitability Ratio of Caltex Australia
Ratios Formula 2016 2017 2018
Gross Profit Margin Gross Profit/Sales 11.11% 13.27% 9.78%
Cash flow margin
Cash flow from
operating
activities/Net sales
5.18% 4.51% 2.74%
Return on Assets
Net profit after
tax/Average total
assets
11.73% 10.65% 8.59%
(Caltex Australia, 2018, 2017 and 2016)
6
2016 2017 2018
0.00%
2.00%
4.00%
6.00%
8.00%
10.00%
12.00%
14.00%
11.11%
13.27%
9.78%
5.18%
4.51%
2.74%
11.73%
10.65%
8.59%
Profitability Ratio of Caltex Australia
Percentage
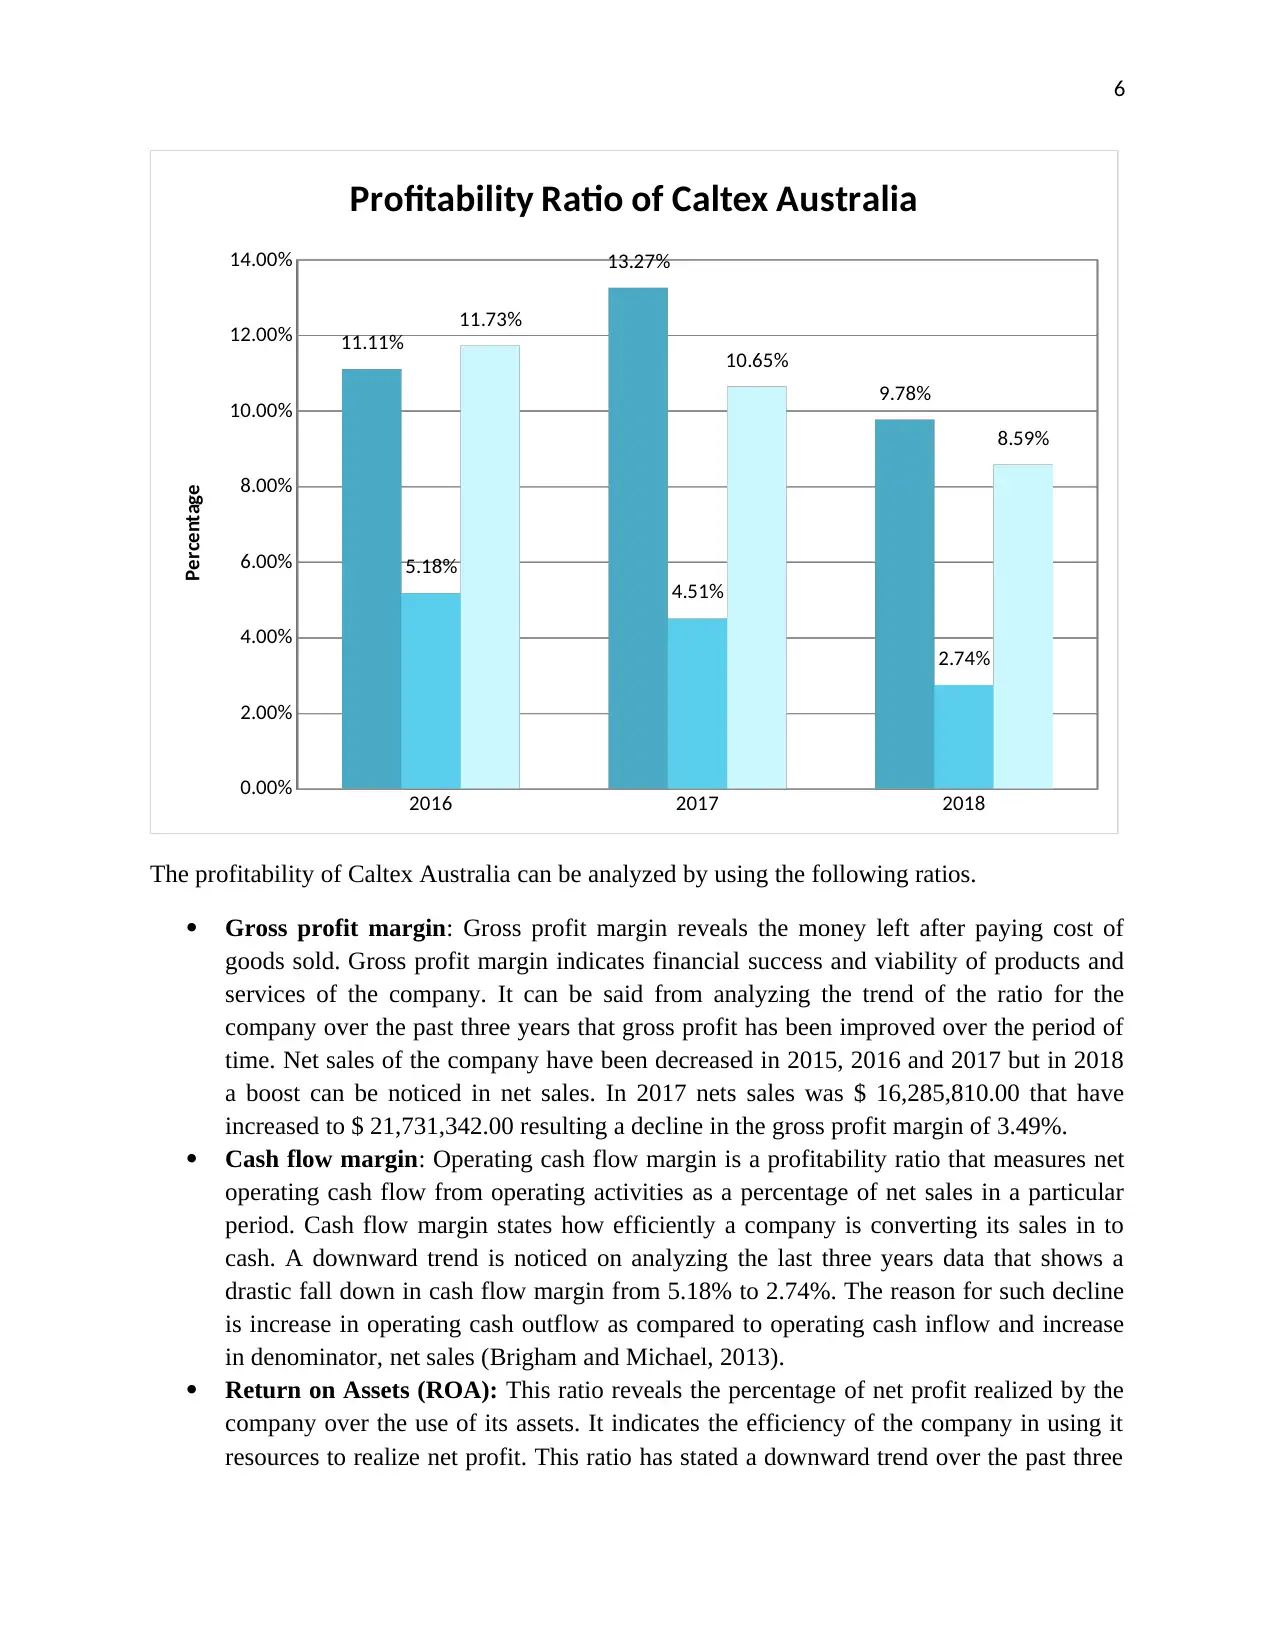
The profitability of Caltex Australia can be analyzed by using the following ratios.
Gross profit margin: Gross profit margin reveals the money left after paying cost of
goods sold. Gross profit margin indicates financial success and viability of products and
services of the company. It can be said from analyzing the trend of the ratio for the
company over the past three years that gross profit has been improved over the period of
time. Net sales of the company have been decreased in 2015, 2016 and 2017 but in 2018
a boost can be noticed in net sales. In 2017 nets sales was $ 16,285,810.00 that have
increased to $ 21,731,342.00 resulting a decline in the gross profit margin of 3.49%.
Cash flow margin: Operating cash flow margin is a profitability ratio that measures net
operating cash flow from operating activities as a percentage of net sales in a particular
period. Cash flow margin states how efficiently a company is converting its sales in to
cash. A downward trend is noticed on analyzing the last three years data that shows a
drastic fall down in cash flow margin from 5.18% to 2.74%. The reason for such decline
is increase in operating cash outflow as compared to operating cash inflow and increase
in denominator, net sales (Brigham and Michael, 2013).
Return on Assets (ROA): This ratio reveals the percentage of net profit realized by the
company over the use of its assets. It indicates the efficiency of the company in using it
resources to realize net profit. This ratio has stated a downward trend over the past three
2016 2017 2018
0.00%
2.00%
4.00%
6.00%
8.00%
10.00%
12.00%
14.00%
11.11%
13.27%
9.78%
5.18%
4.51%
2.74%
11.73%
10.65%
8.59%
Profitability Ratio of Caltex Australia
Percentage
The profitability of Caltex Australia can be analyzed by using the following ratios.
Gross profit margin: Gross profit margin reveals the money left after paying cost of
goods sold. Gross profit margin indicates financial success and viability of products and
services of the company. It can be said from analyzing the trend of the ratio for the
company over the past three years that gross profit has been improved over the period of
time. Net sales of the company have been decreased in 2015, 2016 and 2017 but in 2018
a boost can be noticed in net sales. In 2017 nets sales was $ 16,285,810.00 that have
increased to $ 21,731,342.00 resulting a decline in the gross profit margin of 3.49%.
Cash flow margin: Operating cash flow margin is a profitability ratio that measures net
operating cash flow from operating activities as a percentage of net sales in a particular
period. Cash flow margin states how efficiently a company is converting its sales in to
cash. A downward trend is noticed on analyzing the last three years data that shows a
drastic fall down in cash flow margin from 5.18% to 2.74%. The reason for such decline
is increase in operating cash outflow as compared to operating cash inflow and increase
in denominator, net sales (Brigham and Michael, 2013).
Return on Assets (ROA): This ratio reveals the percentage of net profit realized by the
company over the use of its assets. It indicates the efficiency of the company in using it
resources to realize net profit. This ratio has stated a downward trend over the past three
7
years. Return on assets has been declined from 11.73% to 8.59% that shows company has
not been able to use it resources properly. The reason for the same is decreasing profit
and an increase in net sales in the year 2018 (Damodaran, 2011).
Operating Efficiency Ratio
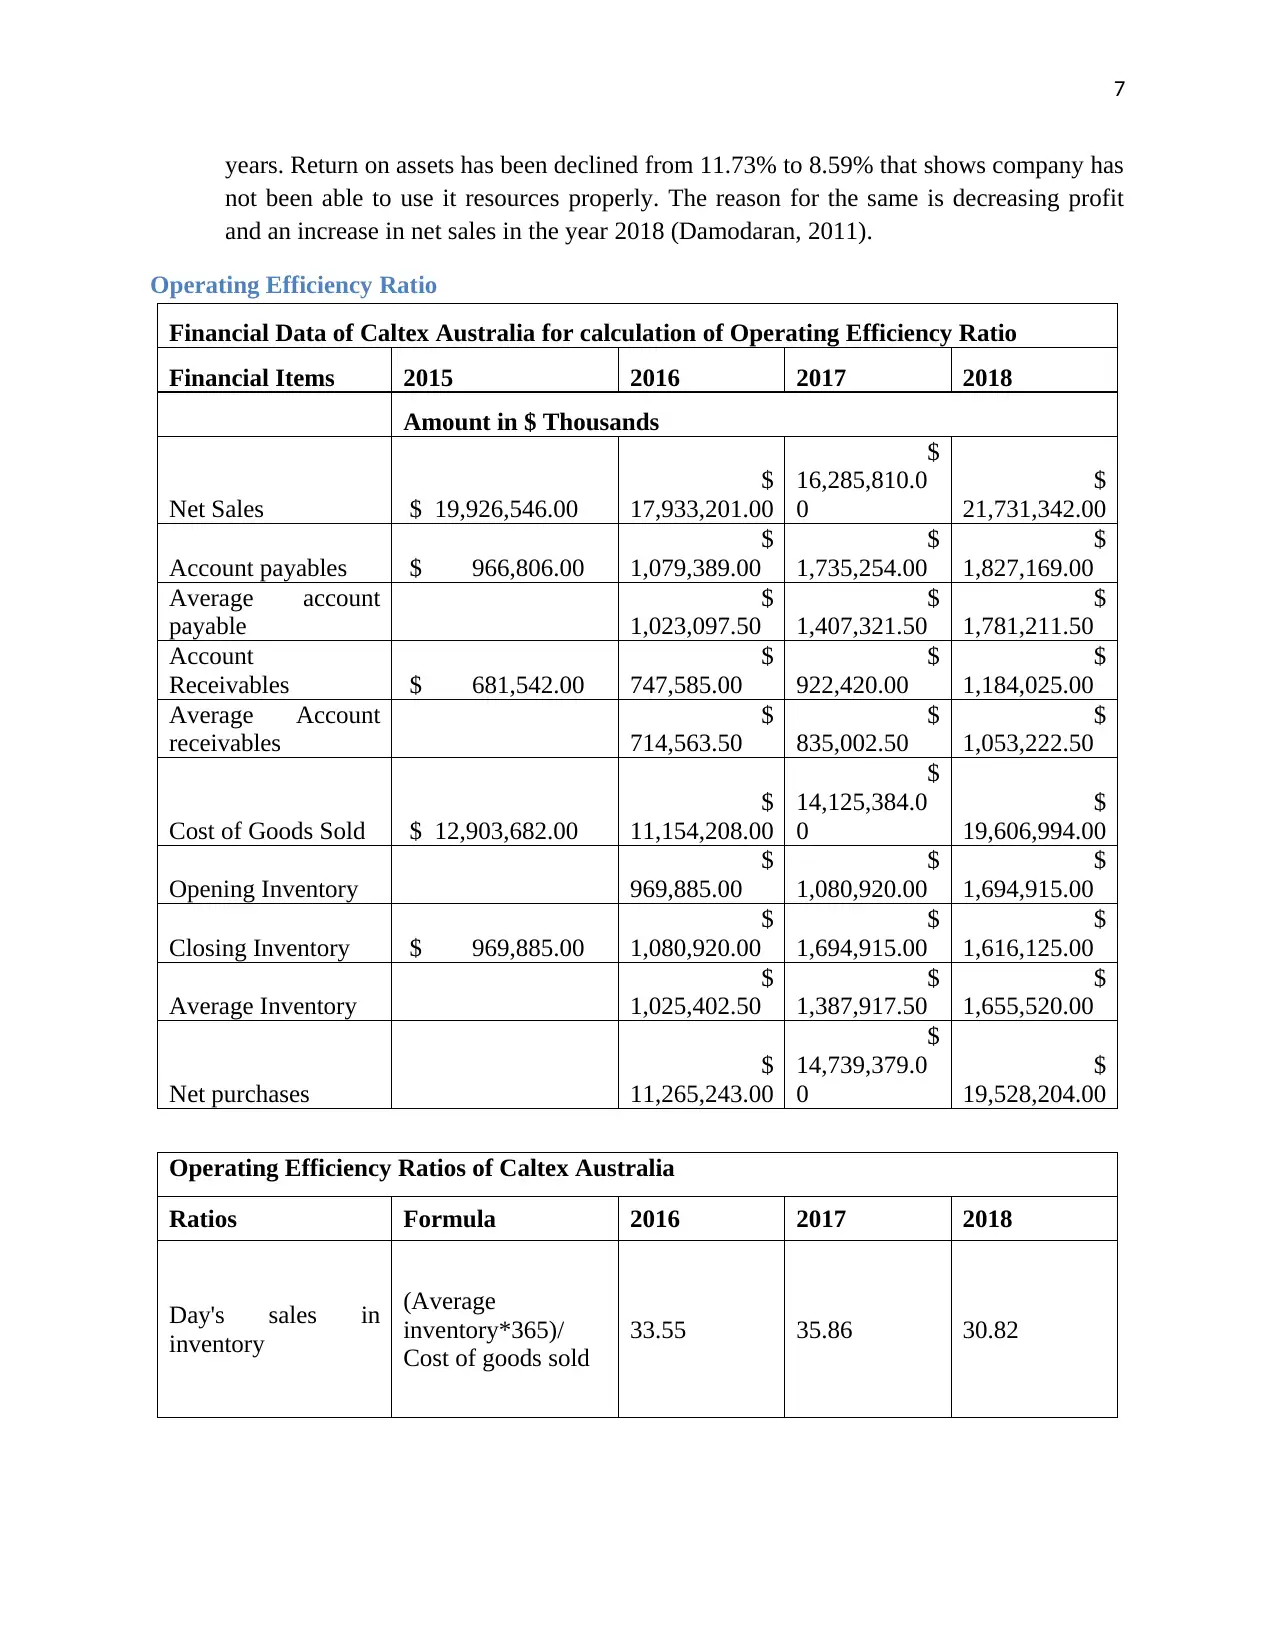
Financial Data of Caltex Australia for calculation of Operating Efficiency Ratio
Financial Items 2015 2016 2017 2018
Amount in $ Thousands
Net Sales $ 19,926,546.00
$
17,933,201.00
$
16,285,810.0
0
$
21,731,342.00
Account payables $ 966,806.00
$
1,079,389.00
$
1,735,254.00
$
1,827,169.00
Average account
payable
$
1,023,097.50
$
1,407,321.50
$
1,781,211.50
Account
Receivables $ 681,542.00
$
747,585.00
$
922,420.00
$
1,184,025.00
Average Account
receivables
$
714,563.50
$
835,002.50
$
1,053,222.50
Cost of Goods Sold $ 12,903,682.00
$
11,154,208.00
$
14,125,384.0
0
$
19,606,994.00
Opening Inventory
$
969,885.00
$
1,080,920.00
$
1,694,915.00
Closing Inventory $ 969,885.00
$
1,080,920.00
$
1,694,915.00
$
1,616,125.00
Average Inventory
$
1,025,402.50
$
1,387,917.50
$
1,655,520.00
Net purchases
$
11,265,243.00
$
14,739,379.0
0
$
19,528,204.00
Operating Efficiency Ratios of Caltex Australia
Ratios Formula 2016 2017 2018
Day's sales in
inventory
(Average
inventory*365)/
Cost of goods sold
33.55 35.86 30.82
years. Return on assets has been declined from 11.73% to 8.59% that shows company has
not been able to use it resources properly. The reason for the same is decreasing profit
and an increase in net sales in the year 2018 (Damodaran, 2011).
Operating Efficiency Ratio
Financial Data of Caltex Australia for calculation of Operating Efficiency Ratio
Financial Items 2015 2016 2017 2018
Amount in $ Thousands
Net Sales $ 19,926,546.00
$
17,933,201.00
$
16,285,810.0
0
$
21,731,342.00
Account payables $ 966,806.00
$
1,079,389.00
$
1,735,254.00
$
1,827,169.00
Average account
payable
$
1,023,097.50
$
1,407,321.50
$
1,781,211.50
Account
Receivables $ 681,542.00
$
747,585.00
$
922,420.00
$
1,184,025.00
Average Account
receivables
$
714,563.50
$
835,002.50
$
1,053,222.50
Cost of Goods Sold $ 12,903,682.00
$
11,154,208.00
$
14,125,384.0
0
$
19,606,994.00
Opening Inventory
$
969,885.00
$
1,080,920.00
$
1,694,915.00
Closing Inventory $ 969,885.00
$
1,080,920.00
$
1,694,915.00
$
1,616,125.00
Average Inventory
$
1,025,402.50
$
1,387,917.50
$
1,655,520.00
Net purchases
$
11,265,243.00
$
14,739,379.0
0
$
19,528,204.00
Operating Efficiency Ratios of Caltex Australia
Ratios Formula 2016 2017 2018
Day's sales in
inventory
(Average
inventory*365)/
Cost of goods sold
33.55 35.86 30.82
Paraphrase This Document
Need a fresh take? Get an instant paraphrase of this document with our AI Paraphraser
8
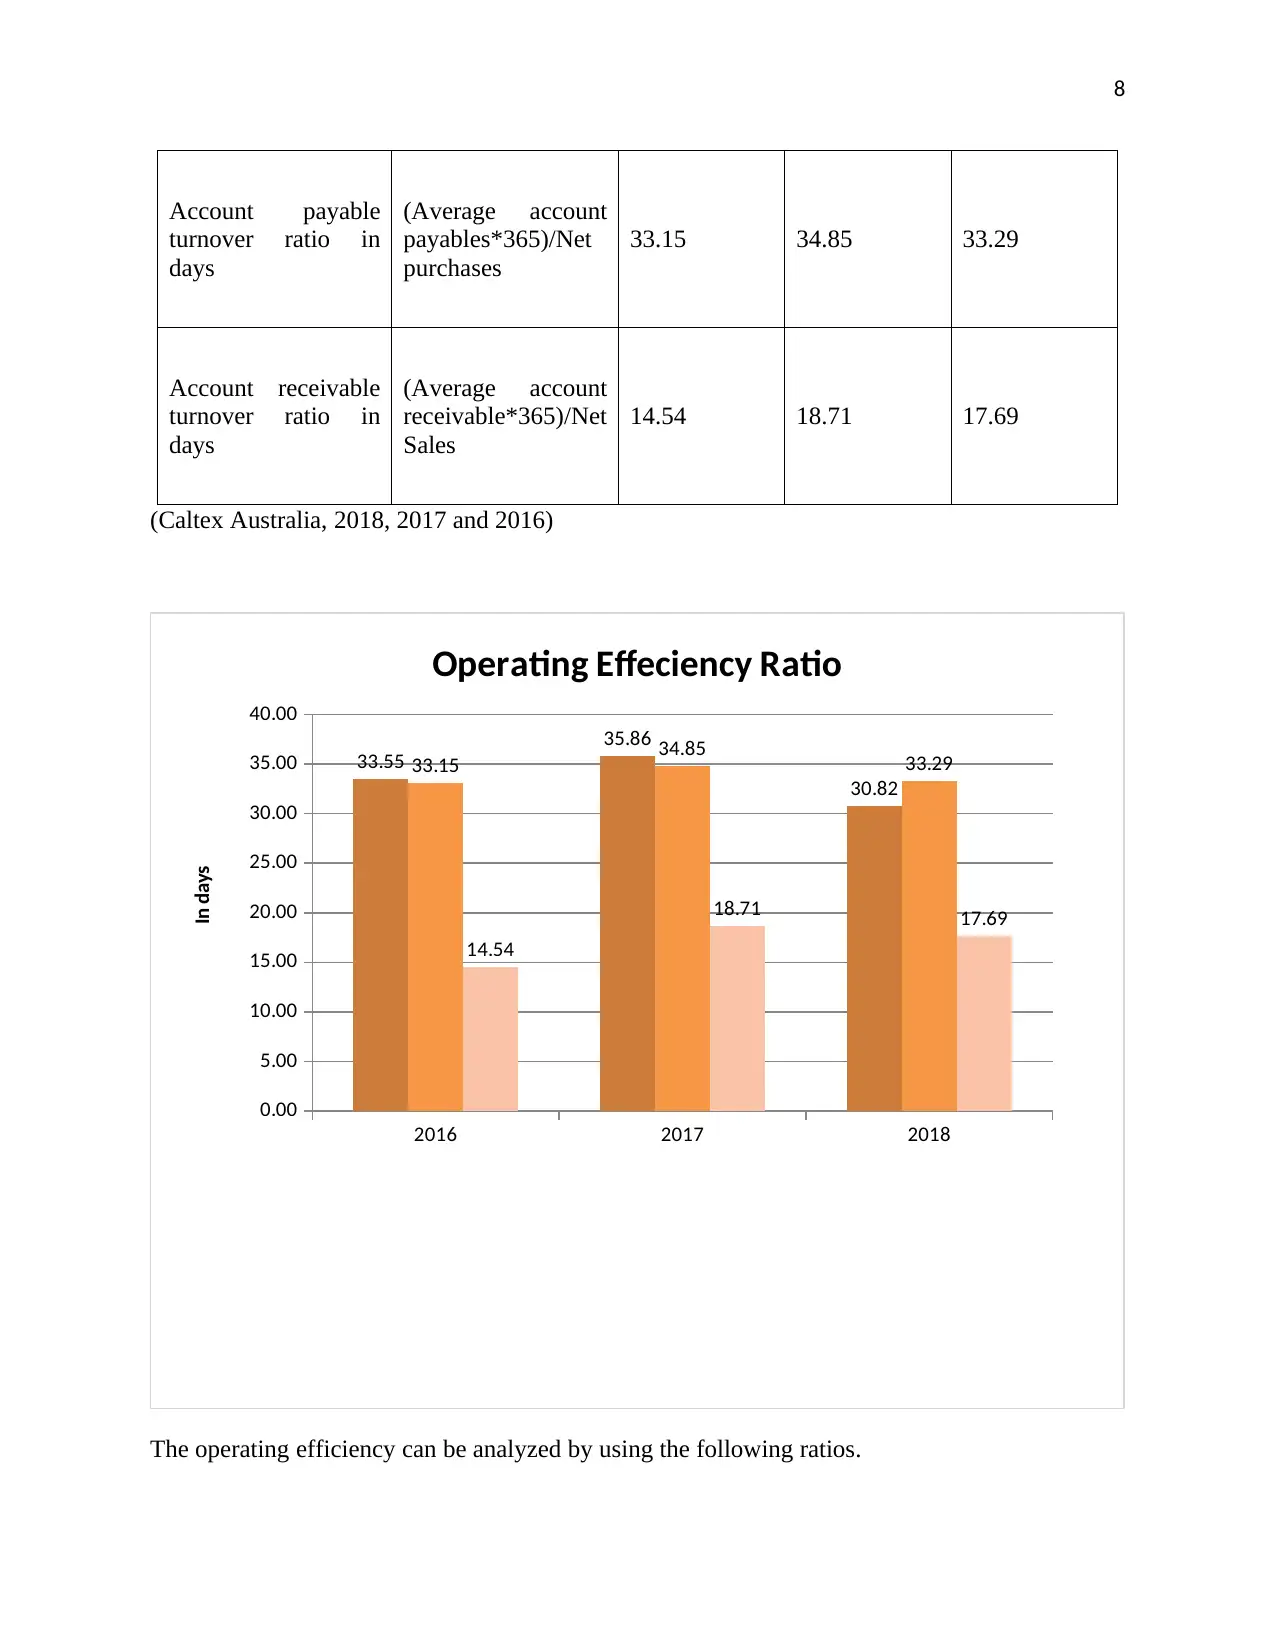
Account payable
turnover ratio in
days
(Average account
payables*365)/Net
purchases
33.15 34.85 33.29
Account receivable
turnover ratio in
days
(Average account
receivable*365)/Net
Sales
14.54 18.71 17.69
(Caltex Australia, 2018, 2017 and 2016)
2016 2017 2018
0.00
5.00
10.00
15.00
20.00
25.00
30.00
35.00
40.00
33.55
35.86
30.82
33.15 34.85 33.29
14.54
18.71 17.69
Operating Effeciency Ratio
In days
The operating efficiency can be analyzed by using the following ratios.
9
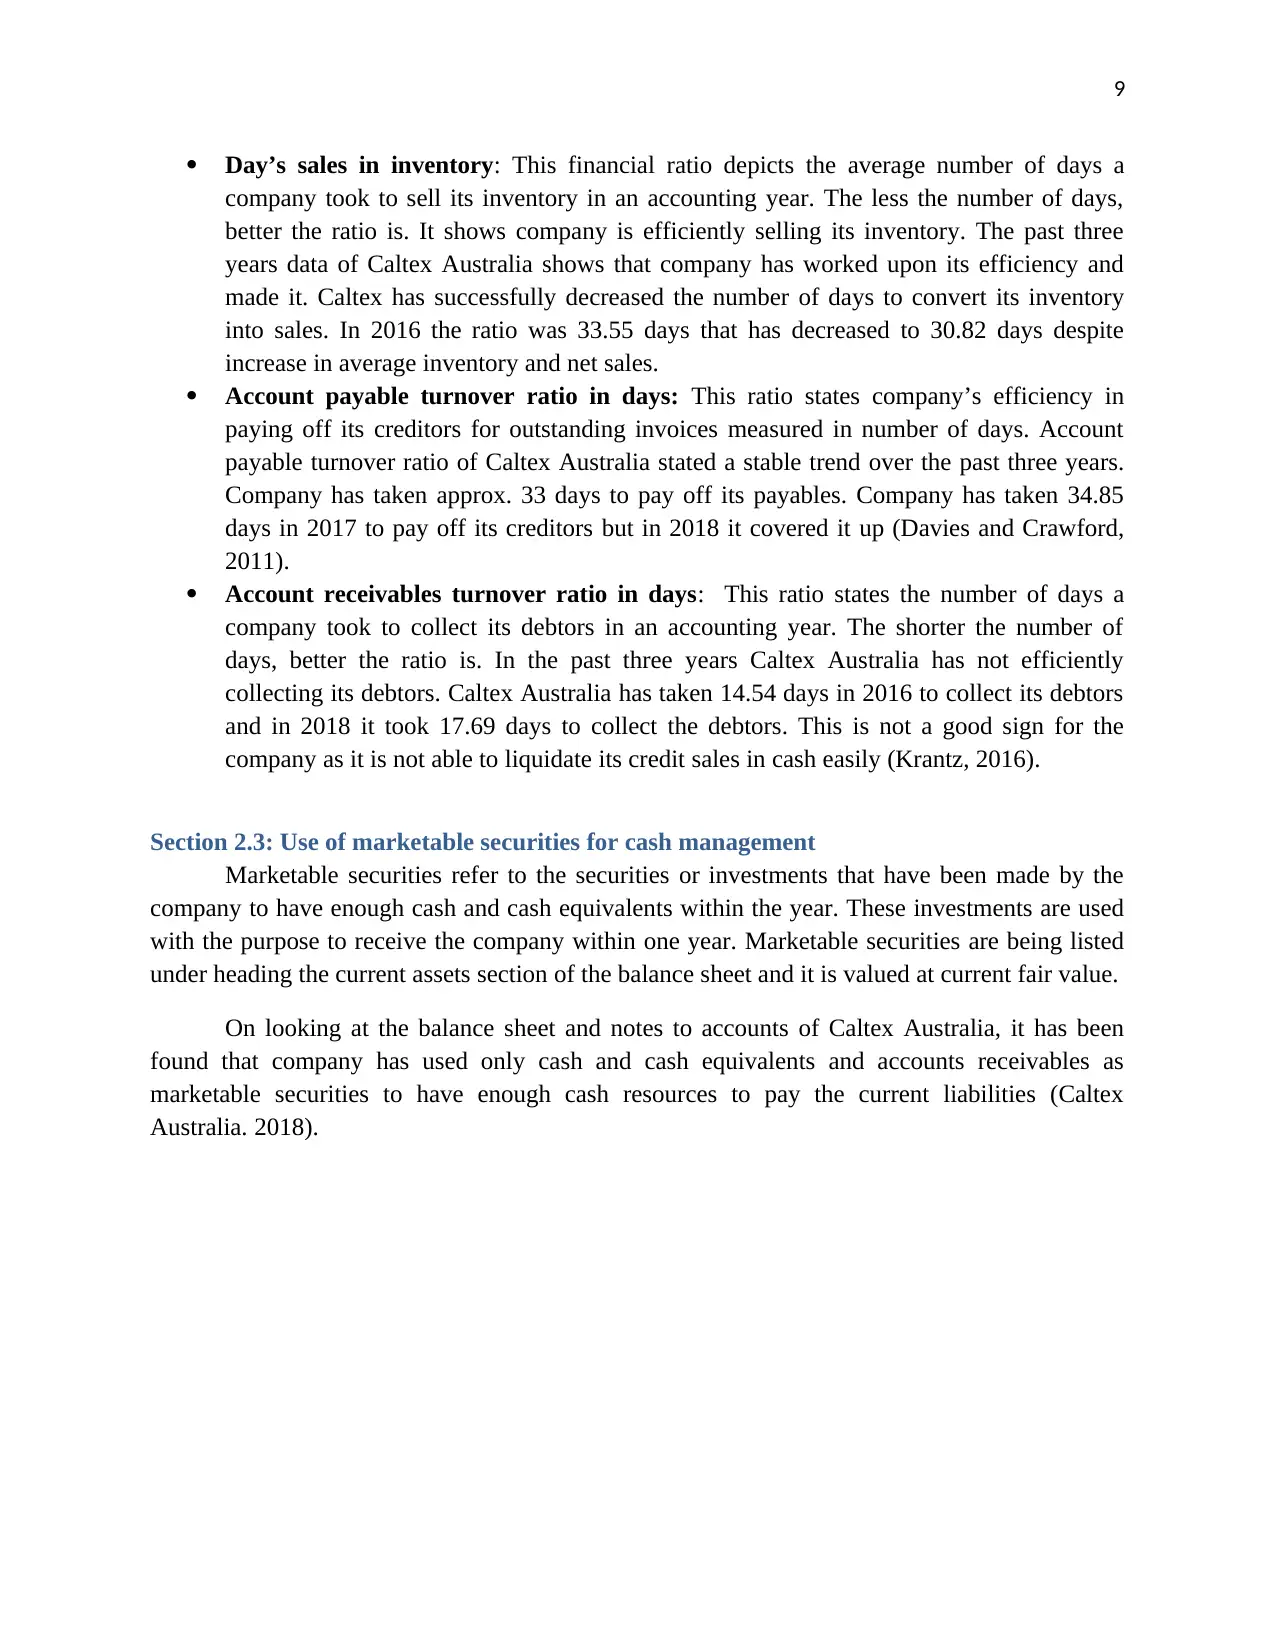
Day’s sales in inventory: This financial ratio depicts the average number of days a
company took to sell its inventory in an accounting year. The less the number of days,
better the ratio is. It shows company is efficiently selling its inventory. The past three
years data of Caltex Australia shows that company has worked upon its efficiency and
made it. Caltex has successfully decreased the number of days to convert its inventory
into sales. In 2016 the ratio was 33.55 days that has decreased to 30.82 days despite
increase in average inventory and net sales.
Account payable turnover ratio in days: This ratio states company’s efficiency in
paying off its creditors for outstanding invoices measured in number of days. Account
payable turnover ratio of Caltex Australia stated a stable trend over the past three years.
Company has taken approx. 33 days to pay off its payables. Company has taken 34.85
days in 2017 to pay off its creditors but in 2018 it covered it up (Davies and Crawford,
2011).
Account receivables turnover ratio in days: This ratio states the number of days a
company took to collect its debtors in an accounting year. The shorter the number of
days, better the ratio is. In the past three years Caltex Australia has not efficiently
collecting its debtors. Caltex Australia has taken 14.54 days in 2016 to collect its debtors
and in 2018 it took 17.69 days to collect the debtors. This is not a good sign for the
company as it is not able to liquidate its credit sales in cash easily (Krantz, 2016).
Section 2.3: Use of marketable securities for cash management
Marketable securities refer to the securities or investments that have been made by the
company to have enough cash and cash equivalents within the year. These investments are used
with the purpose to receive the company within one year. Marketable securities are being listed
under heading the current assets section of the balance sheet and it is valued at current fair value.
On looking at the balance sheet and notes to accounts of Caltex Australia, it has been
found that company has used only cash and cash equivalents and accounts receivables as
marketable securities to have enough cash resources to pay the current liabilities (Caltex
Australia. 2018).

10
Section 2.4: Sensitivity Analysis through using the given data
Life of project consider by the company 4 Years
Cost of Equipment 2,000,000.00$
Reisdual Value 200,000.00$
Depreciation Method Straight Line
Life of Equipment 4 years
Depreciation of Equipment per year 450,000.00$
Working Capital 600,000.00$
Recovery of working capital 600,000.00$
Selling Units per year 300000 per year
Selling Price 20.00$
Variable Cost 12.00$
Fixed Cost 300,000.00$
Discount Rate 10%
Tax Rate 30%
Information given in the question
Secure Best Marks with AI Grader
Need help grading? Try our AI Grader for instant feedback on your assignments.

11
0 1 2 3 4
Cash Inflows
Units sold 300000 300000 300000 300000
Selling price 20.00$ 20.00$ 20.00$ 20.00$
Net Cash Inflows 6,000,000.00$ 6,000,000.00$ 6,000,000.00$ 6,000,000.00$
Cash Outflows
Variable Cost 3,600,000.00$ 3,600,000.00$ 3,600,000.00$ 3,600,000.00$
Fixed Cost 300,000.00$ 300,000.00$ 300,000.00$ 300,000.00$
Depreciation 450,000.00$ 450,000.00$ 450,000.00$ 450,000.00$
Total Cash outflows 4,350,000.00$ 4,350,000.00$ 4,350,000.00$ 4,350,000.00$
Cash flows before tax 1,650,000.00$ 1,650,000.00$ 1,650,000.00$ 1,650,000.00$
Less: Tax @ 30% 495,000.00$ 495,000.00$ 495,000.00$ 495,000.00$
Cash Flows after tax 1,155,000.00$ 1,155,000.00$ 1,155,000.00$ 1,155,000.00$
Add: Depreciation 450,000.00$ 450,000.00$ 450,000.00$ 450,000.00$
Cash Flows before
depreciation after tax 1,605,000.00$ 1,605,000.00$ 1,605,000.00$ 1,605,000.00$
Initial Equiment Cost (2,000,000.00)$
Salvage Value 200,000.00$
Working Capital
Initial Requirement (600,000.00)$
Recovery 600,000.00$
Net Cash Flows (2,600,000.00)$ 1,605,000.00$ 1,605,000.00$ 1,605,000.00$ 2,405,000.00$
PVF @ 10% 1.000 0.909 0.826 0.751 0.683
(2,600,000.00)$ 1,459,090.91$ 1,326,446.28$ 1,205,860.26$ 1,642,647.36$
Net Present Value 3,034,044.81$
Cash Flows during the life of the project in normal Case
Years
Particulars
(Reilly and Brown, 2011)

12
0 1 2 3 4
Cash Inflows
Selling Units 270000 270000 270000 270000
Selling price 20.00$ 20.00$ 20.00$ 20.00$
Net Cash Inflows 5,400,000.00$ 5,400,000.00$ 5,400,000.00$ 5,400,000.00$
Cash Outflows
Variable Cost 3,240,000.00$ 3,240,000.00$ 3,240,000.00$ 3,240,000.00$
Fixed Cost 300,000.00$ 300,000.00$ 300,000.00$ 300,000.00$
Depreciation 450,000.00$ 450,000.00$ 450,000.00$ 450,000.00$
Total Cash outflows 3,990,000.00$ 3,990,000.00$ 3,990,000.00$ 3,990,000.00$
Cash flows before tax 1,410,000.00$ 1,410,000.00$ 1,410,000.00$ 1,410,000.00$
Less: Tax @ 30% 423,000.00$ 423,000.00$ 423,000.00$ 423,000.00$
Cash Flows after tax 987,000.00$ 987,000.00$ 987,000.00$ 987,000.00$
Add: Depreciation 450,000.00$ 450,000.00$ 450,000.00$ 450,000.00$
Cash Flows before
depreciation after 1,437,000.00$ 1,437,000.00$ 1,437,000.00$ 1,437,000.00$
Initial Equiment Cost (2,000,000.00)$
Salvage Value 200,000.00$
Working Capital
Initial Requirement (600,000.00)$
Recovery 600,000.00$
Net Cash Flows (2,600,000.00)$ 1,437,000.00$ 1,437,000.00$ 1,437,000.00$ 2,237,000.00$
PVF @ 10% 1.000 0.909 0.826 0.751 0.683
(2,600,000.00)$ 1,306,363.64$ 1,187,603.31$ 1,079,639.37$ 1,527,901.10$
Net Present Value 2,501,507.41$
Particulars Years
Statement of Cash flows when Unit sales decrease by 10%
(Schlichting, 2013)

13
0 1 2 3 4
Cash Inflows
Selling Units 300000 300000 300000 300000
Selling price 18.00$ 18.00$ 18.00$ 18.00$
Net Cash Inflows 5,400,000.00$ 5,400,000.00$ 5,400,000.00$ 5,400,000.00$
Cash Outflows
Variable Cost 3,600,000.00$ 3,600,000.00$ 3,600,000.00$ 3,600,000.00$
Fixed Cost 300,000.00$ 300,000.00$ 300,000.00$ 300,000.00$
Depreciation 450,000.00$ 450,000.00$ 450,000.00$ 450,000.00$
Total Cash outflows 4,350,000.00$ 4,350,000.00$ 4,350,000.00$ 4,350,000.00$
Cash flows before tax 1,050,000.00$ 1,050,000.00$ 1,050,000.00$ 1,050,000.00$
Less: Tax @ 30% 315,000.00$ 315,000.00$ 315,000.00$ 315,000.00$
Cash Flows after tax 735,000.00$ 735,000.00$ 735,000.00$ 735,000.00$
Add: Depreciation 450,000.00$ 450,000.00$ 450,000.00$ 450,000.00$
Cash Flows before
depreciation after 1,185,000.00$ 1,185,000.00$ 1,185,000.00$ 1,185,000.00$
Initial Equiment Cost (2,000,000.00)$
Salvage Value 200,000.00$
Working Capital
Initial Requirement (600,000.00)$
Recovery 600,000.00$
Net Cash Flows (2,600,000.00)$ 1,185,000.00$ 1,185,000.00$ 1,185,000.00$ 1,985,000.00$
PVF @ 10% 1.000 0.909 0.826 0.751 0.683
(2,600,000.00)$ 1,077,272.73$ 979,338.84$ 890,308.04$ 1,355,781.71$
Net Present Value 1,702,701.32$
Particulars Years
Statement of Cash flows when Price per unit decreases by 10%
Paraphrase This Document
Need a fresh take? Get an instant paraphrase of this document with our AI Paraphraser

14
0 1 2 3 4
Cash Inflows
Selling Units 300000 300000 300000 300000
Selling price 18.00$ 18.00$ 18.00$ 18.00$
Net Cash Inflows 5,400,000.00$ 5,400,000.00$ 5,400,000.00$ 5,400,000.00$
Cash Outflows
Variable Cost 3,960,000.00$ 3,960,000.00$ 3,960,000.00$ 3,960,000.00$
Fixed Cost 300,000.00$ 300,000.00$ 300,000.00$ 300,000.00$
Depreciation 450,000.00$ 450,000.00$ 450,000.00$ 450,000.00$
Total Cash outflows 4,710,000.00$ 4,710,000.00$ 4,710,000.00$ 4,710,000.00$
Cash flows before tax 690,000.00$ 690,000.00$ 690,000.00$ 690,000.00$
Less: Tax @ 30% 207,000.00$ 207,000.00$ 207,000.00$ 207,000.00$
Cash Flows after tax 483,000.00$ 483,000.00$ 483,000.00$ 483,000.00$
Add: Depreciation 450,000.00$ 450,000.00$ 450,000.00$ 450,000.00$
Cash Flows before
depreciation after 933,000.00$ 933,000.00$ 933,000.00$ 933,000.00$
Initial Equiment Cost (2,000,000.00)$
Salvage Value 200,000.00$
Working Capital
Initial Requirement (600,000.00)$
Recovery 600,000.00$
Net Cash Flows (2,600,000.00)$ 933,000.00$ 933,000.00$ 933,000.00$ 1,733,000.00$
PVF @ 10% 1.000 0.909 0.826 0.751 0.683
(2,600,000.00)$ 848,181.82$ 771,074.38$ 700,976.71$ 1,183,662.32$
Net Present Value 903,895.23$
Particulars Years
Statement of Cash flows when Variable cost per unit increases 10%
15
0 1 2 3 4
Cash Inflows
Selling Units 300000 300000 300000 300000
Selling price 18.00$ 18.00$ 18.00$ 18.00$
Net Cash Inflows 5,400,000.00$ 5,400,000.00$ 5,400,000.00$ 5,400,000.00$
Cash Outflows
Variable Cost 3,960,000.00$ 3,960,000.00$ 3,960,000.00$ 3,960,000.00$
Fixed Cost 330,000.00$ 330,000.00$ 330,000.00$ 330,000.00$
Depreciation 450,000.00$ 450,000.00$ 450,000.00$ 450,000.00$
Total Cash outflows 4,740,000.00$ 4,740,000.00$ 4,740,000.00$ 4,740,000.00$
Cash flows before tax 660,000.00$ 660,000.00$ 660,000.00$ 660,000.00$
Less: Tax @ 30% 198,000.00$ 198,000.00$ 198,000.00$ 198,000.00$
Cash Flows after tax 462,000.00$ 462,000.00$ 462,000.00$ 462,000.00$
Add: Depreciation 450,000.00$ 450,000.00$ 450,000.00$ 450,000.00$
Cash Flows before
depreciation after 912,000.00$ 912,000.00$ 912,000.00$ 912,000.00$
Initial Equiment Cost (2,000,000.00)$
Salvage Value 200,000.00$
Working Capital
Initial Requirement (600,000.00)$
Recovery 600,000.00$
Net Cash Flows (2,600,000.00)$ 912,000.00$ 912,000.00$ 912,000.00$ 1,712,000.00$
PVF @ 10% 1.000 0.909 0.826 0.751 0.683
(2,600,000.00)$ 829,090.91$ 753,719.01$ 685,199.10$ 1,169,319.04$
Net Present Value 837,328.05$
Particulars Years
Statement of Cash flows when Cash fixed cost per year increases by 10%
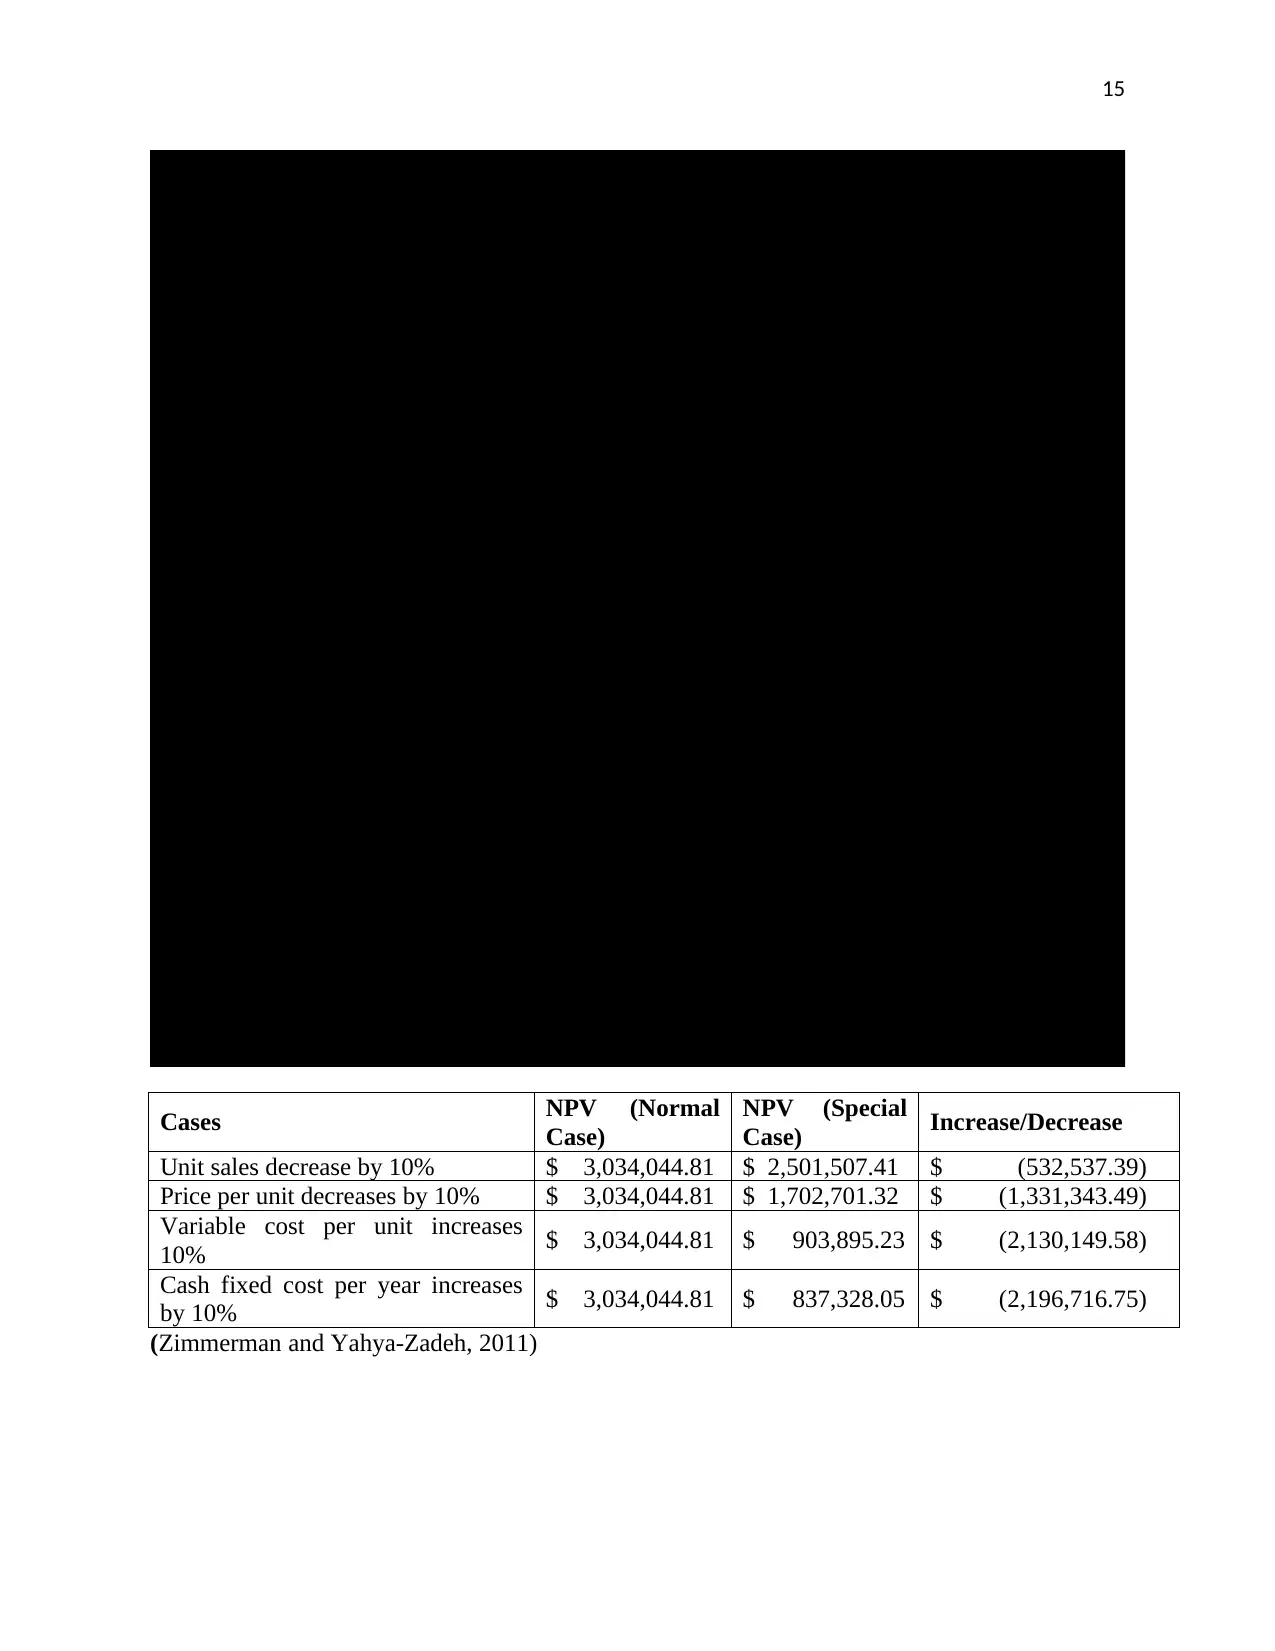
Cases NPV (Normal
Case)
NPV (Special
Case) Increase/Decrease
Unit sales decrease by 10% $ 3,034,044.81 $ 2,501,507.41 $ (532,537.39)
Price per unit decreases by 10% $ 3,034,044.81 $ 1,702,701.32 $ (1,331,343.49)
Variable cost per unit increases
10% $ 3,034,044.81 $ 903,895.23 $ (2,130,149.58)
Cash fixed cost per year increases
by 10% $ 3,034,044.81 $ 837,328.05 $ (2,196,716.75)
(Zimmerman and Yahya-Zadeh, 2011)
0 1 2 3 4
Cash Inflows
Selling Units 300000 300000 300000 300000
Selling price 18.00$ 18.00$ 18.00$ 18.00$
Net Cash Inflows 5,400,000.00$ 5,400,000.00$ 5,400,000.00$ 5,400,000.00$
Cash Outflows
Variable Cost 3,960,000.00$ 3,960,000.00$ 3,960,000.00$ 3,960,000.00$
Fixed Cost 330,000.00$ 330,000.00$ 330,000.00$ 330,000.00$
Depreciation 450,000.00$ 450,000.00$ 450,000.00$ 450,000.00$
Total Cash outflows 4,740,000.00$ 4,740,000.00$ 4,740,000.00$ 4,740,000.00$
Cash flows before tax 660,000.00$ 660,000.00$ 660,000.00$ 660,000.00$
Less: Tax @ 30% 198,000.00$ 198,000.00$ 198,000.00$ 198,000.00$
Cash Flows after tax 462,000.00$ 462,000.00$ 462,000.00$ 462,000.00$
Add: Depreciation 450,000.00$ 450,000.00$ 450,000.00$ 450,000.00$
Cash Flows before
depreciation after 912,000.00$ 912,000.00$ 912,000.00$ 912,000.00$
Initial Equiment Cost (2,000,000.00)$
Salvage Value 200,000.00$
Working Capital
Initial Requirement (600,000.00)$
Recovery 600,000.00$
Net Cash Flows (2,600,000.00)$ 912,000.00$ 912,000.00$ 912,000.00$ 1,712,000.00$
PVF @ 10% 1.000 0.909 0.826 0.751 0.683
(2,600,000.00)$ 829,090.91$ 753,719.01$ 685,199.10$ 1,169,319.04$
Net Present Value 837,328.05$
Particulars Years
Statement of Cash flows when Cash fixed cost per year increases by 10%
Cases NPV (Normal
Case)
NPV (Special
Case) Increase/Decrease
Unit sales decrease by 10% $ 3,034,044.81 $ 2,501,507.41 $ (532,537.39)
Price per unit decreases by 10% $ 3,034,044.81 $ 1,702,701.32 $ (1,331,343.49)
Variable cost per unit increases
10% $ 3,034,044.81 $ 903,895.23 $ (2,130,149.58)
Cash fixed cost per year increases
by 10% $ 3,034,044.81 $ 837,328.05 $ (2,196,716.75)
(Zimmerman and Yahya-Zadeh, 2011)
16
Section 2.5: Identification and discussion on systematic risk and Unsystematic risk that
impacts the performance of Caltex Australia
Systematic Risks associated with Caltex Australia
Systematic risks are the risk that is associated with the company due to fluctuations in the
overall market segment. It is not possible to be diversified as it impacts the entire market
segment not only just a particular company. The systematic risks associated with Caltex
Australia can be categorized as follows:
Commodity Price Risk
The company performance can be significantly impacted by the fluctuations in the prices
of crude oil by influencing its sales and purchase financial transactions. The changes in the price
of crude oil can have a large effect on the earning potential and cash flows of the company. The
company intends to manage this risk by the use of derivative contracts in relation to both crude
and finished products (Caltex Australia, 2018).
Foreign Exchange Risk
The fluctuations in the foreign currencies also have a major impact on the financial
performance the company. This is because it tends to purchase crude products in the US dollar
and sells it in the Australian dollar. Therefore, the changes in the exchange rate between the US
and Australian dollar leads to influencing the earning potential of the company. Caltex Australia
has adopted the use of foreign exchange contracts such as forwards or swaps for mitigating the
exposure for foreign currency (Caltex Australia, 2018).
Interest Rate Risk
The company incorporates the use of debt in its capital structure and therefore is
associated with the risk of not able to meet its interest obligations on its long-term loans. This is
because fluctuations in the market can results in causing changes in the interest rates and thus it
may result for the company to not able to meet its interest obligations in a regular manner. The
company manages the exposure to interest rate risk by the use of derivative instruments (Caltex
Australia: Annual Report, 2018).
Unsystematic Risks associated with the Caltex Australia
On the other hand, the unsystematic risks associated with Caltex Australia are
categorized as follows:
Operational Risk
The nature of business operations of Caltex Australia are associated with high risk of
causing injury to people or property and also leading to incurring financial loss for the company.
As such, the company has implemented in place and adequate system of management to prevent
Secure Best Marks with AI Grader
Need help grading? Try our AI Grader for instant feedback on your assignments.
17
the occurrence of risks related to safety or health. The senior management of the company
regularly reviews the business operations for identifying any type of operational risk and
mitigating the risks in advance (Caltex Australia, 2018).
Competitive Risk
Caltex Australia conducts its operations in a highly competitive market of Australia and
therefore its future growth can be largely impacted by the increasing competition which can lead
to reduction in its sales figures. As such, the company has integrated the use of business
strategies such as reduction in cost and enhancing the operational efficiency for promoting its
sustainable performance.
Environmental Risks
The major operations of the company consist of importing; storing, transporting and
selling petroleum based products and thus is highly exposed to the environmental risk associated
with spillovers. The occurrence of such type of incidents can results in disrupting the
performance of the company in the long-term. The company manages exposure to this risk by
implementation of strict operating standards and policies that ensures its compliance with the
environmental laws and regulations (Caltex Australia, 2018).
Credit Risk
The company is also associated with the risk of incurring financial losses due to failure of its
counterparties to meet their financial obligations. As such, it has implemented a credit policy for
managing its credit risk through regularly reviewing the credit quality of its customers. It
conducts its financial transactions with large number of customers for reducing the cruet risk.
Regulatory Risk
The company conducts its business activities in a highly regulated environment and
therefore it is very essential for complying with all the relevant laws in an effective manner to
minimize the material impact on its operations due to non-complying with adequate laws and
government policies. It proactively manages its regulatory risks through promoting its
engagement with regulatory bodies and also ensuring it’s complying with all the legal laws and
standards (Caltex Australia: Annual Report, 2018).
Section 2.6: Calculation of dividend payout of Caltex Australia for last three years and
interpretation of dividend policy used by Caltex
Dividend Payout Ratio of Caltex Australia
Dividend payout ratio of Caltex Australia for last three years
Items 2016 2017 2018
18
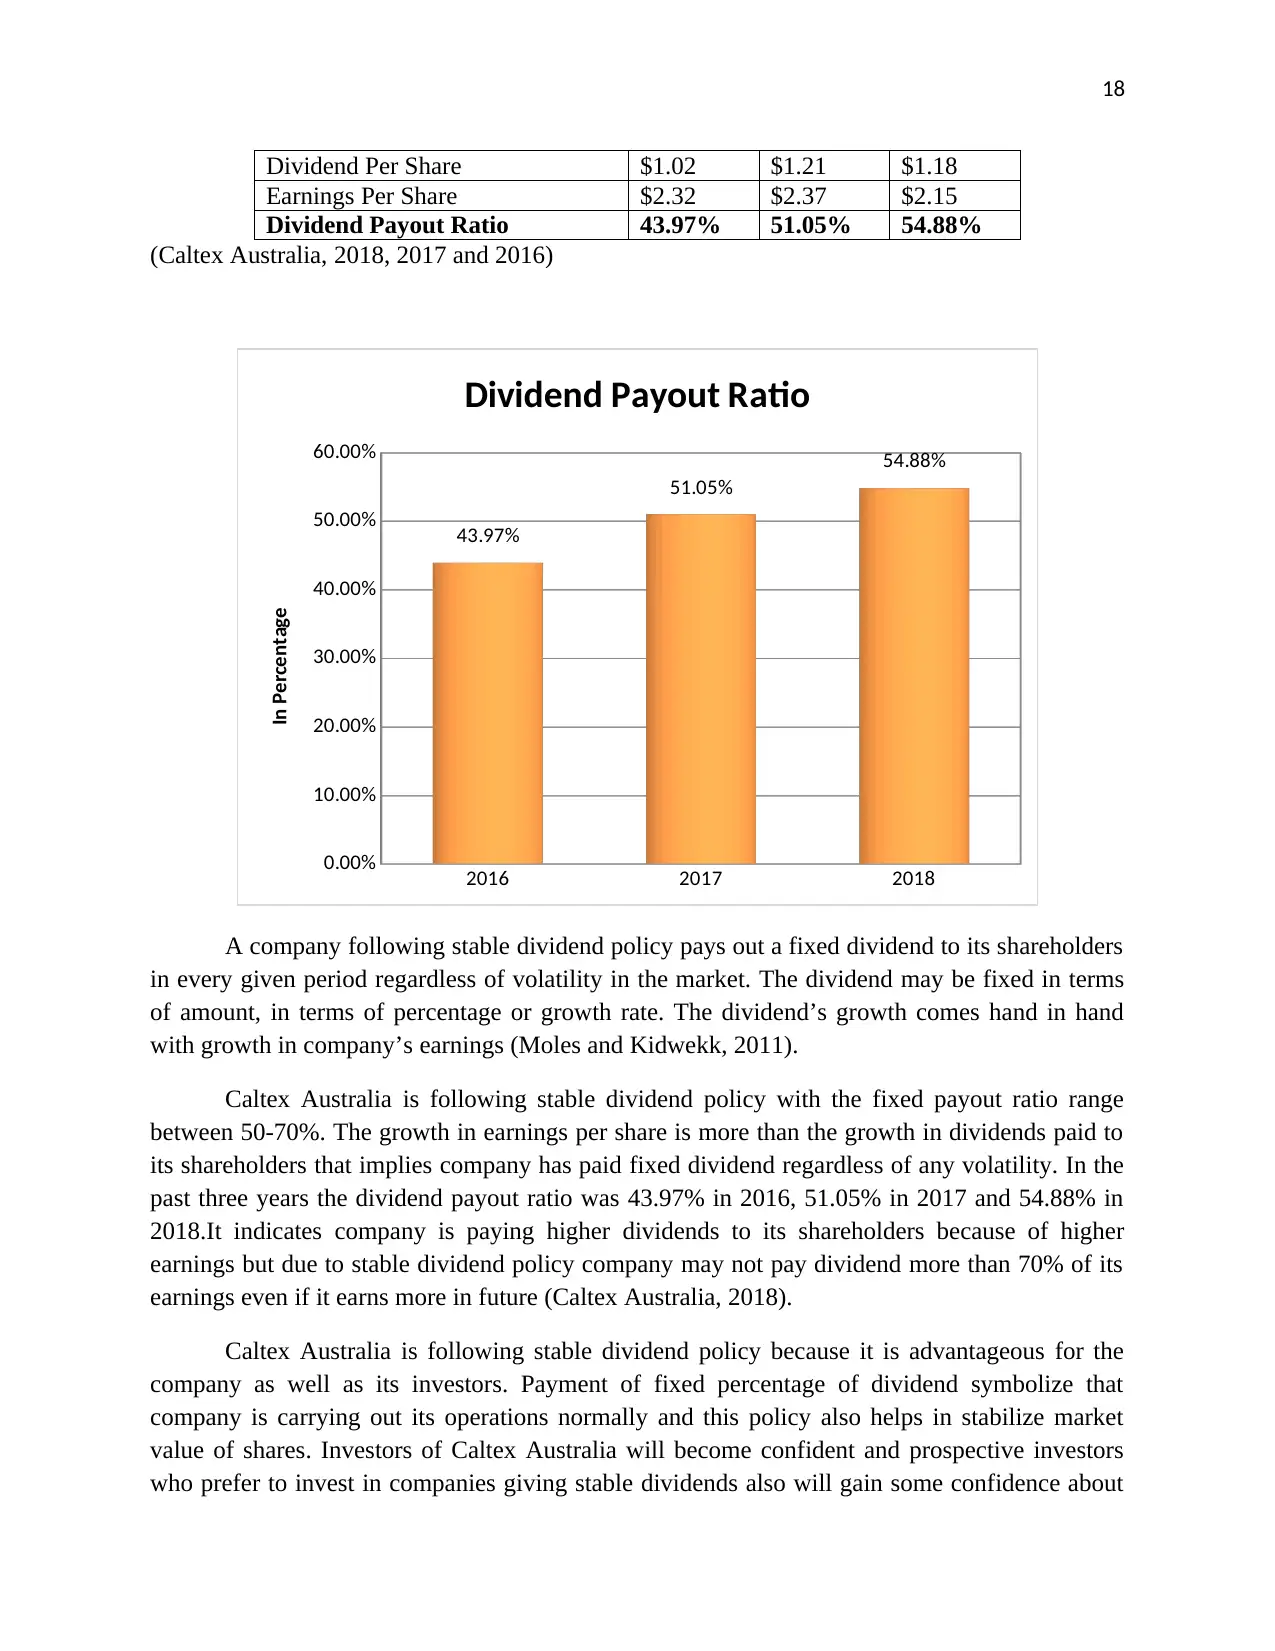
Dividend Per Share $1.02 $1.21 $1.18
Earnings Per Share $2.32 $2.37 $2.15
Dividend Payout Ratio 43.97% 51.05% 54.88%
(Caltex Australia, 2018, 2017 and 2016)
2016 2017 2018
0.00%
10.00%
20.00%
30.00%
40.00%
50.00%
60.00%
43.97%
51.05%
54.88%
Dividend Payout Ratio
In Percentage
A company following stable dividend policy pays out a fixed dividend to its shareholders
in every given period regardless of volatility in the market. The dividend may be fixed in terms
of amount, in terms of percentage or growth rate. The dividend’s growth comes hand in hand
with growth in company’s earnings (Moles and Kidwekk, 2011).
Caltex Australia is following stable dividend policy with the fixed payout ratio range
between 50-70%. The growth in earnings per share is more than the growth in dividends paid to
its shareholders that implies company has paid fixed dividend regardless of any volatility. In the
past three years the dividend payout ratio was 43.97% in 2016, 51.05% in 2017 and 54.88% in
2018.It indicates company is paying higher dividends to its shareholders because of higher
earnings but due to stable dividend policy company may not pay dividend more than 70% of its
earnings even if it earns more in future (Caltex Australia, 2018).
Caltex Australia is following stable dividend policy because it is advantageous for the
company as well as its investors. Payment of fixed percentage of dividend symbolize that
company is carrying out its operations normally and this policy also helps in stabilize market
value of shares. Investors of Caltex Australia will become confident and prospective investors
who prefer to invest in companies giving stable dividends also will gain some confidence about
19
the company. The stable dividend becomes source of income to meet daily expenses for the
investors who invested in Caltex Australia to earn. Stable dividend policy will help Caltex
Australia in improving its credit standing and make financing easy for it (Moles and Kidwekk,
2011).
Section III: Letter of Recommendation to the client
To
Institutional investor (Name)
On the basis of examination of the company performance during the three years from
2016 to 2018, it is highly recommended not to make the investment in Caltex Australia. Caltex
Australia is well company that deals in supply for petroleum products and other related products
to the retailers and wholesalers of Australia. Caltex Australia is facing many global and
economic issues to rapidly increasing fuel prices and demand in Australia and other countries in
which Caltex provide its services. Due to increase in price there is very impact on the
performance of the company during the three years of operations. The financial performance of
Caltex Australia has been judged through calculating and interpreting profitability and
operational efficiency of the company. Profitability ratios such as gross profit ratio; return on
assets, and cash flow margin have been used to depict the profitability performance. It has been
interpreted from the calculation that there has been decreasing trend in profitability ratios that
signifies poor performance of the company. Similarly efficiency ratios such as day’s sales in
inventory, day’s accounts receivable outstanding and day’s account payable outstanding have
been used to evaluate the management operation efficiency during the last three years. It has
been noted that management at Caltex has not shown any major efforts to improve the
operational performance and despite management has taken more days in current year to collect
receivables as compare to previous years. The only reason that supports the company
performance was its stable dividend policy and continuously increasing dividend payout ratio
during the last three years. So, decision to make investment is completely dependent upon the
future management action that helps to increase the profitability performance. In case actions
taken by the management helps to increase the profitability in one or two quarter than investors
will think to make the investment in this company.
From
Name of group of investment analysts
Section IV: Conclusion
The overall performance report of Caltex Australia is not satisfactory during the last three
years. The two groups of financial ratios used to evaluate the performance include profitability
ratios and operating efficiency. There was decreasing trend in all the calculated profitability
Paraphrase This Document
Need a fresh take? Get an instant paraphrase of this document with our AI Paraphraser
20
ratios during the last three years that signifies that company has failed to keep up the expectation
of the investors despite increase in sales in year 2018. It is highly expected from the company
that its performance will improve in next year due to economic condition of Australia and
demand of petroleum products in Australia.
21
References
Brigham, F., and Michael C. 2013. Financial management: Theory & practice. Canada: Cengage
Learning.
Caltex Australia. 2016. Annual Report. [Online]. Available at: https://www.caltex.com.au/our-
company/investor-centre/annual-reports-and-reviews [Accessed on: 31 May 2019].
Caltex Australia. 2017. Annual Report. [Online]. Available at: https://www.caltex.com.au/our-
company/investor-centre/annual-reports-and-reviews [Accessed on: 31 May 2019].
Caltex Australia. 2018. Annual Report. [Online]. Available at:
https://www.caltex.com.au/annual-report-2018 [Accessed on: 31 May 2019].
Caltex Australia. 2018. Our Company. [Online]. Available at: https://www.caltex.com.au/our-
company [Accessed on: 31 May 2019].
Damodaran, A, 2011. Applied corporate finance. USA: John Wiley & sons.
Davies, T. and Crawford, I., 2011. Business accounting and finance. USA: Pearson.
Krantz, M. 2016. Fundamental Analysis for Dummies. USA: John Wiley & Sons.
Moles, P. and Kidwekk, D. 2011. Corporate finance. USA: John Wiley &sons.
Reilly.F.K. and Brown.K.C. 2011. Investment analysis & portfolio management. UK: South
western Cengage learning.
Schlichting, T. 2013. Fundamental Analysis, Behavioral Finance and Technical Analysis on the
Stock Market. Australia: GRIN Verlag.
Zimmerman, J.L. and Yahya-Zadeh, M., 2011. Accounting for decision making and
control. Issues in Accounting Education, 26(1), pp.258-259.

22
1 out of 22
Related Documents


Your All-in-One AI-Powered Toolkit for Academic Success.
+13062052269
info@desklib.com
Available 24*7 on WhatsApp / Email
![[object Object]](/_next/static/media/star-bottom.7253800d.svg)
Unlock your academic potential
© 2024 | Zucol Services PVT LTD | All rights reserved.