A1 Doors and Windows Case Study
VerifiedAdded on  2019/10/09
|10
|1256
|453
Report
AI Summary
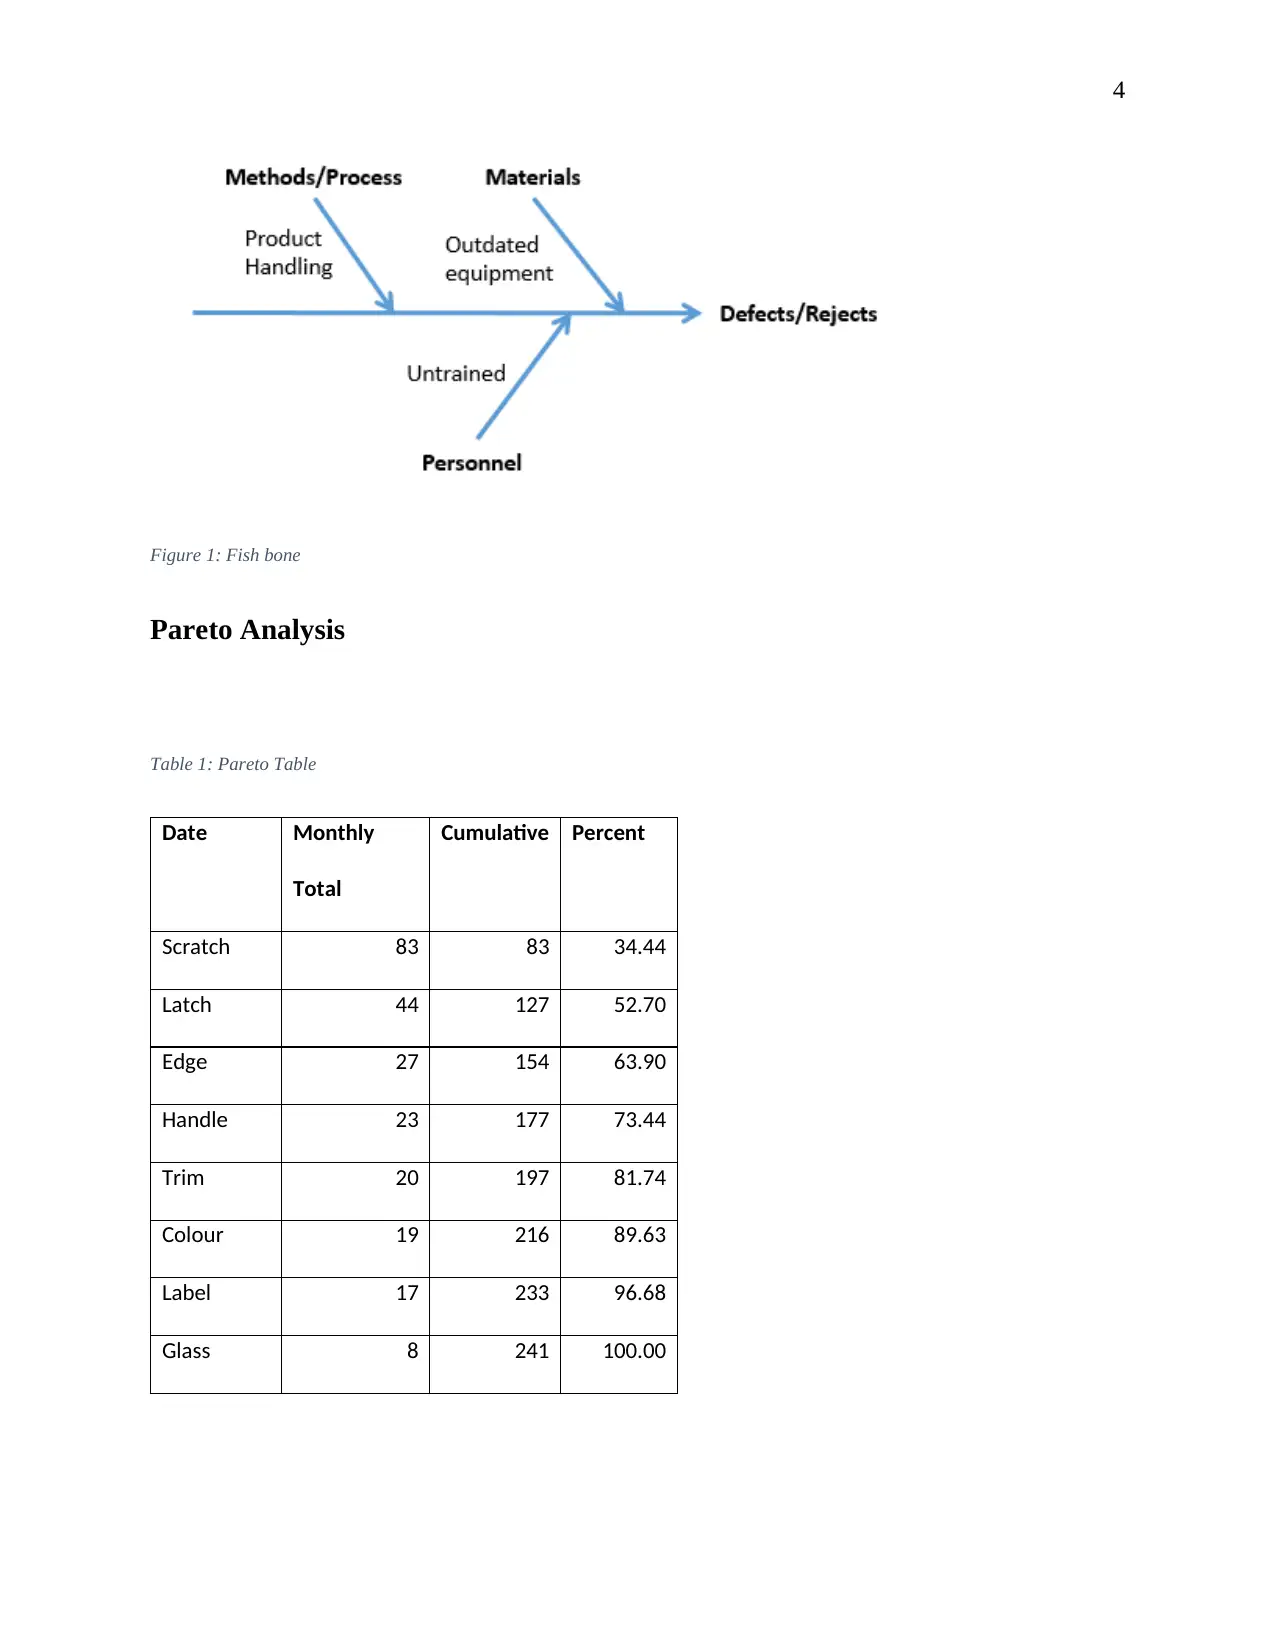
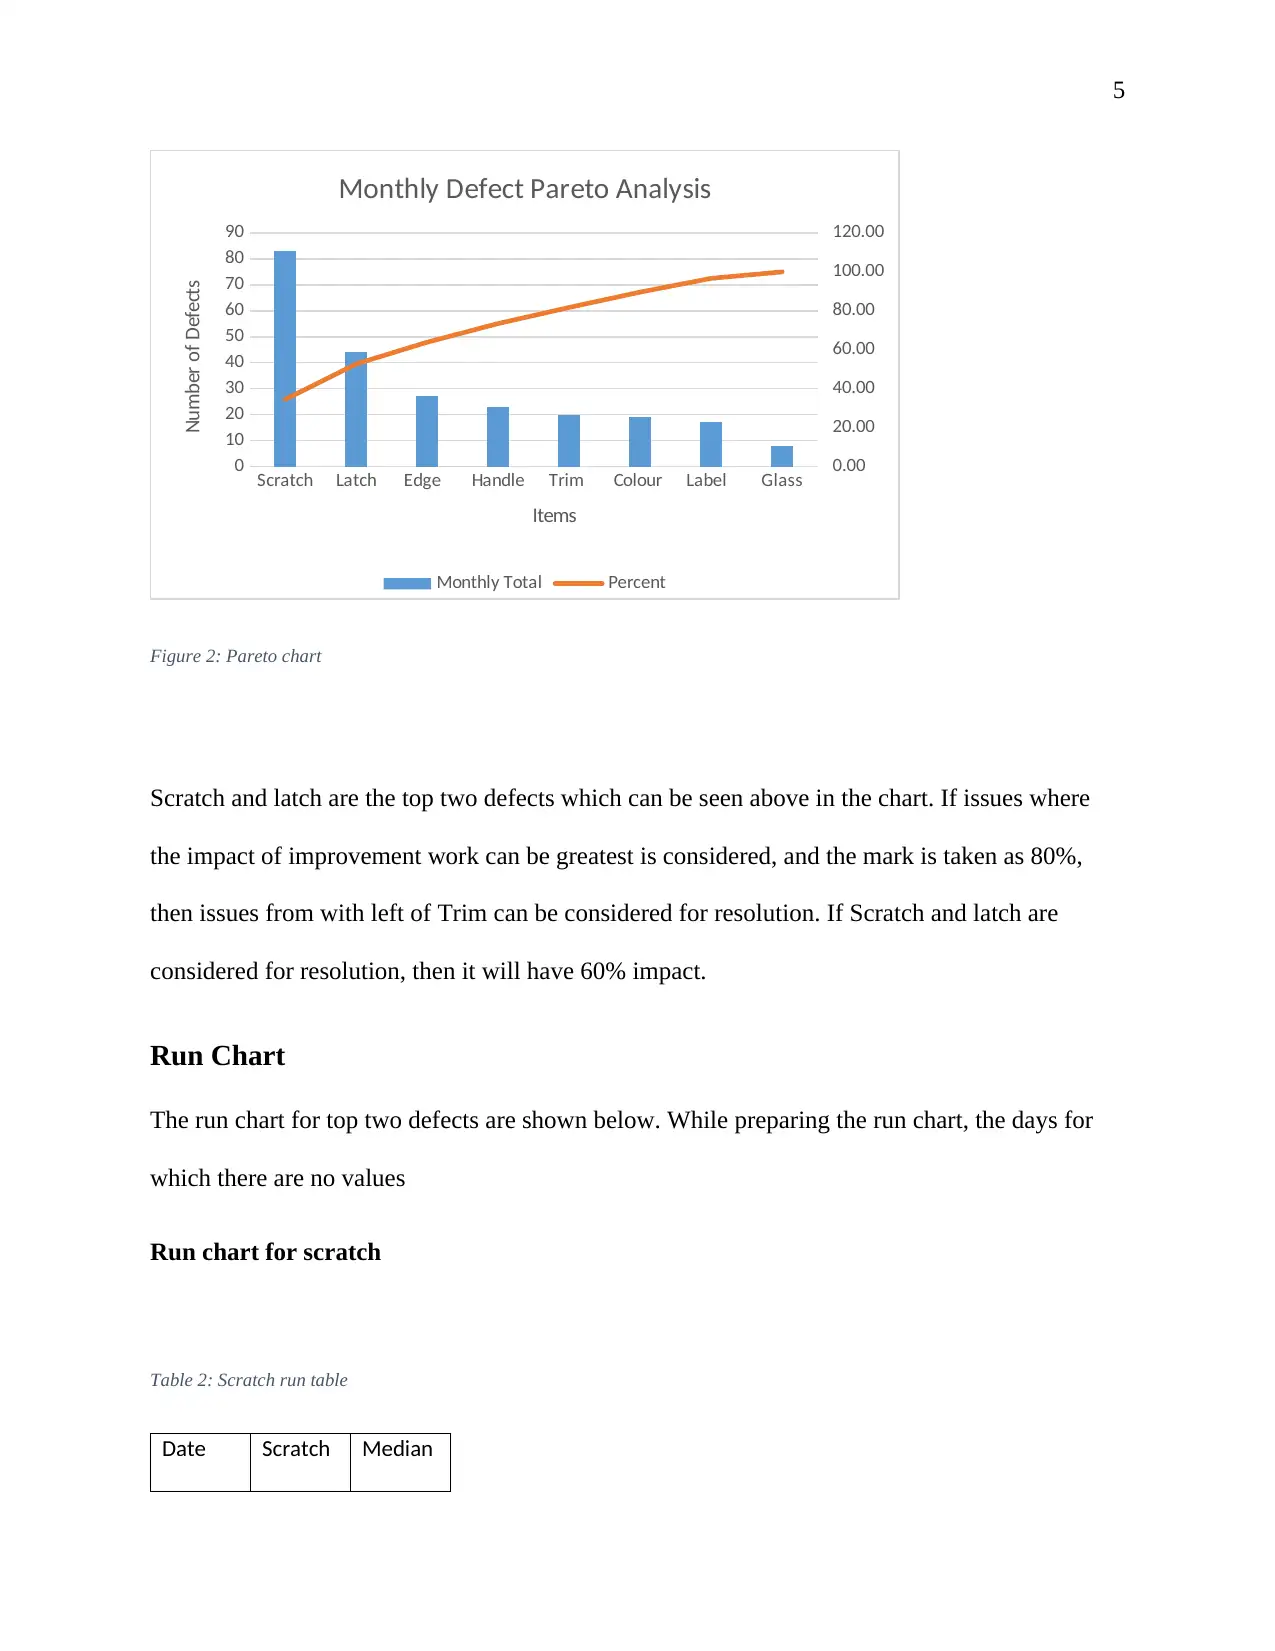
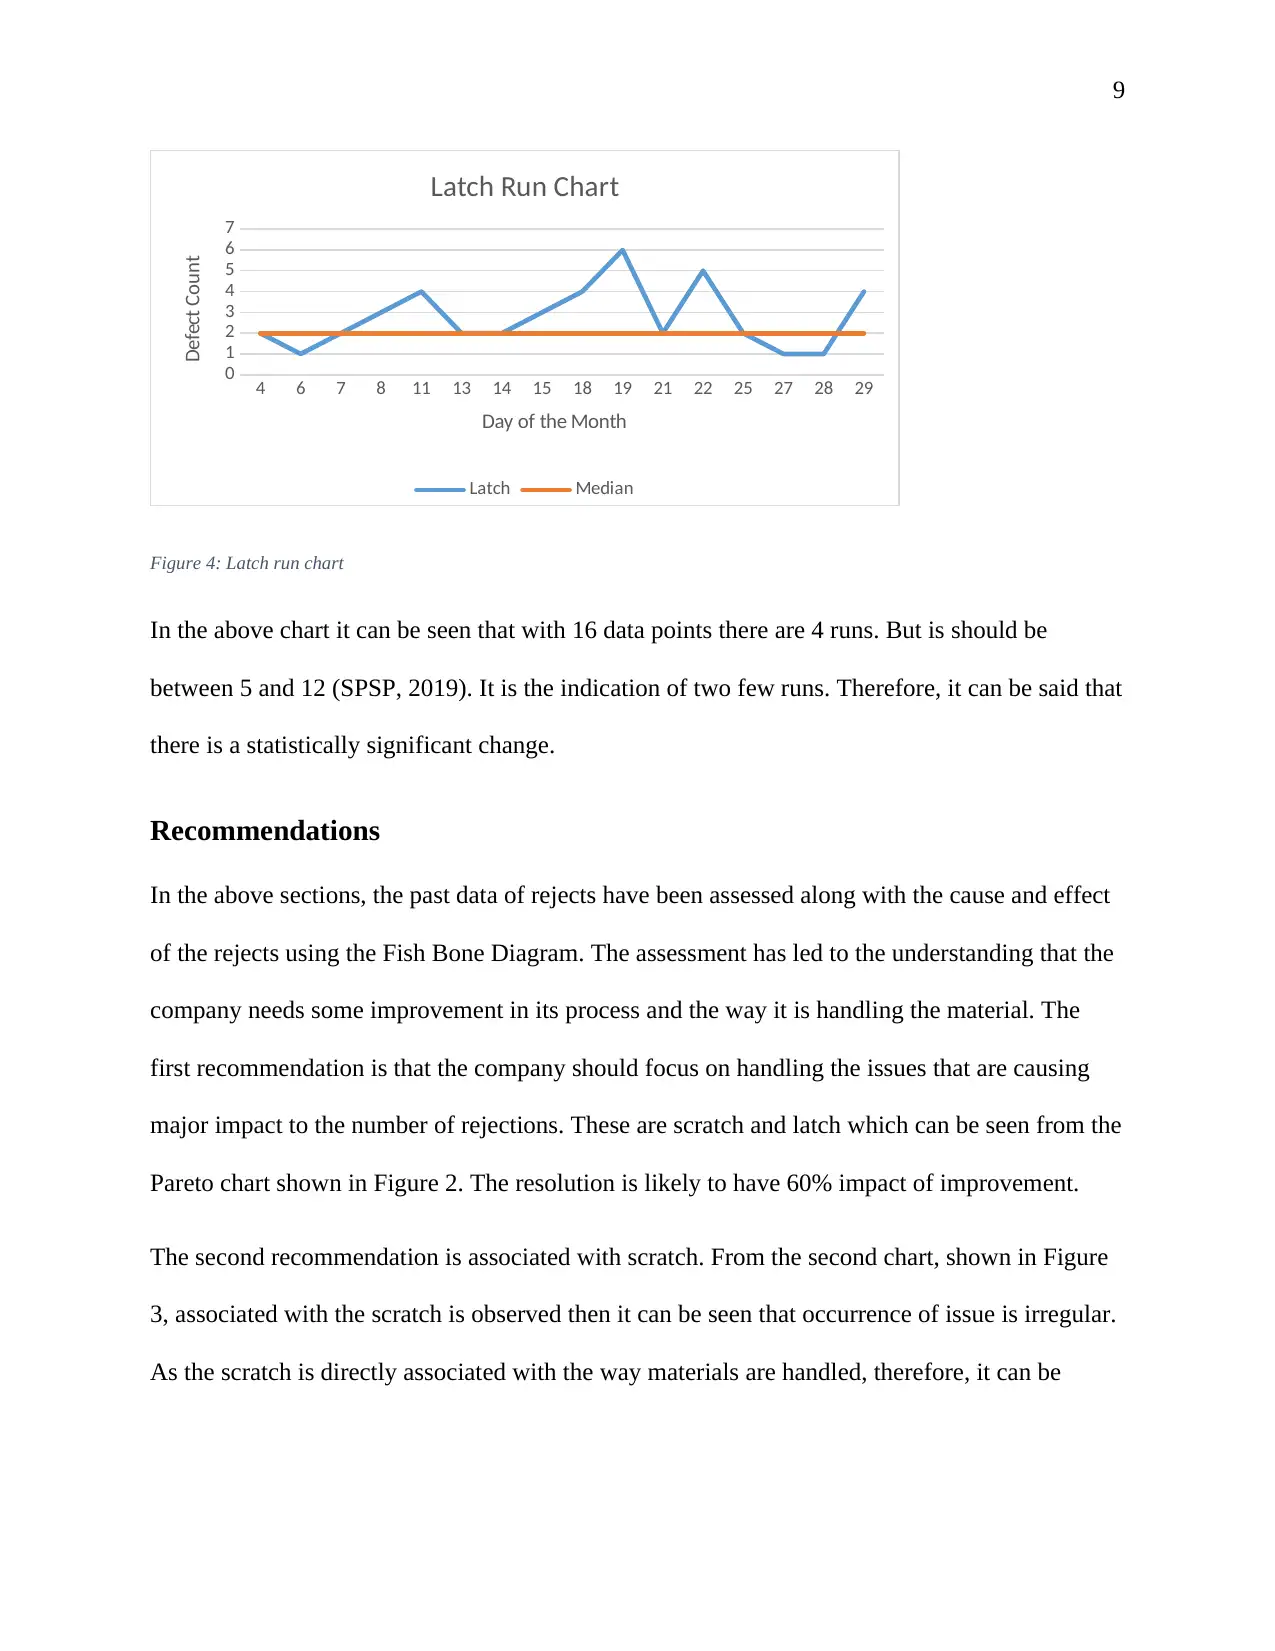
This report investigates the high number of rejects experienced by A1 Doors and Windows. It employs several quality control tools, including a Pareto analysis to identify the most significant defect contributors (scratch and latch), and run charts to analyze the temporal patterns of these defects. The Pareto analysis reveals that addressing scratch and latch issues would yield a 60% improvement. To achieve an 80% improvement, edge, handle, and trim issues also need attention. The report suggests improvements in material handling to reduce scratches and investigates potential causes for latch defects, such as worker training or machine malfunction. The analysis concludes with recommendations focusing on addressing the most impactful defects and improving material handling and installation processes.

A1 Doors and Windows
Paraphrase This Document
Need a fresh take? Get an instant paraphrase of this document with our AI Paraphraser

1
Executive Summary
In this paper the case of A1 Doors and Windows has been assessed. The company is witnessing
increased rejects in its products. As per the assessment conducted, it has been found that the
issues related with scratch and the latch is at the highest. The resolution of these issues is likely
to have 60% impact on the improvement. The Pareto Analysis placed these two elements on the
top followed by other items. In order to resolve 80% issues, the company has to resolve problems
related with Edge, Handle, and Trim also along with scratch and latch. The issue related with
scratch can be resolved if the company focus on proper handling of the product after
manufacturing. It can also be speculated that the scratch is happening at the time of production,
which has to be verified physically. The second issue which is associated with latches, which is
the locking mechanism, can be resolved if the company focus on proper installations. This may
have been occurring due to untrained workers or due to the outdated machine if installation is
machine enabled.

2
Table of Contents
Executive Summary.........................................................................................................................1
Introduction......................................................................................................................................3
Research (Getting information).......................................................................................................3
Fish-bone (Cause and Effect) chart.................................................................................................3
Pareto Analysis................................................................................................................................3
Run Chart.........................................................................................................................................4
Run chart for scratch....................................................................................................................4
Run chart for latch.......................................................................................................................4
Recommendations............................................................................................................................4
⊘ This is a preview!⊘
Do you want full access?
Subscribe today to unlock all pages.

Trusted by 1+ million students worldwide

3
Introduction
In this report, the case of A1 Doors and Windows has been assessed. The company is facing high
number of rejects and it has been expected that there can be any underlying issue. The report is
divided into five main sections. Each of the sections discusses different aspects of assessment
beginning from methods to adopt for research, fish-bone chart, run chart, and recommendations.
Research (Getting information)
The information for the analysis will be collected by interacting with the employees and touring
the facility. The interaction with the employees will help in understanding the methods they are
adopting to conduct particular task. The discussion with the employees who are directly involved
in the handling of the material and development of product will give more insight than having a
discussion with the senior management. Premise for this thinking is that if the senior
management had the knowledge of the underlying issues, then they might have taken needed
action to resolve the situation and analysis would not be required. Apart from this, the next
action will be to tour the facility and observe how the entire process is being conducted from
receiving material from the supplier to delivering it to the customers. This may give insight into
changes that can be made to bring the needed changes.
Fish-bone (Cause and Effect) chart
In the following diagram, the fish-bone chart has been shown for the case. Few of the key
aspects have been considered as the causes for the defects or rejections occurring. Three aspects
have been covered, namely methods, materials, and personnel.
Paraphrase This Document
Need a fresh take? Get an instant paraphrase of this document with our AI Paraphraser

4
Figure 1: Fish bone
Pareto Analysis
Table 1: Pareto Table
Date Monthly
Total
Cumulative Percent
Scratch 83 83 34.44
Latch 44 127 52.70
Edge 27 154 63.90
Handle 23 177 73.44
Trim 20 197 81.74
Colour 19 216 89.63
Label 17 233 96.68
Glass 8 241 100.00
Figure 1: Fish bone
Pareto Analysis
Table 1: Pareto Table
Date Monthly
Total
Cumulative Percent
Scratch 83 83 34.44
Latch 44 127 52.70
Edge 27 154 63.90
Handle 23 177 73.44
Trim 20 197 81.74
Colour 19 216 89.63
Label 17 233 96.68
Glass 8 241 100.00

5
Scratch Latch Edge Handle Trim Colour Label Glass
0
10
20
30
40
50
60
70
80
90
0.00
20.00
40.00
60.00
80.00
100.00
120.00
Monthly Defect Pareto Analysis
Monthly Total Percent
Items
Number of Defects
Figure 2: Pareto chart
Scratch and latch are the top two defects which can be seen above in the chart. If issues where
the impact of improvement work can be greatest is considered, and the mark is taken as 80%,
then issues from with left of Trim can be considered for resolution. If Scratch and latch are
considered for resolution, then it will have 60% impact.
Run Chart
The run chart for top two defects are shown below. While preparing the run chart, the days for
which there are no values
Run chart for scratch
Table 2: Scratch run table
Date Scratch Median
⊘ This is a preview!⊘
Do you want full access?
Subscribe today to unlock all pages.

Trusted by 1+ million students worldwide

6
4 3 4.5
5 5 4.5
6 4 4.5
7 2 4.5
8 5 4.5
11 4 4.5
12 4 4.5
13 7 4.5
14 5 4.5
15 6 4.5
18 8 4.5
19 4 4.5
20 3 4.5
21 6 4.5
22 2 4.5
26 2 4.5
27 5 4.5
28 7 4.5
29 4 4.5
4 3 4.5
5 5 4.5
6 4 4.5
7 2 4.5
8 5 4.5
11 4 4.5
12 4 4.5
13 7 4.5
14 5 4.5
15 6 4.5
18 8 4.5
19 4 4.5
20 3 4.5
21 6 4.5
22 2 4.5
26 2 4.5
27 5 4.5
28 7 4.5
29 4 4.5
Paraphrase This Document
Need a fresh take? Get an instant paraphrase of this document with our AI Paraphraser

7
4 5 6 7 8 11 12 13 14 15 18 19 20 21 22 26 27 28 29
0
1
2
3
4
5
6
7
8
9
Scratch Run Chart
Scratch Median
Day of the Month
Defect Count
Figure 3: Scratch run chart
In the above chart, there are 19 data points, and as per run is concerned, there are 11 runs. As per
run chart table from Rule 3, in 19 data points, there should be 6 should be lower run and 14
should be upper (SPSP, 2019). So it can be said that rule has not been broken. Here, random fall
can also be seen on 20th.
Run chart for latch
Table 3: Latch run table
Date Latch Median
4 2 2
6 1 2
7 2 2

8
8 3 2
11 4 2
13 2 2
14 2 2
15 3 2
18 4 2
19 6 2
21 2 2
22 5 2
25 2 2
27 1 2
28 1 2
29 4 2
8 3 2
11 4 2
13 2 2
14 2 2
15 3 2
18 4 2
19 6 2
21 2 2
22 5 2
25 2 2
27 1 2
28 1 2
29 4 2
⊘ This is a preview!⊘
Do you want full access?
Subscribe today to unlock all pages.

Trusted by 1+ million students worldwide

9
4 6 7 8 11 13 14 15 18 19 21 22 25 27 28 29
0
1
2
3
4
5
6
7
Latch Run Chart
Latch Median
Day of the Month
Defect Count
Figure 4: Latch run chart
In the above chart it can be seen that with 16 data points there are 4 runs. But is should be
between 5 and 12 (SPSP, 2019). It is the indication of two few runs. Therefore, it can be said that
there is a statistically significant change.
Recommendations
In the above sections, the past data of rejects have been assessed along with the cause and effect
of the rejects using the Fish Bone Diagram. The assessment has led to the understanding that the
company needs some improvement in its process and the way it is handling the material. The
first recommendation is that the company should focus on handling the issues that are causing
major impact to the number of rejections. These are scratch and latch which can be seen from the
Pareto chart shown in Figure 2. The resolution is likely to have 60% impact of improvement.
The second recommendation is associated with scratch. From the second chart, shown in Figure
3, associated with the scratch is observed then it can be seen that occurrence of issue is irregular.
As the scratch is directly associated with the way materials are handled, therefore, it can be
1 out of 10
Your All-in-One AI-Powered Toolkit for Academic Success.
 +13062052269
info@desklib.com
Available 24*7 on WhatsApp / Email
Unlock your academic potential
Copyright © 2020–2025 A2Z Services. All Rights Reserved. Developed and managed by ZUCOL.

