ECON 11026: Analysis of Australian Macroeconomic Environment Essay
VerifiedAdded on 2022/10/14
|22
|4389
|338
Essay
AI Summary
This essay provides a comprehensive analysis of the Australian macroeconomic environment, focusing on key indicators, monetary policy, and the Reserve Bank of Australia (RBA). The essay begins by outlining Australia's macroeconomic goals and providing an overview of the economy, including GDP trends, inflation rates, unemployment rates, and exchange rate fluctuations. It then delves into the objectives and functions of monetary policy, including the RBA's role in managing the cash rate and its impact on the housing market. The essay further explores the limitations of monetary policies and examines the effects of expansionary and contractionary monetary policies on inflation and the money market. The analysis incorporates relevant data and figures to illustrate the current economic conditions and the effects of monetary policy interventions. The essay concludes with a discussion of the effectiveness of the RBA's strategies in stabilizing the Australian economy.

1
ECON 11026
ASSESSMENT ITEM 3- TAKE HOME ESSAY
ECON 11026
ASSESSMENT ITEM 3- TAKE HOME ESSAY
Paraphrase This Document
Need a fresh take? Get an instant paraphrase of this document with our AI Paraphraser
2
Contents
Introduction................................................................................................................................3
Analysis......................................................................................................................................3
Question 1..................................................................................................................................3
Question 2..................................................................................................................................8
Question 3..................................................................................................................................9
Question 4................................................................................................................................11
Question 5................................................................................................................................16
Conclusion................................................................................................................................19
Reference..................................................................................................................................20
3
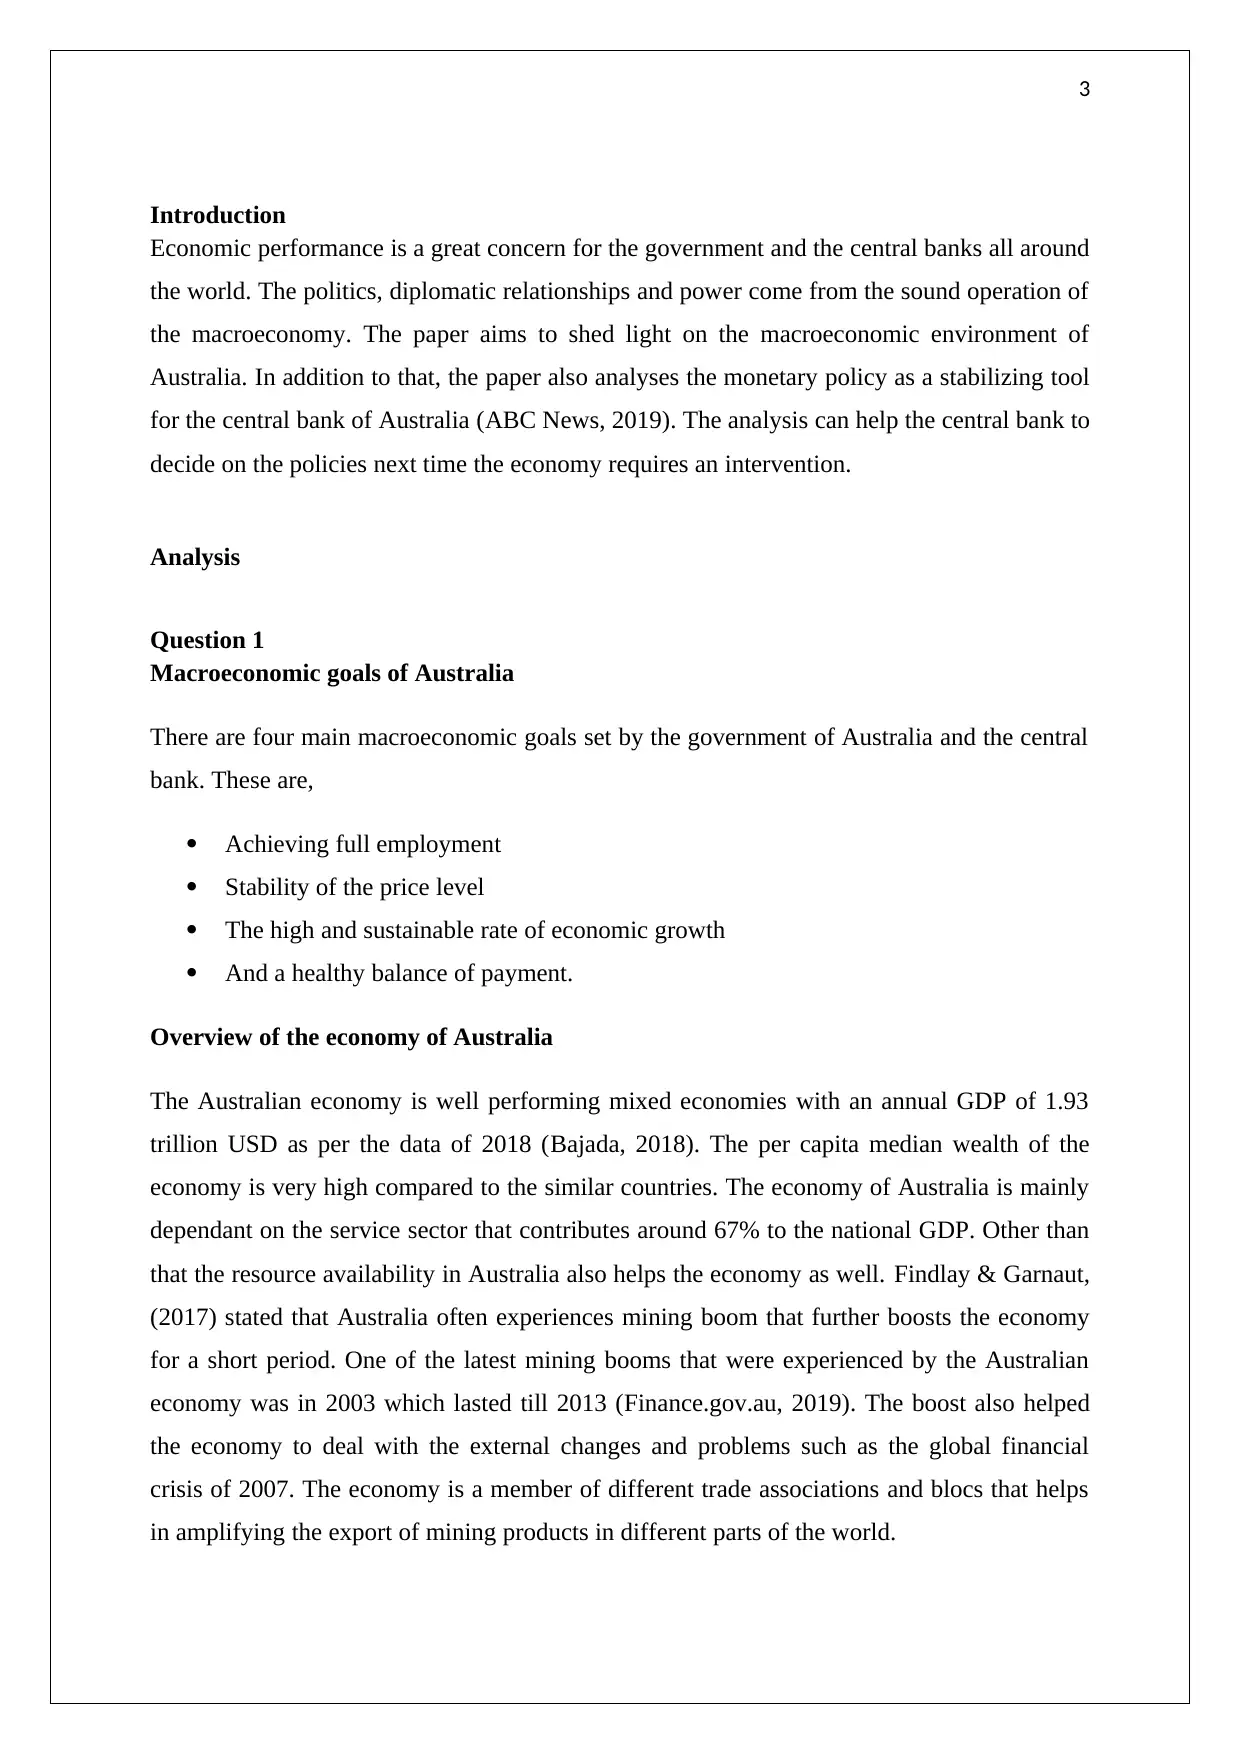
Introduction
Economic performance is a great concern for the government and the central banks all around
the world. The politics, diplomatic relationships and power come from the sound operation of
the macroeconomy. The paper aims to shed light on the macroeconomic environment of
Australia. In addition to that, the paper also analyses the monetary policy as a stabilizing tool
for the central bank of Australia (ABC News, 2019). The analysis can help the central bank to
decide on the policies next time the economy requires an intervention.
Analysis
Question 1
Macroeconomic goals of Australia
There are four main macroeconomic goals set by the government of Australia and the central
bank. These are,
Achieving full employment
Stability of the price level
The high and sustainable rate of economic growth
And a healthy balance of payment.
Overview of the economy of Australia
The Australian economy is well performing mixed economies with an annual GDP of 1.93
trillion USD as per the data of 2018 (Bajada, 2018). The per capita median wealth of the
economy is very high compared to the similar countries. The economy of Australia is mainly
dependant on the service sector that contributes around 67% to the national GDP. Other than
that the resource availability in Australia also helps the economy as well. Findlay & Garnaut,
(2017) stated that Australia often experiences mining boom that further boosts the economy
for a short period. One of the latest mining booms that were experienced by the Australian
economy was in 2003 which lasted till 2013 (Finance.gov.au, 2019). The boost also helped
the economy to deal with the external changes and problems such as the global financial
crisis of 2007. The economy is a member of different trade associations and blocs that helps
in amplifying the export of mining products in different parts of the world.
⊘ This is a preview!⊘
Do you want full access?
Subscribe today to unlock all pages.
Trusted by 1+ million students worldwide
4
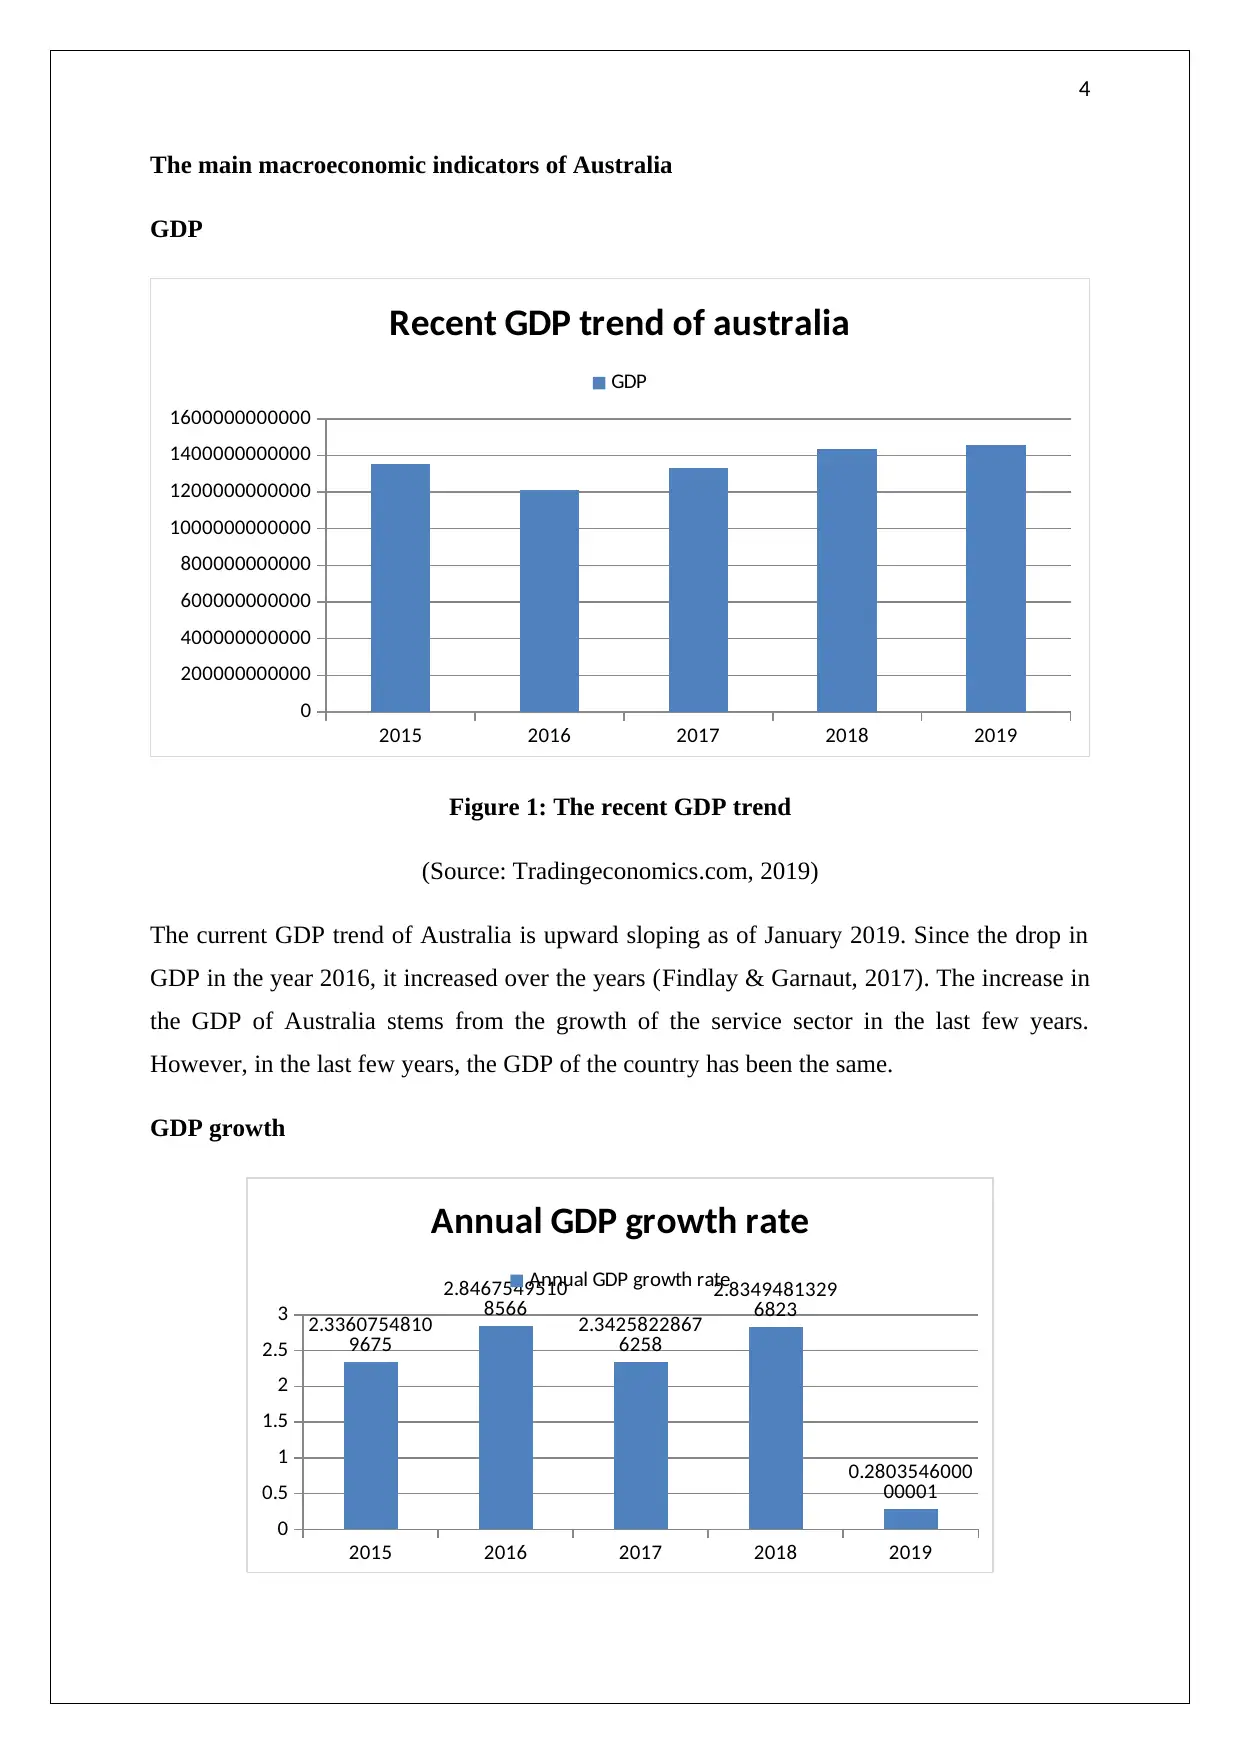
The main macroeconomic indicators of Australia
GDP
2015 2016 2017 2018 2019
0
200000000000
400000000000
600000000000
800000000000
1000000000000
1200000000000
1400000000000
1600000000000
Recent GDP trend of australia
GDP
Figure 1: The recent GDP trend
(Source: Tradingeconomics.com, 2019)
The current GDP trend of Australia is upward sloping as of January 2019. Since the drop in
GDP in the year 2016, it increased over the years (Findlay & Garnaut, 2017). The increase in
the GDP of Australia stems from the growth of the service sector in the last few years.
However, in the last few years, the GDP of the country has been the same.
GDP growth
2015 2016 2017 2018 2019
0
0.5
1
1.5
2
2.5
3 2.3360754810
9675
2.8467549510
8566 2.3425822867
6258
2.8349481329
6823
0.2803546000
00001
Annual GDP growth rate
Annual GDP growth rate
Paraphrase This Document
Need a fresh take? Get an instant paraphrase of this document with our AI Paraphraser
5
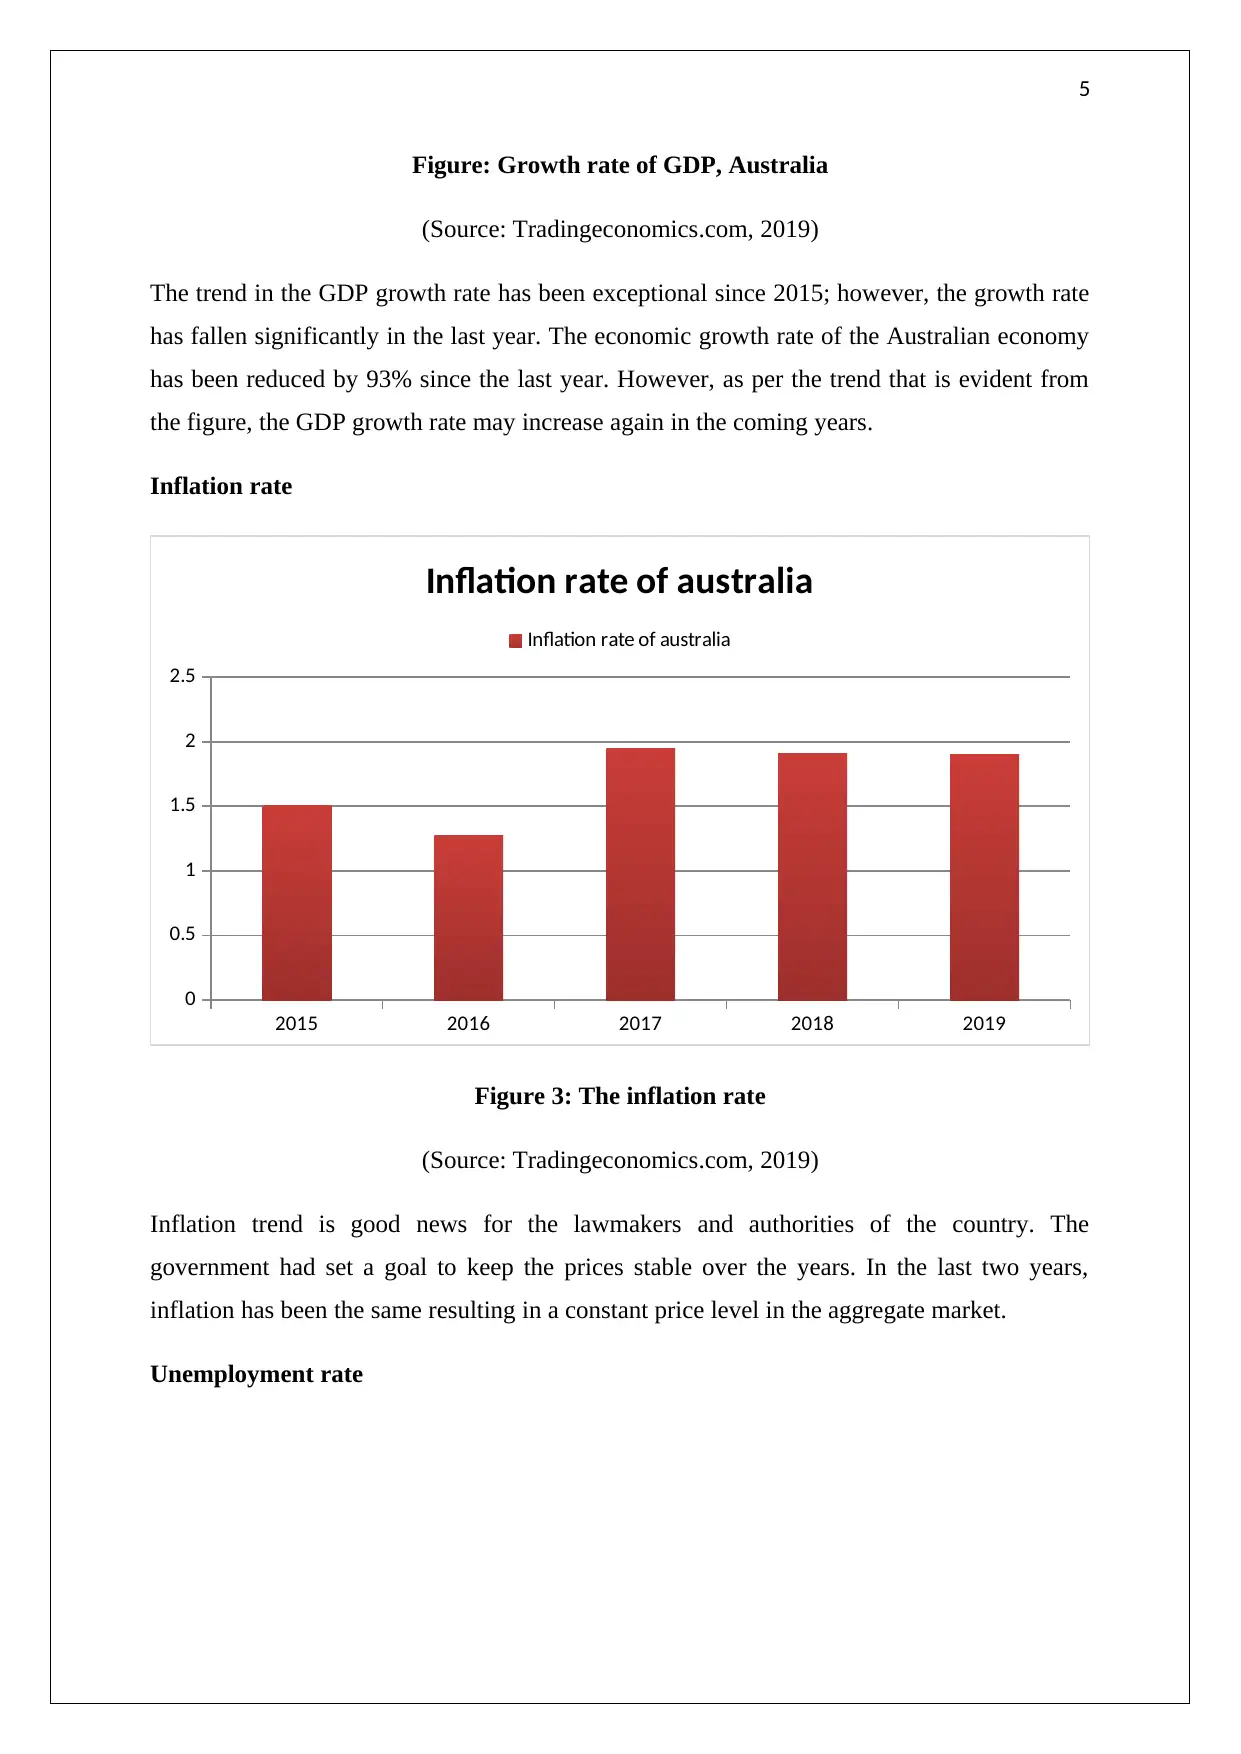
Figure: Growth rate of GDP, Australia
(Source: Tradingeconomics.com, 2019)
The trend in the GDP growth rate has been exceptional since 2015; however, the growth rate
has fallen significantly in the last year. The economic growth rate of the Australian economy
has been reduced by 93% since the last year. However, as per the trend that is evident from
the figure, the GDP growth rate may increase again in the coming years.
Inflation rate
2015 2016 2017 2018 2019
0
0.5
1
1.5
2
2.5
Inflation rate of australia
Inflation rate of australia
Figure 3: The inflation rate
(Source: Tradingeconomics.com, 2019)
Inflation trend is good news for the lawmakers and authorities of the country. The
government had set a goal to keep the prices stable over the years. In the last two years,
inflation has been the same resulting in a constant price level in the aggregate market.
Unemployment rate
6
2015 2016 2017 2018 2019
4.6
4.8
5
5.2
5.4
5.6
5.8
6
6.2 6.0542001724243
3
5.7098999023437
6 5.5911998748779
3 5.5988
5.1254
Unemployment rate
Unemployment rate
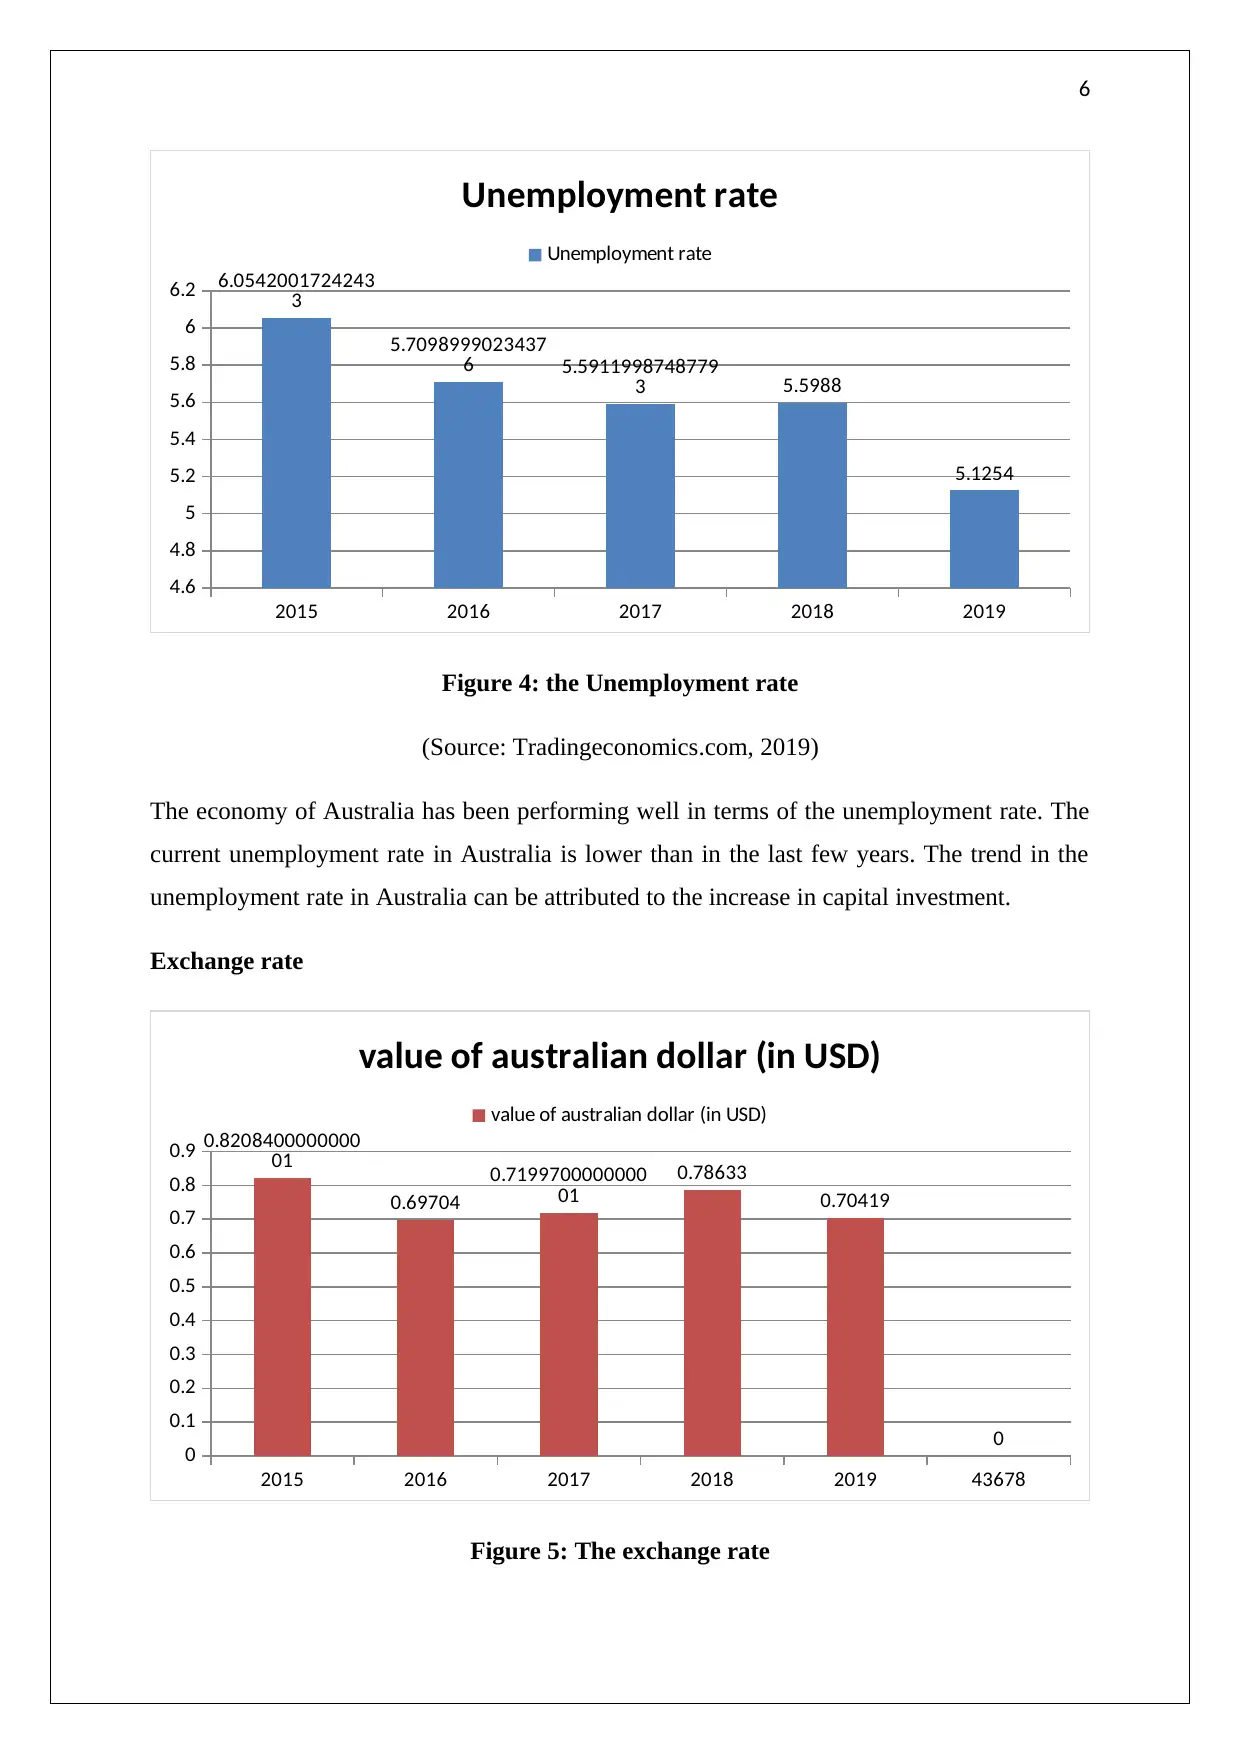
Figure 4: the Unemployment rate
(Source: Tradingeconomics.com, 2019)
The economy of Australia has been performing well in terms of the unemployment rate. The
current unemployment rate in Australia is lower than in the last few years. The trend in the
unemployment rate in Australia can be attributed to the increase in capital investment.
Exchange rate
2015 2016 2017 2018 2019 43678
0
0.1
0.2
0.3
0.4
0.5
0.6
0.7
0.8
0.9 0.8208400000000
01
0.69704
0.7199700000000
01
0.78633
0.70419
0
value of australian dollar (in USD)
value of australian dollar (in USD)
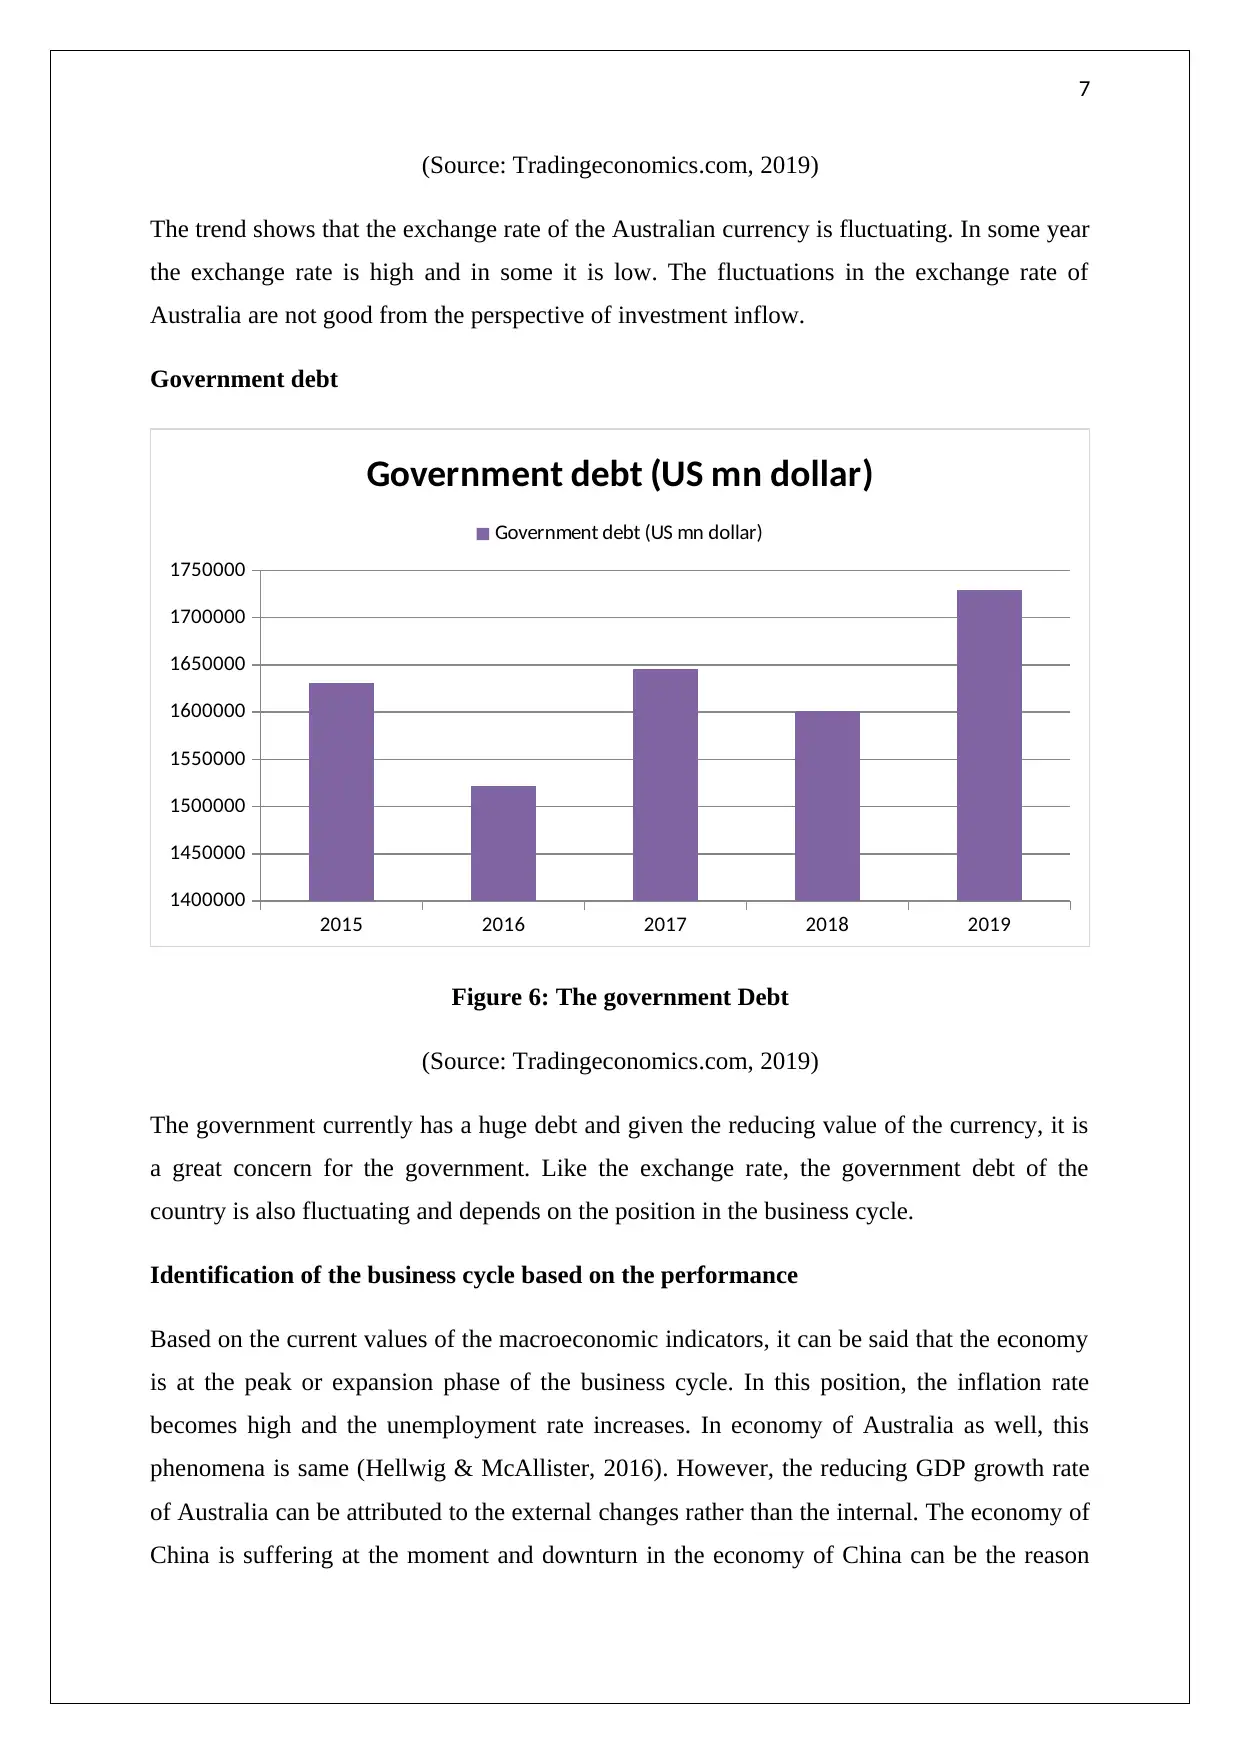
Figure 5: The exchange rate
2015 2016 2017 2018 2019
4.6
4.8
5
5.2
5.4
5.6
5.8
6
6.2 6.0542001724243
3
5.7098999023437
6 5.5911998748779
3 5.5988
5.1254
Unemployment rate
Unemployment rate
Figure 4: the Unemployment rate
(Source: Tradingeconomics.com, 2019)
The economy of Australia has been performing well in terms of the unemployment rate. The
current unemployment rate in Australia is lower than in the last few years. The trend in the
unemployment rate in Australia can be attributed to the increase in capital investment.
Exchange rate
2015 2016 2017 2018 2019 43678
0
0.1
0.2
0.3
0.4
0.5
0.6
0.7
0.8
0.9 0.8208400000000
01
0.69704
0.7199700000000
01
0.78633
0.70419
0
value of australian dollar (in USD)
value of australian dollar (in USD)
Figure 5: The exchange rate
⊘ This is a preview!⊘
Do you want full access?
Subscribe today to unlock all pages.
Trusted by 1+ million students worldwide
7
(Source: Tradingeconomics.com, 2019)
The trend shows that the exchange rate of the Australian currency is fluctuating. In some year
the exchange rate is high and in some it is low. The fluctuations in the exchange rate of
Australia are not good from the perspective of investment inflow.
Government debt
2015 2016 2017 2018 2019
1400000
1450000
1500000
1550000
1600000
1650000
1700000
1750000
Government debt (US mn dollar)
Government debt (US mn dollar)
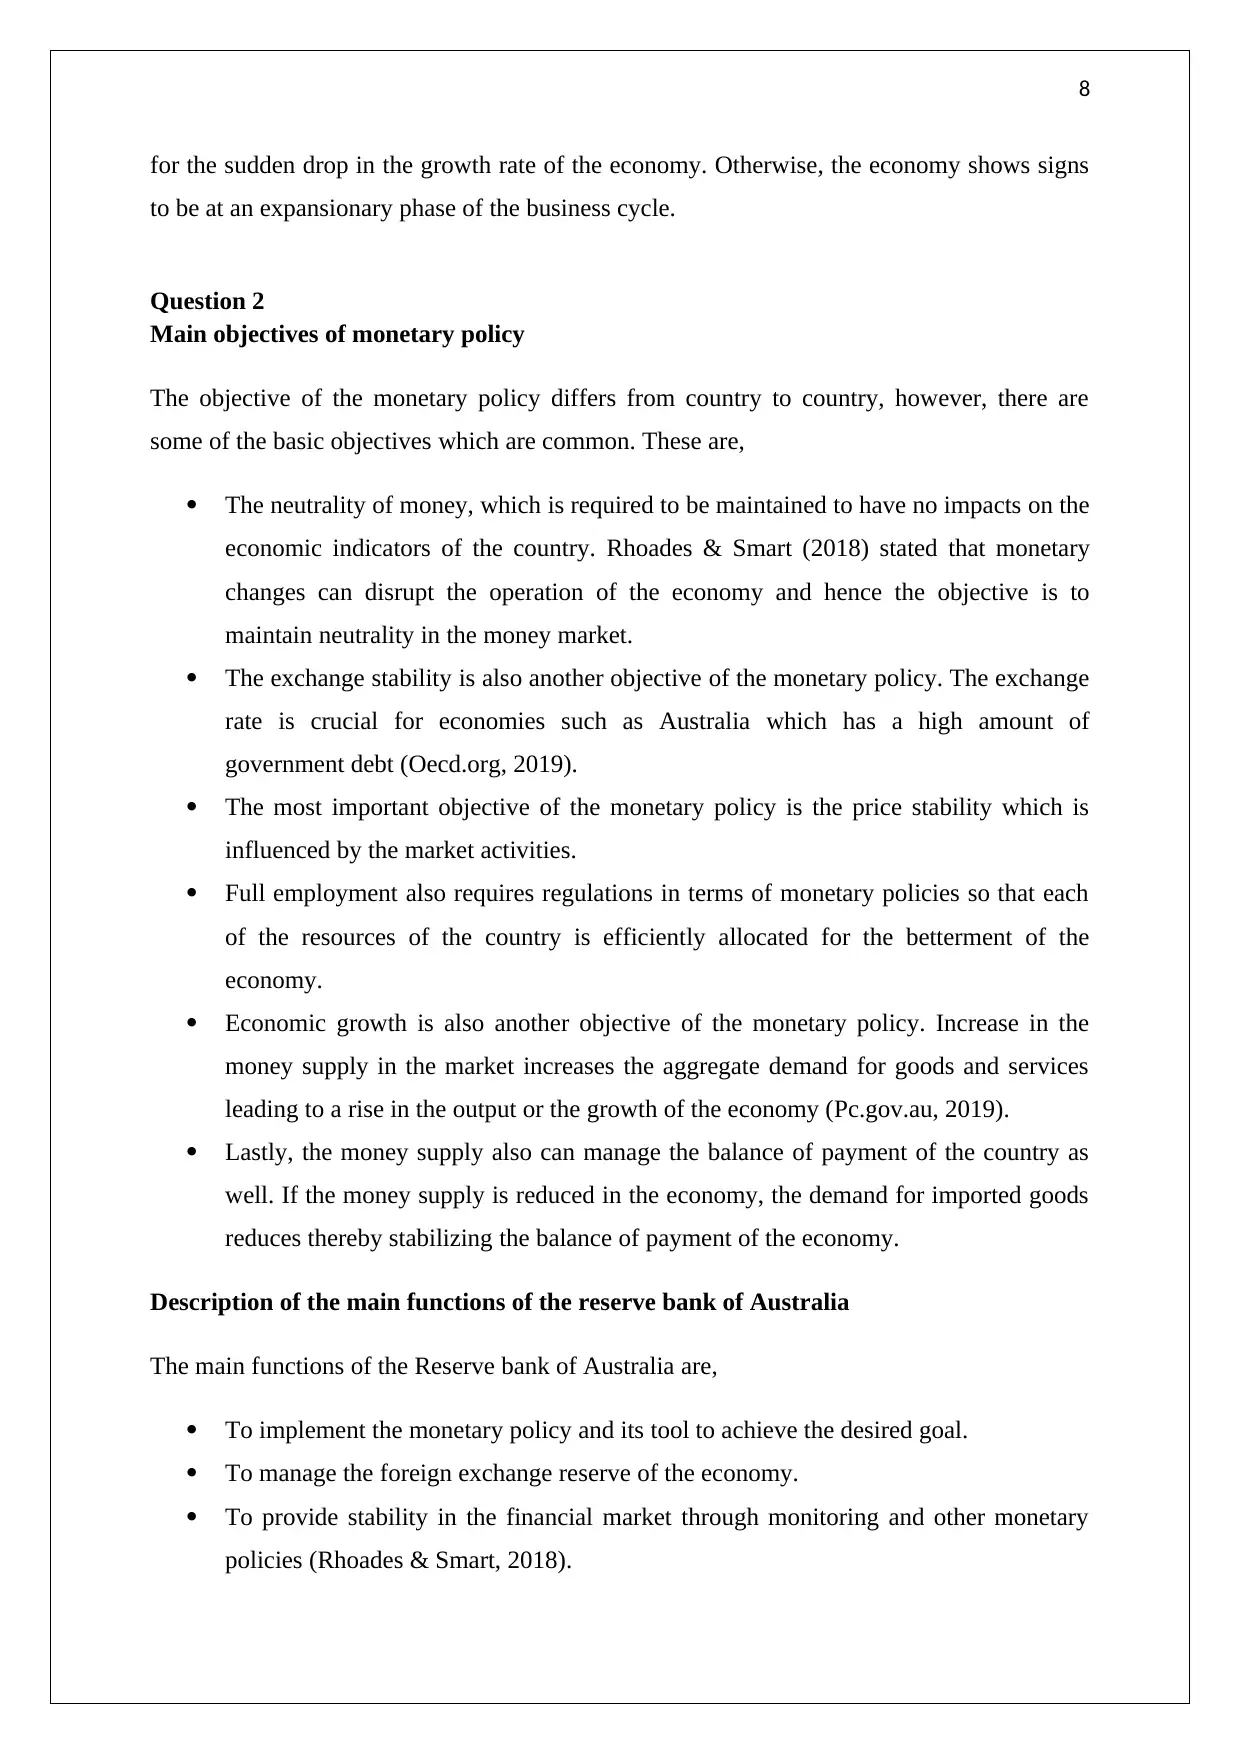
Figure 6: The government Debt
(Source: Tradingeconomics.com, 2019)
The government currently has a huge debt and given the reducing value of the currency, it is
a great concern for the government. Like the exchange rate, the government debt of the
country is also fluctuating and depends on the position in the business cycle.
Identification of the business cycle based on the performance
Based on the current values of the macroeconomic indicators, it can be said that the economy
is at the peak or expansion phase of the business cycle. In this position, the inflation rate
becomes high and the unemployment rate increases. In economy of Australia as well, this
phenomena is same (Hellwig & McAllister, 2016). However, the reducing GDP growth rate
of Australia can be attributed to the external changes rather than the internal. The economy of
China is suffering at the moment and downturn in the economy of China can be the reason
(Source: Tradingeconomics.com, 2019)
The trend shows that the exchange rate of the Australian currency is fluctuating. In some year
the exchange rate is high and in some it is low. The fluctuations in the exchange rate of
Australia are not good from the perspective of investment inflow.
Government debt
2015 2016 2017 2018 2019
1400000
1450000
1500000
1550000
1600000
1650000
1700000
1750000
Government debt (US mn dollar)
Government debt (US mn dollar)
Figure 6: The government Debt
(Source: Tradingeconomics.com, 2019)
The government currently has a huge debt and given the reducing value of the currency, it is
a great concern for the government. Like the exchange rate, the government debt of the
country is also fluctuating and depends on the position in the business cycle.
Identification of the business cycle based on the performance
Based on the current values of the macroeconomic indicators, it can be said that the economy
is at the peak or expansion phase of the business cycle. In this position, the inflation rate
becomes high and the unemployment rate increases. In economy of Australia as well, this
phenomena is same (Hellwig & McAllister, 2016). However, the reducing GDP growth rate
of Australia can be attributed to the external changes rather than the internal. The economy of
China is suffering at the moment and downturn in the economy of China can be the reason
Paraphrase This Document
Need a fresh take? Get an instant paraphrase of this document with our AI Paraphraser
8
for the sudden drop in the growth rate of the economy. Otherwise, the economy shows signs
to be at an expansionary phase of the business cycle.
Question 2
Main objectives of monetary policy
The objective of the monetary policy differs from country to country, however, there are
some of the basic objectives which are common. These are,
The neutrality of money, which is required to be maintained to have no impacts on the
economic indicators of the country. Rhoades & Smart (2018) stated that monetary
changes can disrupt the operation of the economy and hence the objective is to
maintain neutrality in the money market.
The exchange stability is also another objective of the monetary policy. The exchange
rate is crucial for economies such as Australia which has a high amount of
government debt (Oecd.org, 2019).
The most important objective of the monetary policy is the price stability which is
influenced by the market activities.
Full employment also requires regulations in terms of monetary policies so that each
of the resources of the country is efficiently allocated for the betterment of the
economy.
Economic growth is also another objective of the monetary policy. Increase in the
money supply in the market increases the aggregate demand for goods and services
leading to a rise in the output or the growth of the economy (Pc.gov.au, 2019).
Lastly, the money supply also can manage the balance of payment of the country as
well. If the money supply is reduced in the economy, the demand for imported goods
reduces thereby stabilizing the balance of payment of the economy.
Description of the main functions of the reserve bank of Australia
The main functions of the Reserve bank of Australia are,
To implement the monetary policy and its tool to achieve the desired goal.
To manage the foreign exchange reserve of the economy.
To provide stability in the financial market through monitoring and other monetary
policies (Rhoades & Smart, 2018).
9
To issue bank new notes and distribute among the economic entities.
To govern the banking services operate throughout the country.
Limitations of the monetary policies to stabilise the economy
One of the biggest limitations of the monetary policies is that it cannot guaranty stabilisation
in the different economic sector if the government does not supplement it with similar
policies. For example, if the government implements an expansionary monetary policy and at
the same time it also increases the interest rates as per the fiscal policies, it will have no
effects on the economy (Wilson et al. 2018). The monetary policies often fail when there is
an existence of a black market in the economy. In the case of Australia, the black market
operations often reduce the efforts undertaken by the government. Lastly, in the case of the
Australian market, unfavourable banking habits also contribute to the limitations of the
monetary policies of the government. For example, if the government uses the instrument of
contraction and the banks starts to create risky loans for the customers of the market, the
policies will contradict each other leading nowhere.
Question 3
The cash rate is the interest rate that the central bank charges to the loans taken by the
commercial banks. The loans taken from the Reserve bank of Australia is the main source of
funds for commercial banks. The cash rates can also be monetary tools for the reserve bank
of Australia as well (Wto.org, 2019). As the cash rate is increased, the commercial banks of
the market will find it costlier to borrow from the central bank and the cost will be partly
transferred to the customers of the market in form of the higher interest rate. The higher
interest rate can again make the customers of the market keep their cash deposited in the
bank. This will result in a reduction in the liquidity in the economic system of Australia.
⊘ This is a preview!⊘
Do you want full access?
Subscribe today to unlock all pages.
Trusted by 1+ million students worldwide
10
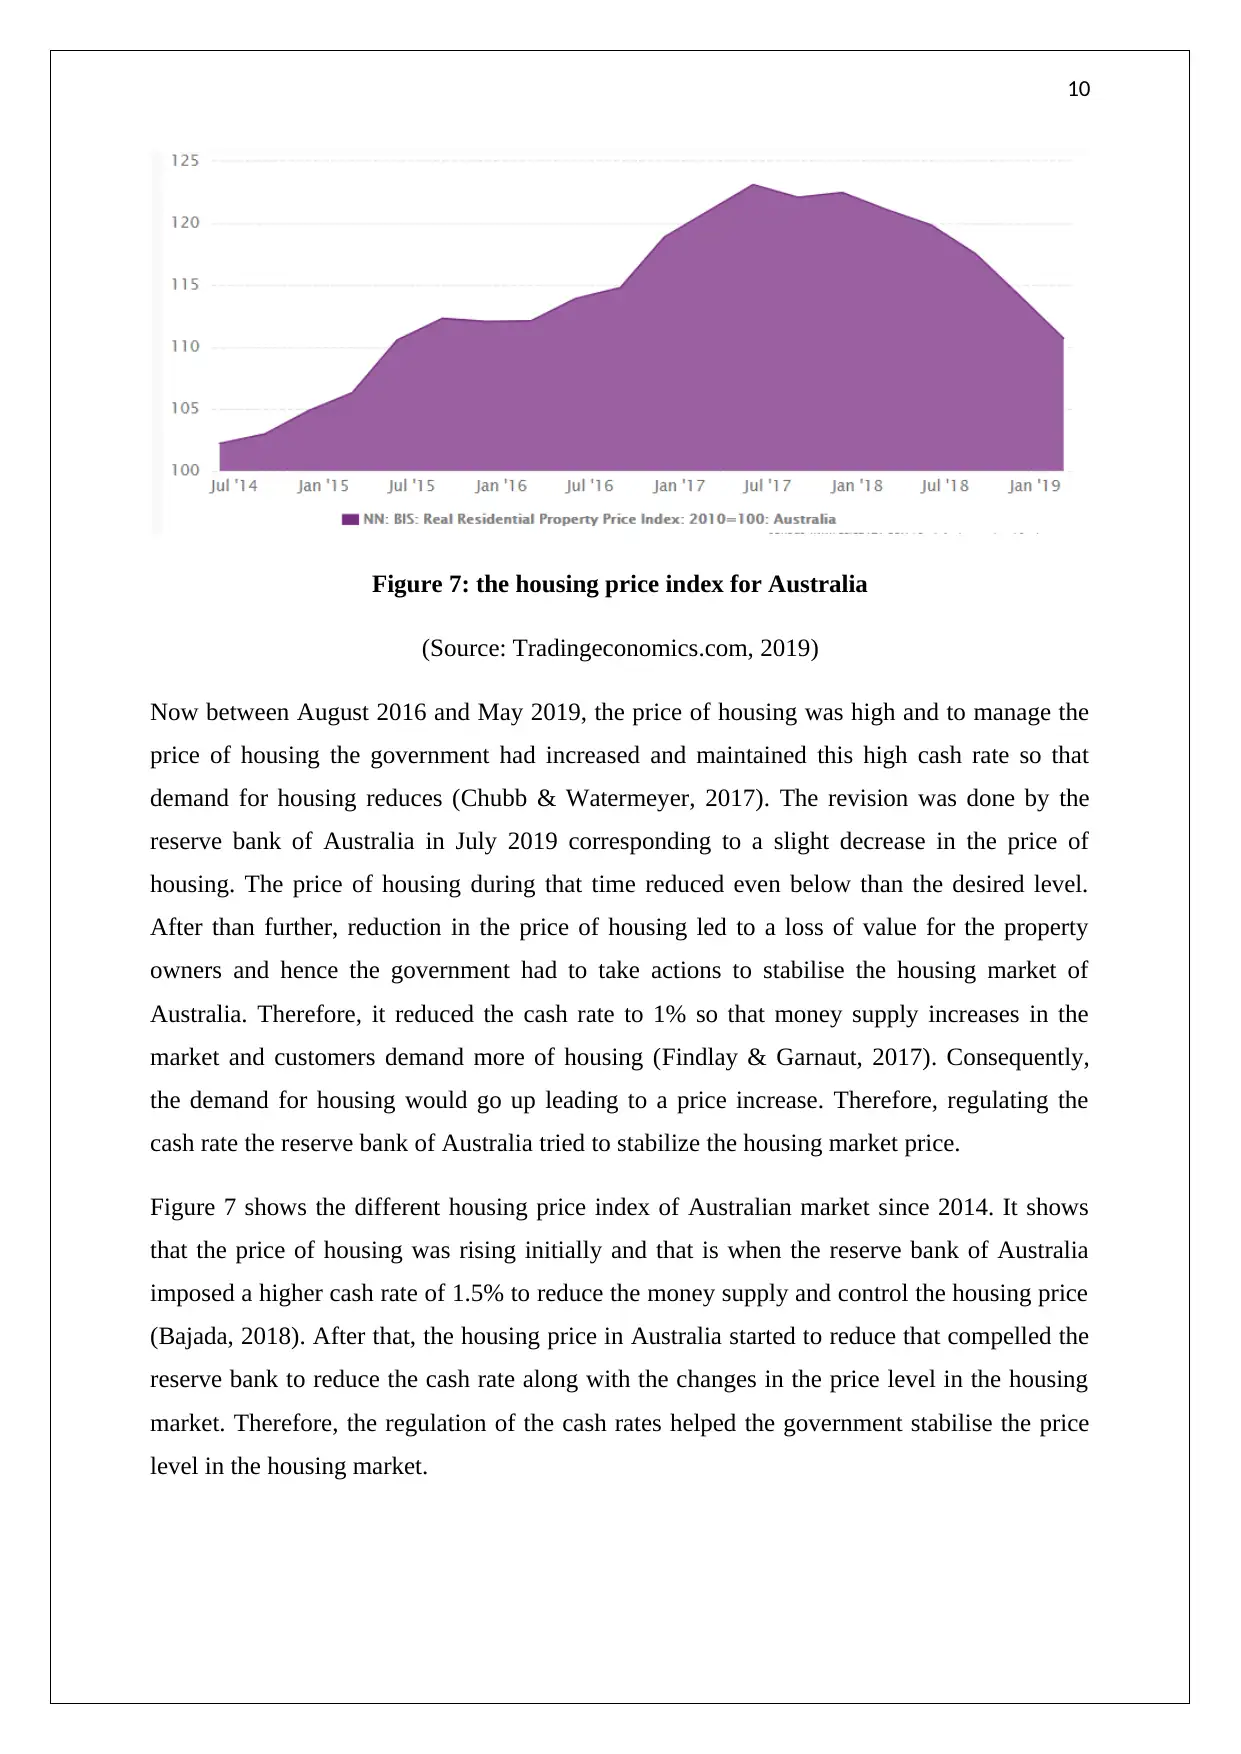
Figure 7: the housing price index for Australia
(Source: Tradingeconomics.com, 2019)
Now between August 2016 and May 2019, the price of housing was high and to manage the
price of housing the government had increased and maintained this high cash rate so that
demand for housing reduces (Chubb & Watermeyer, 2017). The revision was done by the
reserve bank of Australia in July 2019 corresponding to a slight decrease in the price of
housing. The price of housing during that time reduced even below than the desired level.
After than further, reduction in the price of housing led to a loss of value for the property
owners and hence the government had to take actions to stabilise the housing market of
Australia. Therefore, it reduced the cash rate to 1% so that money supply increases in the
market and customers demand more of housing (Findlay & Garnaut, 2017). Consequently,
the demand for housing would go up leading to a price increase. Therefore, regulating the
cash rate the reserve bank of Australia tried to stabilize the housing market price.
Figure 7 shows the different housing price index of Australian market since 2014. It shows
that the price of housing was rising initially and that is when the reserve bank of Australia
imposed a higher cash rate of 1.5% to reduce the money supply and control the housing price
(Bajada, 2018). After that, the housing price in Australia started to reduce that compelled the
reserve bank to reduce the cash rate along with the changes in the price level in the housing
market. Therefore, the regulation of the cash rates helped the government stabilise the price
level in the housing market.
Paraphrase This Document
Need a fresh take? Get an instant paraphrase of this document with our AI Paraphraser
11
Question 4
There are two basic types of monetary policies that are executed or followed by central banks
around the world; these are expansionary and contractionary monetary policies. Expansionary
monetary policy is when the Reserve Bank of Australia expands the money supply in the
economy (McLean & Holmes, 2019). On the other hand, the contractionary monetary policy
is when the central bank decides to reduce the money supply in the economy to achieve a
specific goal. The expansionary policy expands the operation and activity of the economy
whereas; the contractionary policy reduces the output.
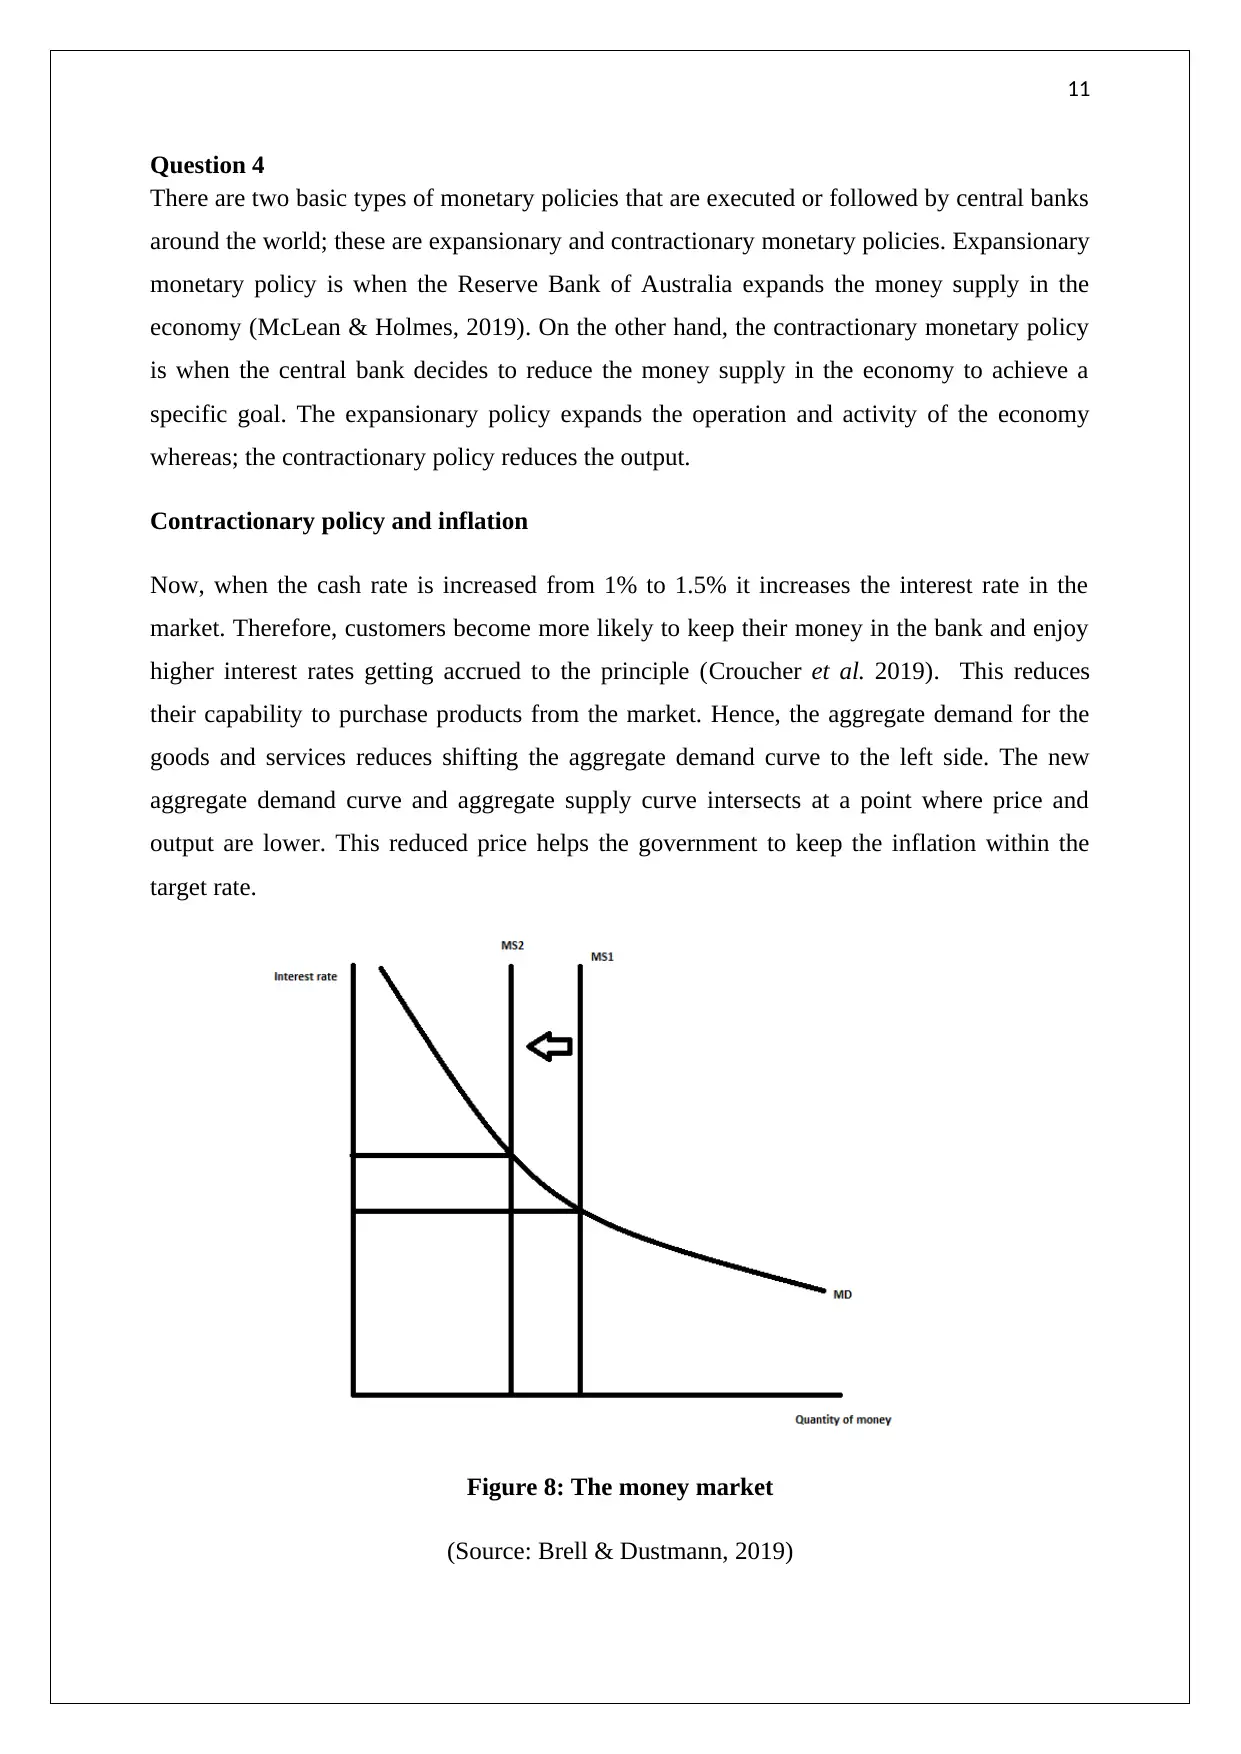
Contractionary policy and inflation
Now, when the cash rate is increased from 1% to 1.5% it increases the interest rate in the
market. Therefore, customers become more likely to keep their money in the bank and enjoy
higher interest rates getting accrued to the principle (Croucher et al. 2019). This reduces
their capability to purchase products from the market. Hence, the aggregate demand for the
goods and services reduces shifting the aggregate demand curve to the left side. The new
aggregate demand curve and aggregate supply curve intersects at a point where price and
output are lower. This reduced price helps the government to keep the inflation within the
target rate.
Figure 8: The money market
(Source: Brell & Dustmann, 2019)
Question 4
There are two basic types of monetary policies that are executed or followed by central banks
around the world; these are expansionary and contractionary monetary policies. Expansionary
monetary policy is when the Reserve Bank of Australia expands the money supply in the
economy (McLean & Holmes, 2019). On the other hand, the contractionary monetary policy
is when the central bank decides to reduce the money supply in the economy to achieve a
specific goal. The expansionary policy expands the operation and activity of the economy
whereas; the contractionary policy reduces the output.
Contractionary policy and inflation
Now, when the cash rate is increased from 1% to 1.5% it increases the interest rate in the
market. Therefore, customers become more likely to keep their money in the bank and enjoy
higher interest rates getting accrued to the principle (Croucher et al. 2019). This reduces
their capability to purchase products from the market. Hence, the aggregate demand for the
goods and services reduces shifting the aggregate demand curve to the left side. The new
aggregate demand curve and aggregate supply curve intersects at a point where price and
output are lower. This reduced price helps the government to keep the inflation within the
target rate.
Figure 8: The money market
(Source: Brell & Dustmann, 2019)
12
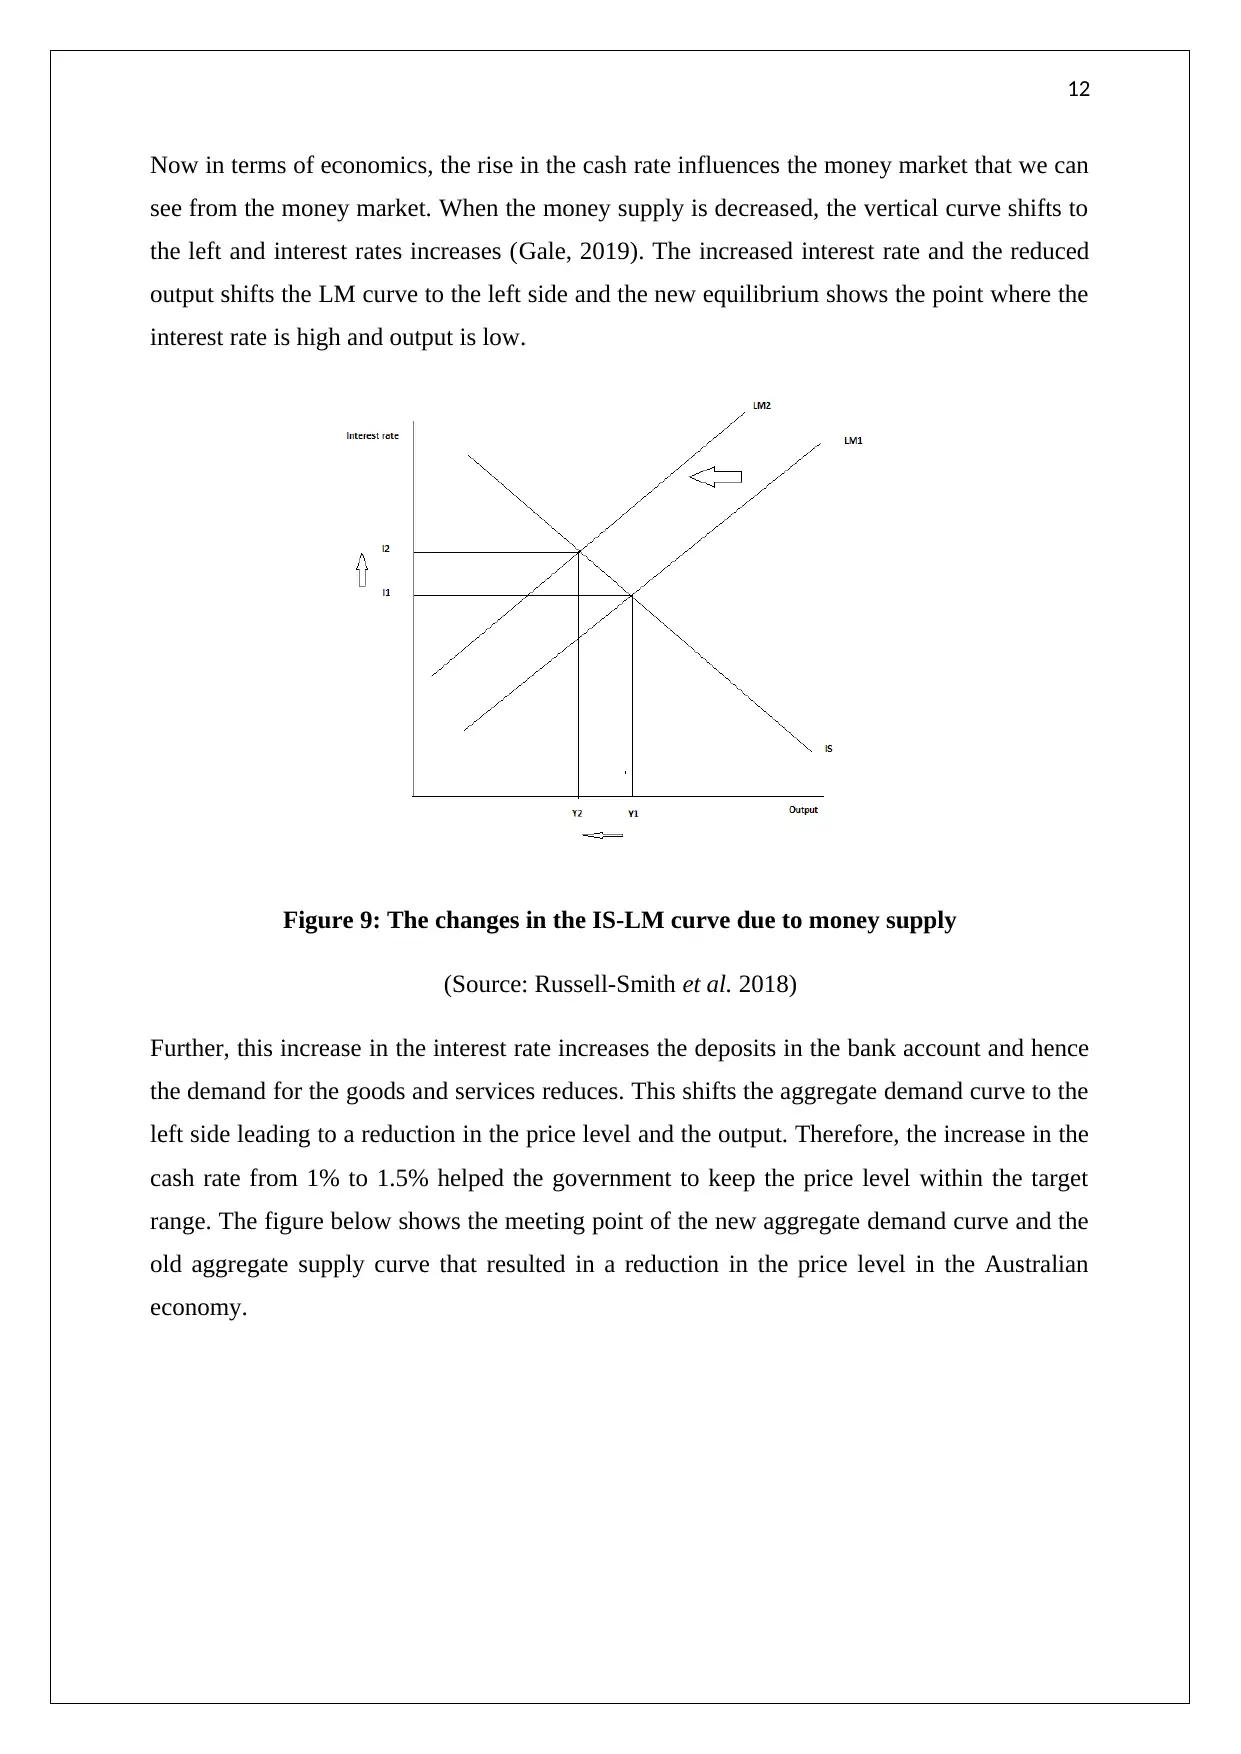
Now in terms of economics, the rise in the cash rate influences the money market that we can
see from the money market. When the money supply is decreased, the vertical curve shifts to
the left and interest rates increases (Gale, 2019). The increased interest rate and the reduced
output shifts the LM curve to the left side and the new equilibrium shows the point where the
interest rate is high and output is low.
Figure 9: The changes in the IS-LM curve due to money supply
(Source: Russell-Smith et al. 2018)
Further, this increase in the interest rate increases the deposits in the bank account and hence
the demand for the goods and services reduces. This shifts the aggregate demand curve to the
left side leading to a reduction in the price level and the output. Therefore, the increase in the
cash rate from 1% to 1.5% helped the government to keep the price level within the target
range. The figure below shows the meeting point of the new aggregate demand curve and the
old aggregate supply curve that resulted in a reduction in the price level in the Australian
economy.
⊘ This is a preview!⊘
Do you want full access?
Subscribe today to unlock all pages.
Trusted by 1+ million students worldwide
1 out of 22
Related Documents


Your All-in-One AI-Powered Toolkit for Academic Success.
+13062052269
info@desklib.com
Available 24*7 on WhatsApp / Email
![[object Object]](/_next/static/media/star-bottom.7253800d.svg)
Unlock your academic potential
Copyright © 2020–2025 A2Z Services. All Rights Reserved. Developed and managed by ZUCOL.