Impact of Fall in Chinese Economy on Macroeconomic Conditions of Australia
VerifiedAdded on 2022/10/15
|13
|2910
|202
AI Summary
This paper has the objective to study the impact of fall in the growth level of the Chinese economy on the macroeconomic conditions of Australia. The paper is going to study the aggregate demand and the supply of the economy of Australia first. Then using that concept the paper is going to examine the impacts of the low growth of the Chinese economy on the economic conditions of Australia. In addition to that, the paper is also going to present recommendations based on the study and the current economic conditions of Australia.
Contribute Materials
Your contribution can guide someone’s learning journey. Share your
documents today.
1
ECONOMICS ASSIGNMENT
ECONOMICS ASSIGNMENT
Secure Best Marks with AI Grader
Need help grading? Try our AI Grader for instant feedback on your assignments.
2
Contents
Introduction................................................................................................................................3
Analysis......................................................................................................................................3
Meaning and analysis of AD......................................................................................................3
Meaning and analysis of AS......................................................................................................4
Explanation of the equilibrium theory of AD and AS...............................................................5
Macroeconomic conditions in Australia....................................................................................6
Fall in the rate of growth of the Chinese economy and its impacts...........................................8
Conclusion and recommendations...........................................................................................10
Reference..................................................................................................................................12
3
Introduction
In the time of globalisation and free-market, all the economies of the world are intertwined
with each other. Therefore, change in one economy impacts the other economies around the
world. The economic turbulences such as global financial crisis affected others due to the
economic openness and globalisation. Therefore, it is important to study the changes in one
economy corresponding to the changes in another economy. This paper has the objective to
study the impact of fall in the growth level of the Chinese economy on the macroeconomic
conditions of Australia.
The channels through which these economies are connected are the aggregate demand and
supply of the respective economies. The paper is going to study the aggregate demand and
the supply of the economy of Australia first. Then using that concept the paper is going to
examine the impacts of the low growth of the Chinese economy on the economic conditions
of Australia. In addition to that, the paper is also going to present recommendations based on
the study and the current economic conditions of Australia.
Analysis
Meaning and analysis of AD
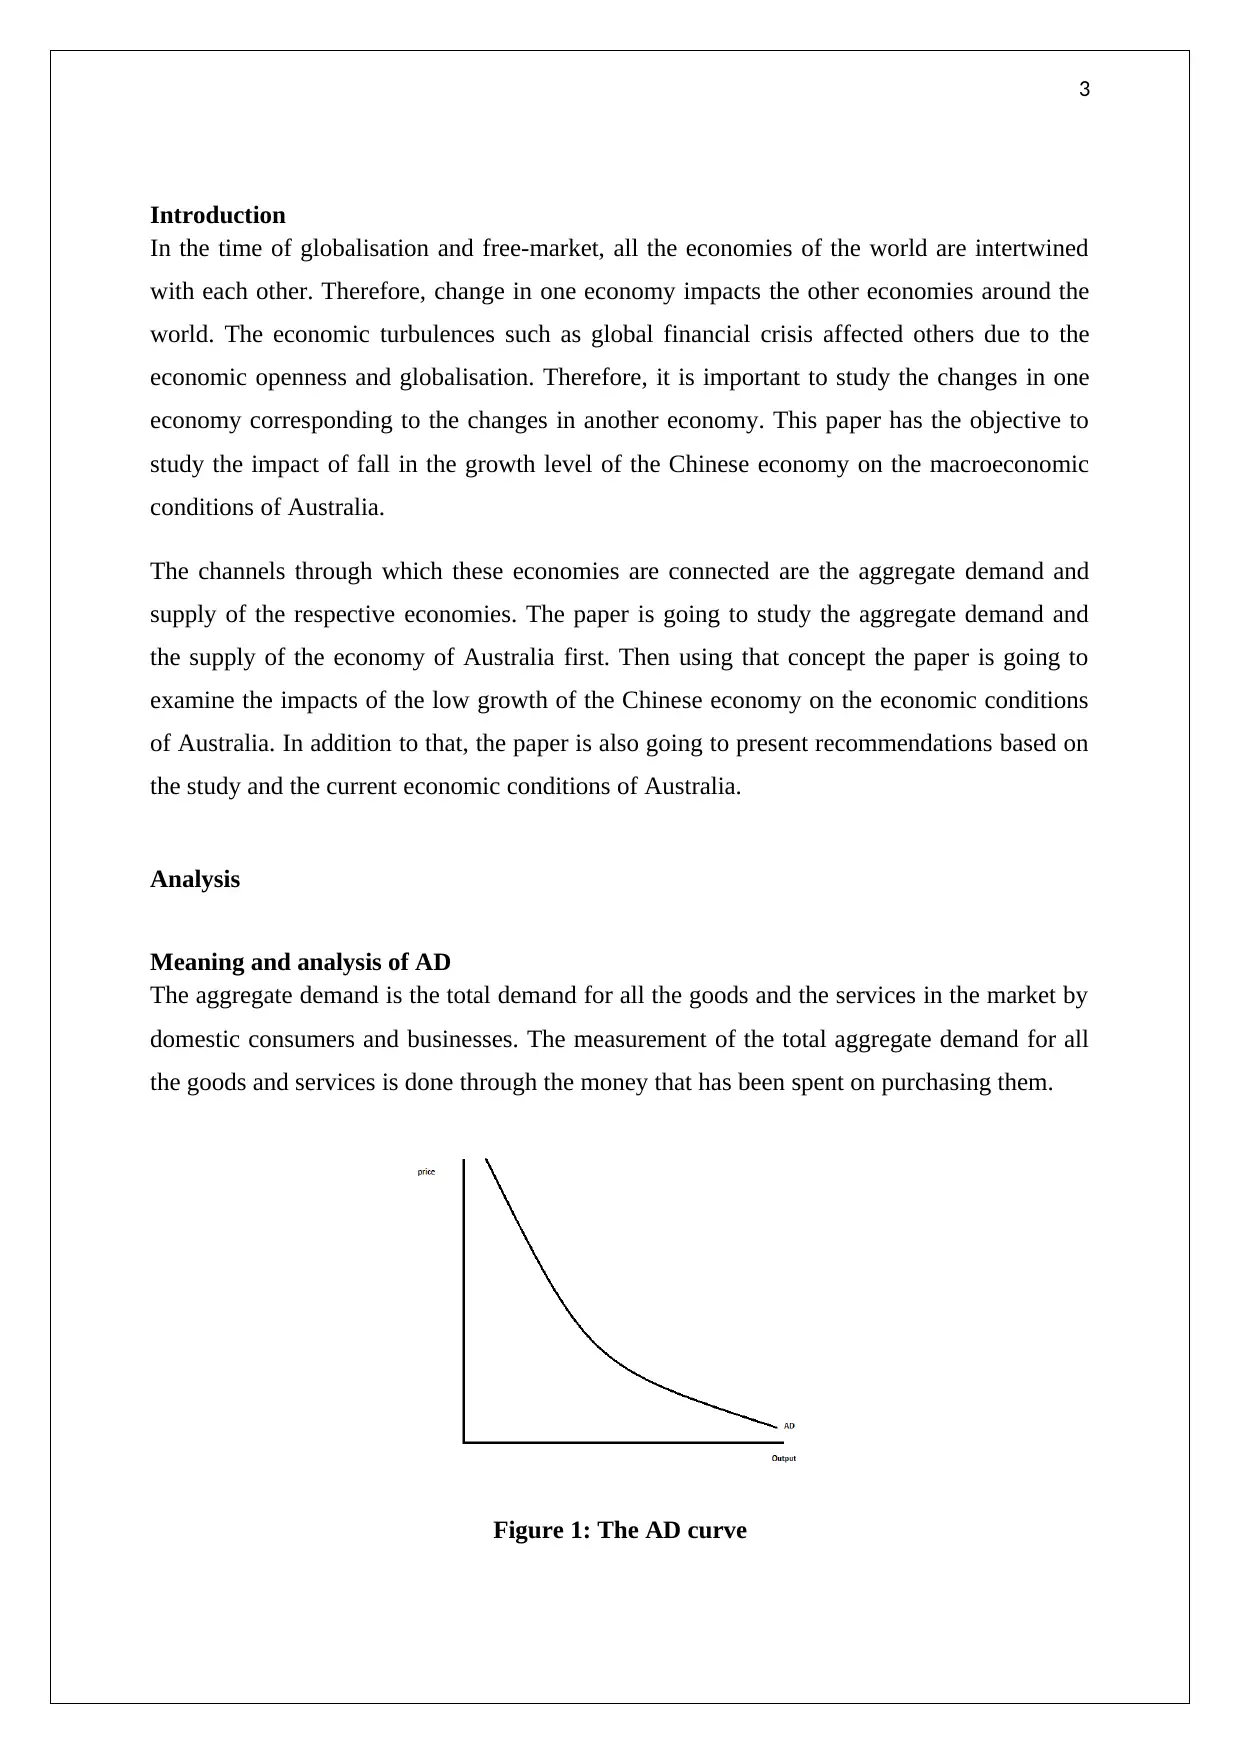
The aggregate demand is the total demand for all the goods and the services in the market by
domestic consumers and businesses. The measurement of the total aggregate demand for all
the goods and services is done through the money that has been spent on purchasing them.
Figure 1: The AD curve
Introduction
In the time of globalisation and free-market, all the economies of the world are intertwined
with each other. Therefore, change in one economy impacts the other economies around the
world. The economic turbulences such as global financial crisis affected others due to the
economic openness and globalisation. Therefore, it is important to study the changes in one
economy corresponding to the changes in another economy. This paper has the objective to
study the impact of fall in the growth level of the Chinese economy on the macroeconomic
conditions of Australia.
The channels through which these economies are connected are the aggregate demand and
supply of the respective economies. The paper is going to study the aggregate demand and
the supply of the economy of Australia first. Then using that concept the paper is going to
examine the impacts of the low growth of the Chinese economy on the economic conditions
of Australia. In addition to that, the paper is also going to present recommendations based on
the study and the current economic conditions of Australia.
Analysis
Meaning and analysis of AD
The aggregate demand is the total demand for all the goods and the services in the market by
domestic consumers and businesses. The measurement of the total aggregate demand for all
the goods and services is done through the money that has been spent on purchasing them.
Figure 1: The AD curve
4
(Source: Mathews & Tan, 2016)
The aggregate demand is a downward sloping curve as the demand for the overall goods and
services changes negatively with the price level of the economy. If the price level of goods
and services in the economy is low, the customers of the market would purchase more of any
product and hence the curve is downward sloping. Other than the price factor itself, the
aggregate demand curve is also influenced by the changes in external factors such as the
income of the consumers, tastes and preferences etc (Brugger, 2018). For example, if the
income per capita of the economy increases, the customers would buy more of each product
and hence the aggregate demand would shift to the right side.
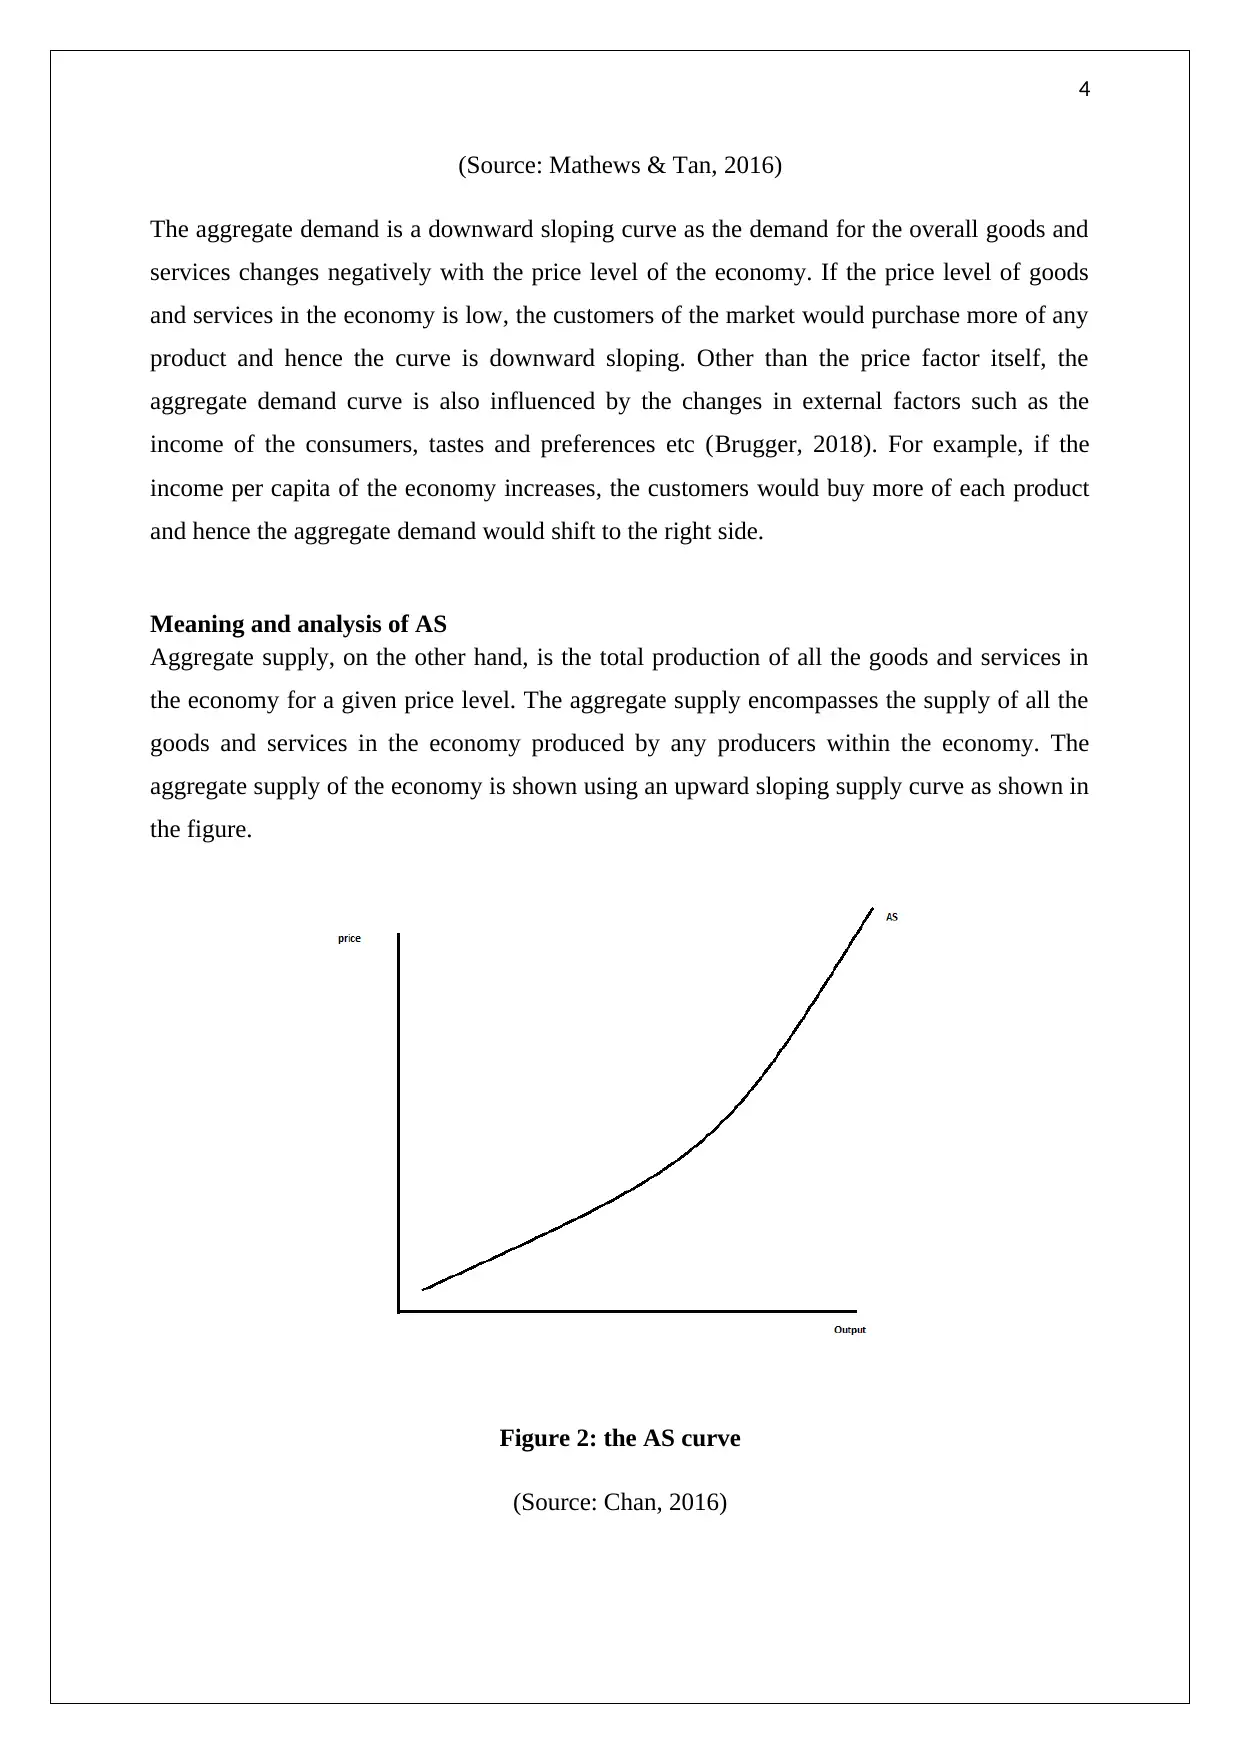
Meaning and analysis of AS
Aggregate supply, on the other hand, is the total production of all the goods and services in
the economy for a given price level. The aggregate supply encompasses the supply of all the
goods and services in the economy produced by any producers within the economy. The
aggregate supply of the economy is shown using an upward sloping supply curve as shown in
the figure.
Figure 2: the AS curve
(Source: Chan, 2016)
(Source: Mathews & Tan, 2016)
The aggregate demand is a downward sloping curve as the demand for the overall goods and
services changes negatively with the price level of the economy. If the price level of goods
and services in the economy is low, the customers of the market would purchase more of any
product and hence the curve is downward sloping. Other than the price factor itself, the
aggregate demand curve is also influenced by the changes in external factors such as the
income of the consumers, tastes and preferences etc (Brugger, 2018). For example, if the
income per capita of the economy increases, the customers would buy more of each product
and hence the aggregate demand would shift to the right side.
Meaning and analysis of AS
Aggregate supply, on the other hand, is the total production of all the goods and services in
the economy for a given price level. The aggregate supply encompasses the supply of all the
goods and services in the economy produced by any producers within the economy. The
aggregate supply of the economy is shown using an upward sloping supply curve as shown in
the figure.
Figure 2: the AS curve
(Source: Chan, 2016)
Secure Best Marks with AI Grader
Need help grading? Try our AI Grader for instant feedback on your assignments.
5
The aggregate supply curve is upward sloping as the producers of the economy produces
more with the rising price level. The aggregate supply curve also changes with the changes in
the external factors (Hamari, Sjöklint & Ukkonen, 2016). For example, if the technological
innovation enters the production facilities of the economy, the producers would be able to
produce more of goods and services for a given price level and the AS curve would shift to
the right side.
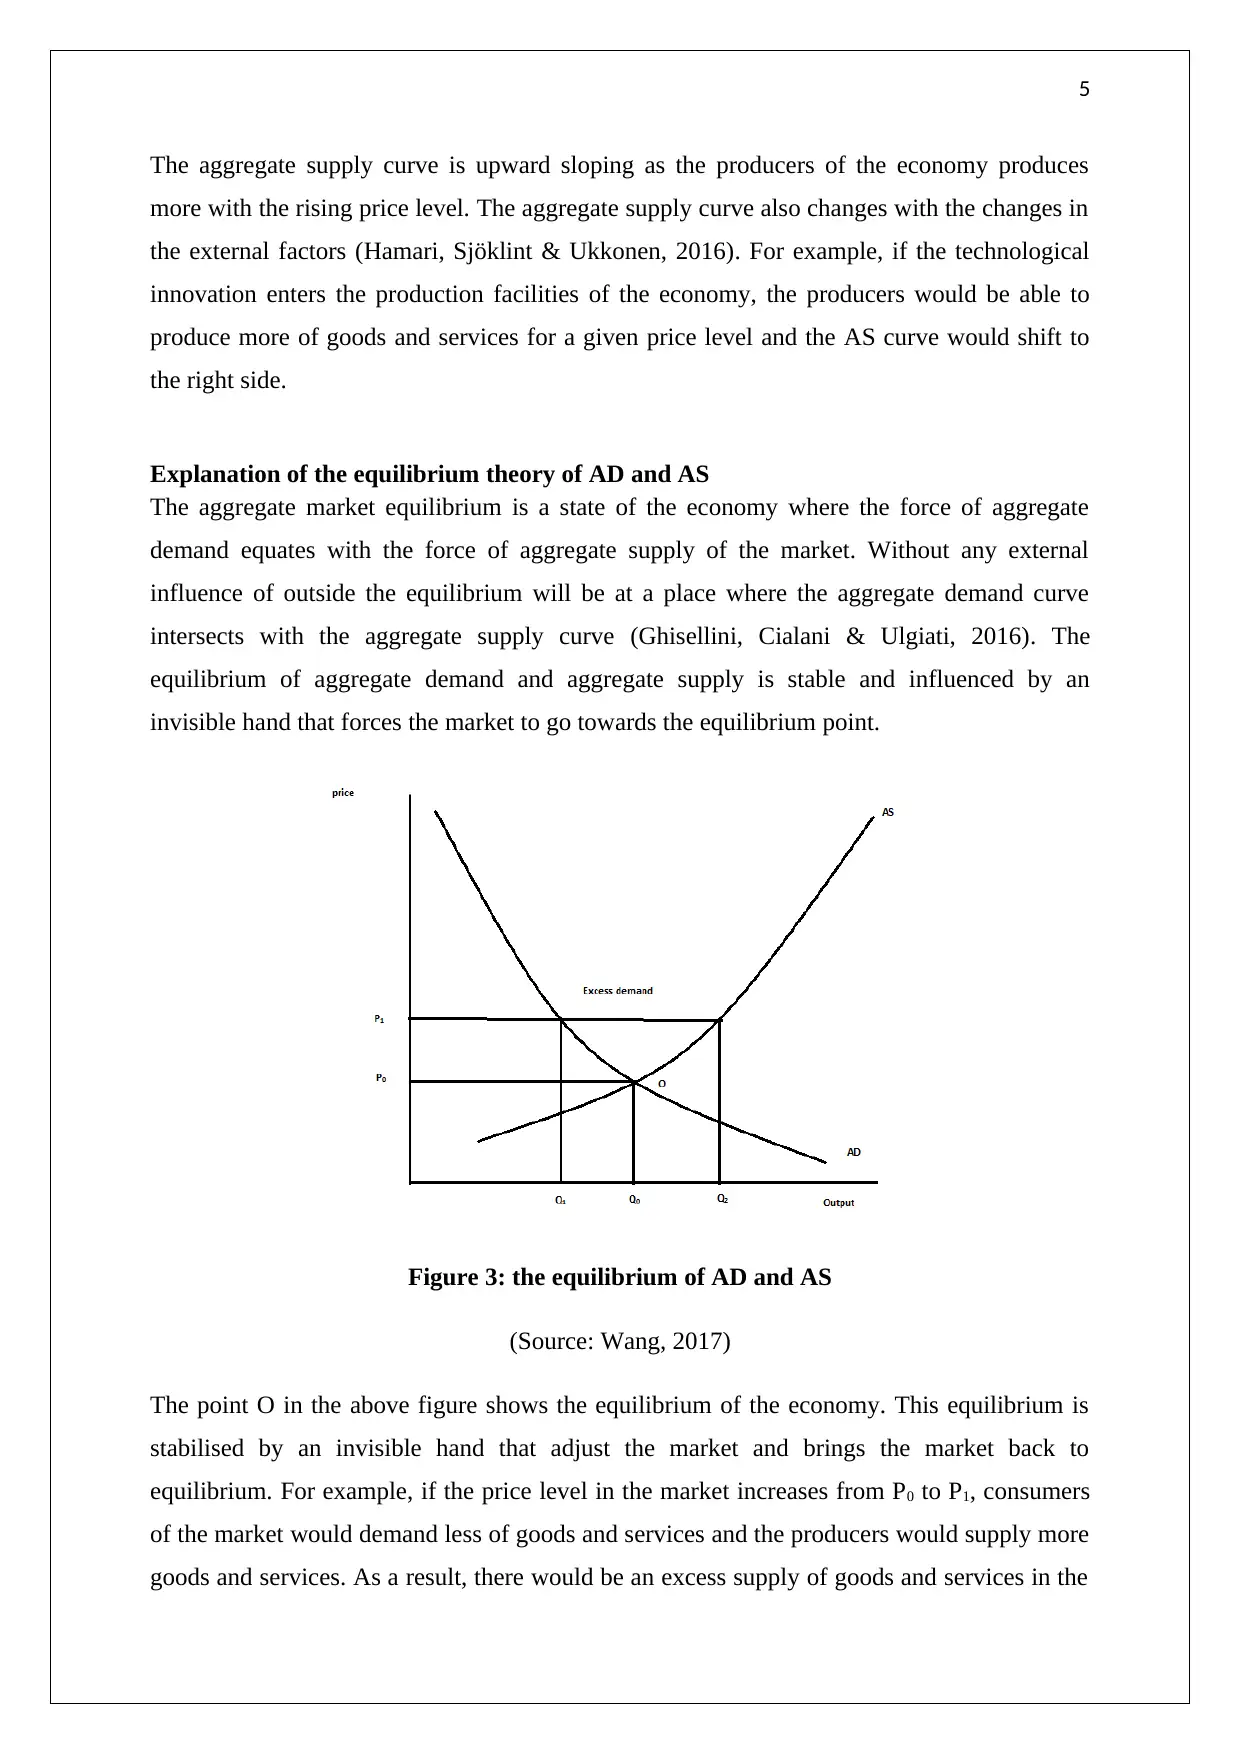
Explanation of the equilibrium theory of AD and AS
The aggregate market equilibrium is a state of the economy where the force of aggregate
demand equates with the force of aggregate supply of the market. Without any external
influence of outside the equilibrium will be at a place where the aggregate demand curve
intersects with the aggregate supply curve (Ghisellini, Cialani & Ulgiati, 2016). The
equilibrium of aggregate demand and aggregate supply is stable and influenced by an
invisible hand that forces the market to go towards the equilibrium point.
Figure 3: the equilibrium of AD and AS
(Source: Wang, 2017)
The point O in the above figure shows the equilibrium of the economy. This equilibrium is
stabilised by an invisible hand that adjust the market and brings the market back to
equilibrium. For example, if the price level in the market increases from P0 to P1, consumers
of the market would demand less of goods and services and the producers would supply more
goods and services. As a result, there would be an excess supply of goods and services in the
The aggregate supply curve is upward sloping as the producers of the economy produces
more with the rising price level. The aggregate supply curve also changes with the changes in
the external factors (Hamari, Sjöklint & Ukkonen, 2016). For example, if the technological
innovation enters the production facilities of the economy, the producers would be able to
produce more of goods and services for a given price level and the AS curve would shift to
the right side.
Explanation of the equilibrium theory of AD and AS
The aggregate market equilibrium is a state of the economy where the force of aggregate
demand equates with the force of aggregate supply of the market. Without any external
influence of outside the equilibrium will be at a place where the aggregate demand curve
intersects with the aggregate supply curve (Ghisellini, Cialani & Ulgiati, 2016). The
equilibrium of aggregate demand and aggregate supply is stable and influenced by an
invisible hand that forces the market to go towards the equilibrium point.
Figure 3: the equilibrium of AD and AS
(Source: Wang, 2017)
The point O in the above figure shows the equilibrium of the economy. This equilibrium is
stabilised by an invisible hand that adjust the market and brings the market back to
equilibrium. For example, if the price level in the market increases from P0 to P1, consumers
of the market would demand less of goods and services and the producers would supply more
goods and services. As a result, there would be an excess supply of goods and services in the
6
economy (Pan et al. 2015). The sellers of the market would not be able to sell off their
products if the prices are not reduced. Thus, the price will reduce until again the aggregate
demand and the aggregate supply equates in the economy.
Macroeconomic conditions in Australia
GDP of Australia
2010
2011
2012
2013
2014
2015
2016
2017
2018
2019
0
500000000000
1000000000000
1500000000000
2000000000000
GDP of australia
GDP
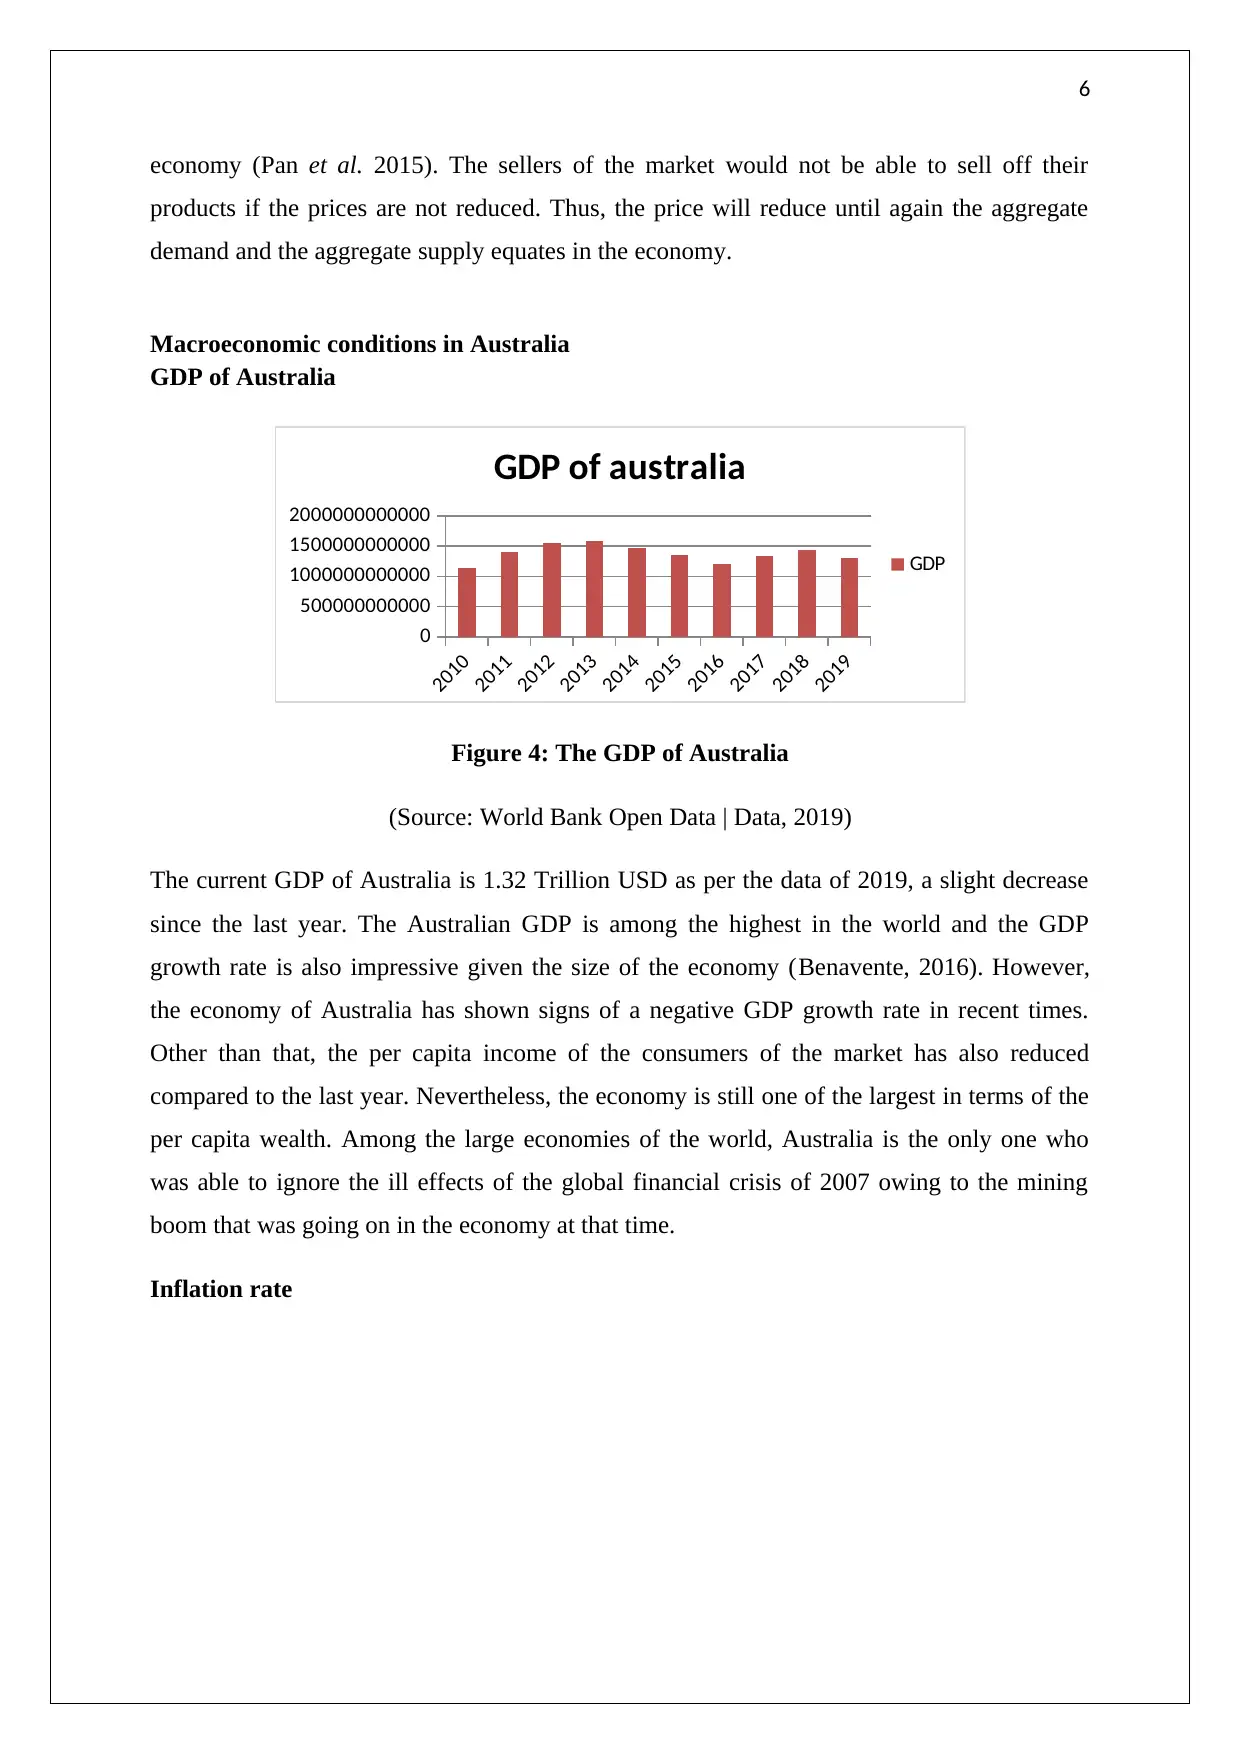
Figure 4: The GDP of Australia
(Source: World Bank Open Data | Data, 2019)
The current GDP of Australia is 1.32 Trillion USD as per the data of 2019, a slight decrease
since the last year. The Australian GDP is among the highest in the world and the GDP
growth rate is also impressive given the size of the economy (Benavente, 2016). However,
the economy of Australia has shown signs of a negative GDP growth rate in recent times.
Other than that, the per capita income of the consumers of the market has also reduced
compared to the last year. Nevertheless, the economy is still one of the largest in terms of the
per capita wealth. Among the large economies of the world, Australia is the only one who
was able to ignore the ill effects of the global financial crisis of 2007 owing to the mining
boom that was going on in the economy at that time.
Inflation rate
economy (Pan et al. 2015). The sellers of the market would not be able to sell off their
products if the prices are not reduced. Thus, the price will reduce until again the aggregate
demand and the aggregate supply equates in the economy.
Macroeconomic conditions in Australia
GDP of Australia
2010
2011
2012
2013
2014
2015
2016
2017
2018
2019
0
500000000000
1000000000000
1500000000000
2000000000000
GDP of australia
GDP
Figure 4: The GDP of Australia
(Source: World Bank Open Data | Data, 2019)
The current GDP of Australia is 1.32 Trillion USD as per the data of 2019, a slight decrease
since the last year. The Australian GDP is among the highest in the world and the GDP
growth rate is also impressive given the size of the economy (Benavente, 2016). However,
the economy of Australia has shown signs of a negative GDP growth rate in recent times.
Other than that, the per capita income of the consumers of the market has also reduced
compared to the last year. Nevertheless, the economy is still one of the largest in terms of the
per capita wealth. Among the large economies of the world, Australia is the only one who
was able to ignore the ill effects of the global financial crisis of 2007 owing to the mining
boom that was going on in the economy at that time.
Inflation rate
7
2010 2011 2012 2013 2014 2015 2016 2017 2018 2019 Aug-
19
0
0.5
1
1.5
2
2.5
3
3.5
Inflation rate
Inflation rate
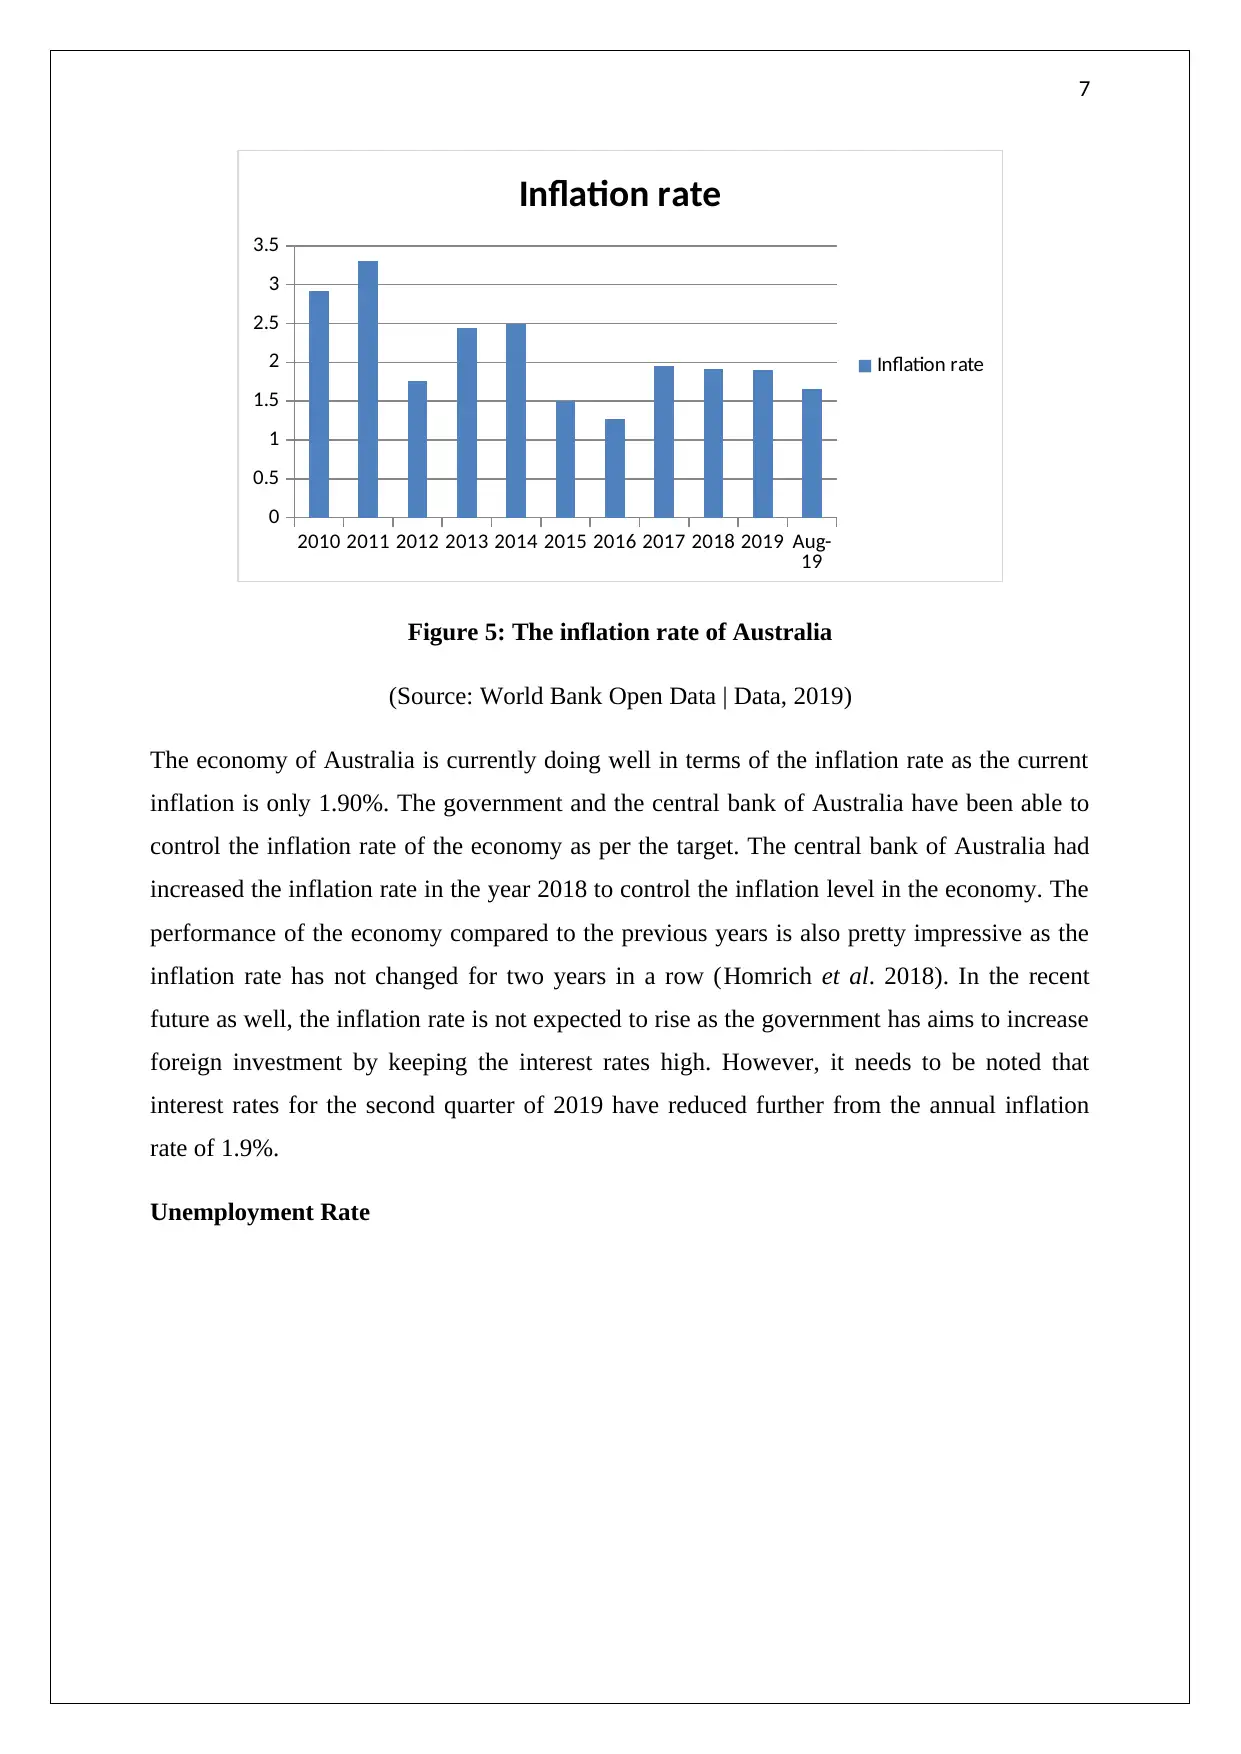
Figure 5: The inflation rate of Australia
(Source: World Bank Open Data | Data, 2019)
The economy of Australia is currently doing well in terms of the inflation rate as the current
inflation is only 1.90%. The government and the central bank of Australia have been able to
control the inflation rate of the economy as per the target. The central bank of Australia had
increased the inflation rate in the year 2018 to control the inflation level in the economy. The
performance of the economy compared to the previous years is also pretty impressive as the
inflation rate has not changed for two years in a row (Homrich et al. 2018). In the recent
future as well, the inflation rate is not expected to rise as the government has aims to increase
foreign investment by keeping the interest rates high. However, it needs to be noted that
interest rates for the second quarter of 2019 have reduced further from the annual inflation
rate of 1.9%.
Unemployment Rate
2010 2011 2012 2013 2014 2015 2016 2017 2018 2019 Aug-
19
0
0.5
1
1.5
2
2.5
3
3.5
Inflation rate
Inflation rate
Figure 5: The inflation rate of Australia
(Source: World Bank Open Data | Data, 2019)
The economy of Australia is currently doing well in terms of the inflation rate as the current
inflation is only 1.90%. The government and the central bank of Australia have been able to
control the inflation rate of the economy as per the target. The central bank of Australia had
increased the inflation rate in the year 2018 to control the inflation level in the economy. The
performance of the economy compared to the previous years is also pretty impressive as the
inflation rate has not changed for two years in a row (Homrich et al. 2018). In the recent
future as well, the inflation rate is not expected to rise as the government has aims to increase
foreign investment by keeping the interest rates high. However, it needs to be noted that
interest rates for the second quarter of 2019 have reduced further from the annual inflation
rate of 1.9%.
Unemployment Rate
Paraphrase This Document
Need a fresh take? Get an instant paraphrase of this document with our AI Paraphraser
8
2010
2011
2012
2013
2014
2015
2016
2017
2018
2019
Aug-19
4.4
4.6
4.8
5
5.2
5.4
5.6
5.8
6
6.2
Unemployment rate of australia
Unemployment rate
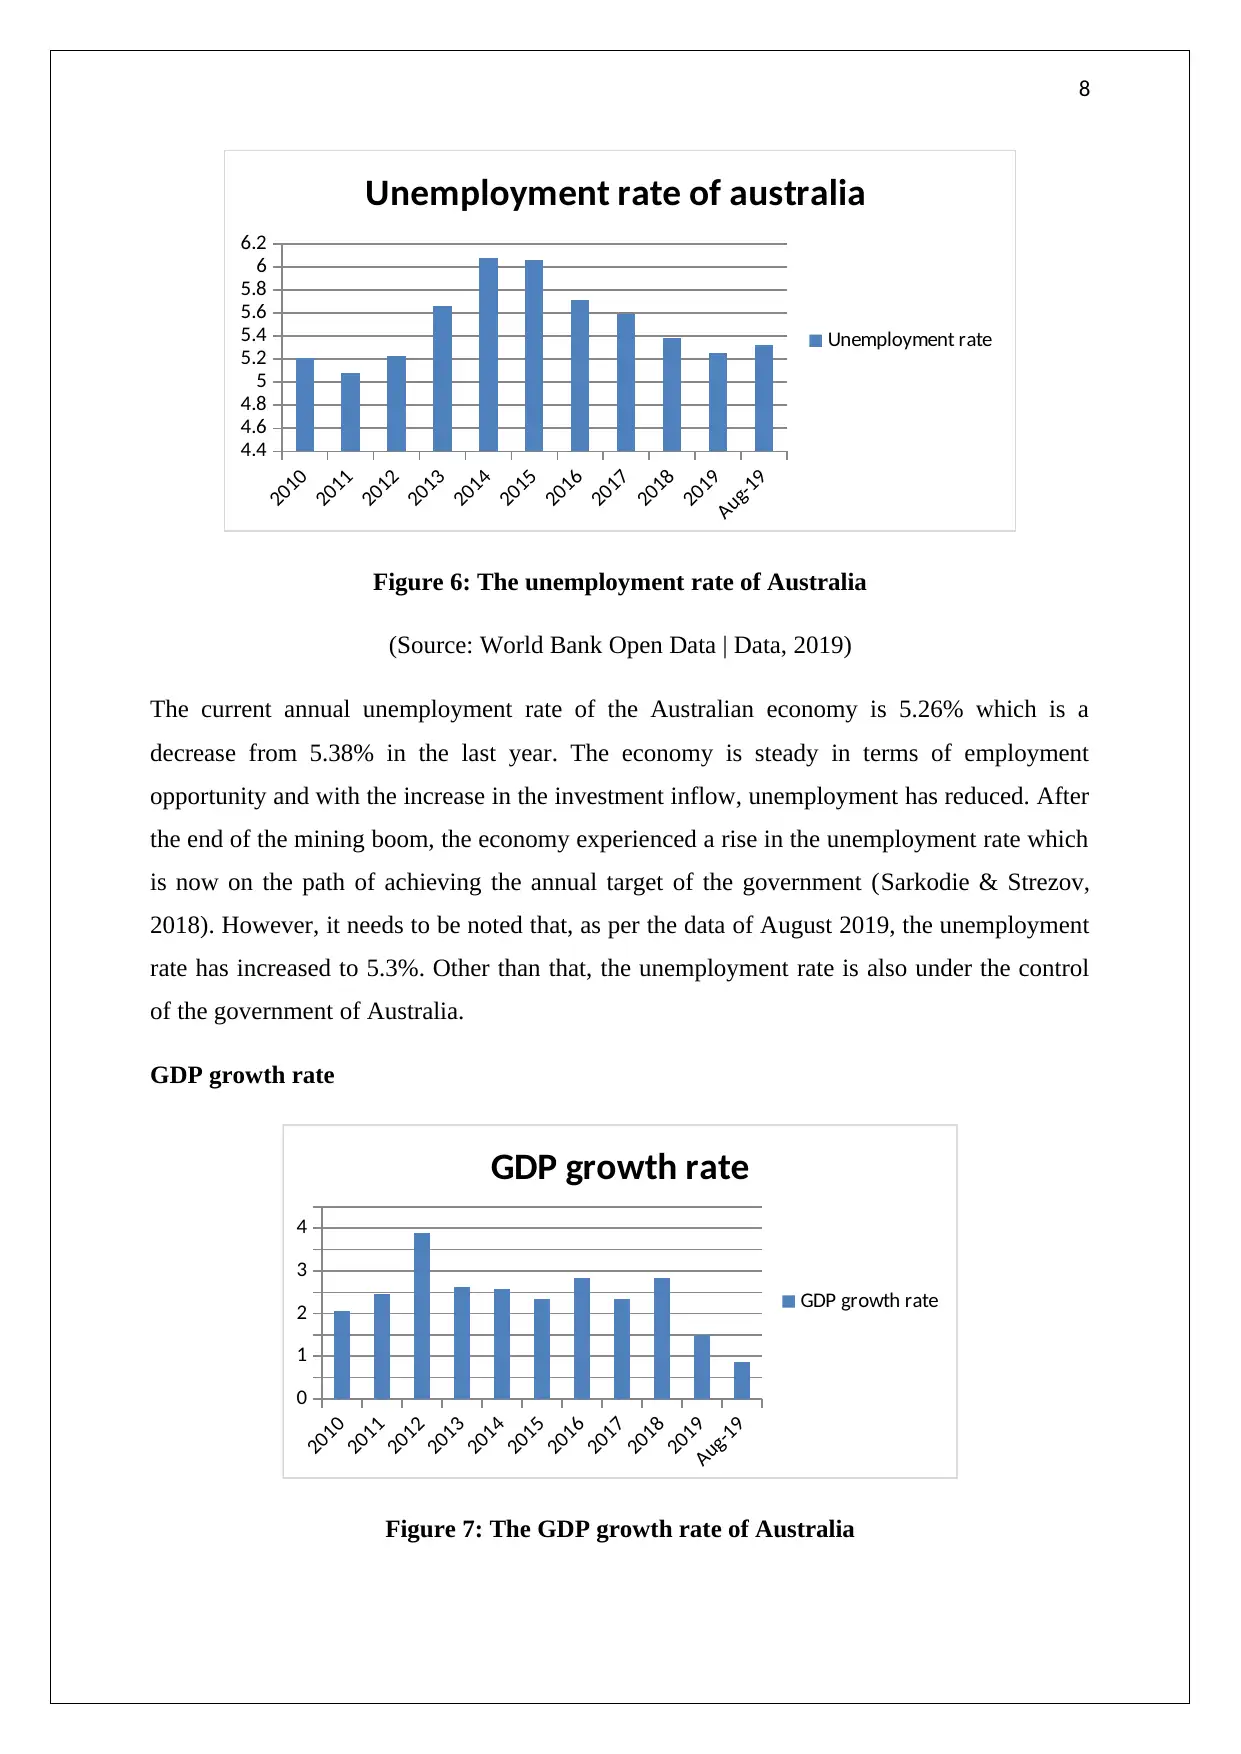
Figure 6: The unemployment rate of Australia
(Source: World Bank Open Data | Data, 2019)
The current annual unemployment rate of the Australian economy is 5.26% which is a
decrease from 5.38% in the last year. The economy is steady in terms of employment
opportunity and with the increase in the investment inflow, unemployment has reduced. After
the end of the mining boom, the economy experienced a rise in the unemployment rate which
is now on the path of achieving the annual target of the government (Sarkodie & Strezov,
2018). However, it needs to be noted that, as per the data of August 2019, the unemployment
rate has increased to 5.3%. Other than that, the unemployment rate is also under the control
of the government of Australia.
GDP growth rate
2010
2011
2012
2013
2014
2015
2016
2017
2018
2019
Aug-19
0
1
2
3
4
GDP growth rate
GDP growth rate
Figure 7: The GDP growth rate of Australia
2010
2011
2012
2013
2014
2015
2016
2017
2018
2019
Aug-19
4.4
4.6
4.8
5
5.2
5.4
5.6
5.8
6
6.2
Unemployment rate of australia
Unemployment rate
Figure 6: The unemployment rate of Australia
(Source: World Bank Open Data | Data, 2019)
The current annual unemployment rate of the Australian economy is 5.26% which is a
decrease from 5.38% in the last year. The economy is steady in terms of employment
opportunity and with the increase in the investment inflow, unemployment has reduced. After
the end of the mining boom, the economy experienced a rise in the unemployment rate which
is now on the path of achieving the annual target of the government (Sarkodie & Strezov,
2018). However, it needs to be noted that, as per the data of August 2019, the unemployment
rate has increased to 5.3%. Other than that, the unemployment rate is also under the control
of the government of Australia.
GDP growth rate
2010
2011
2012
2013
2014
2015
2016
2017
2018
2019
Aug-19
0
1
2
3
4
GDP growth rate
GDP growth rate
Figure 7: The GDP growth rate of Australia
9
(Source: World Bank Open Data | Data, 2019)
The GDP growth rate of Australia is very low at the moment as the growth rate is 0.8% as per
the value of the august 2019. The growth rate of the economy was higher even at the
beginning of the year. Despite the increase in investment inflow, the GDP is not growing at a
pace that was forecasted by the central bank of Australia (Packey & Kingsnorth, 2016). The
government may have to reduce the interest rate in the future to boost the growth rate of the
economy. Despite these low figures, the GDP growth rate of Australia is higher than most of
the other developed economies of the world. The decrease in the growth rate of Australia can
be due to reasons such as the low aggregate demand for goods and services in the market.
Apart from that, it can also be due to the lack of money supply in the domestic economy.
Fall in the rate of growth of the Chinese economy and its impacts
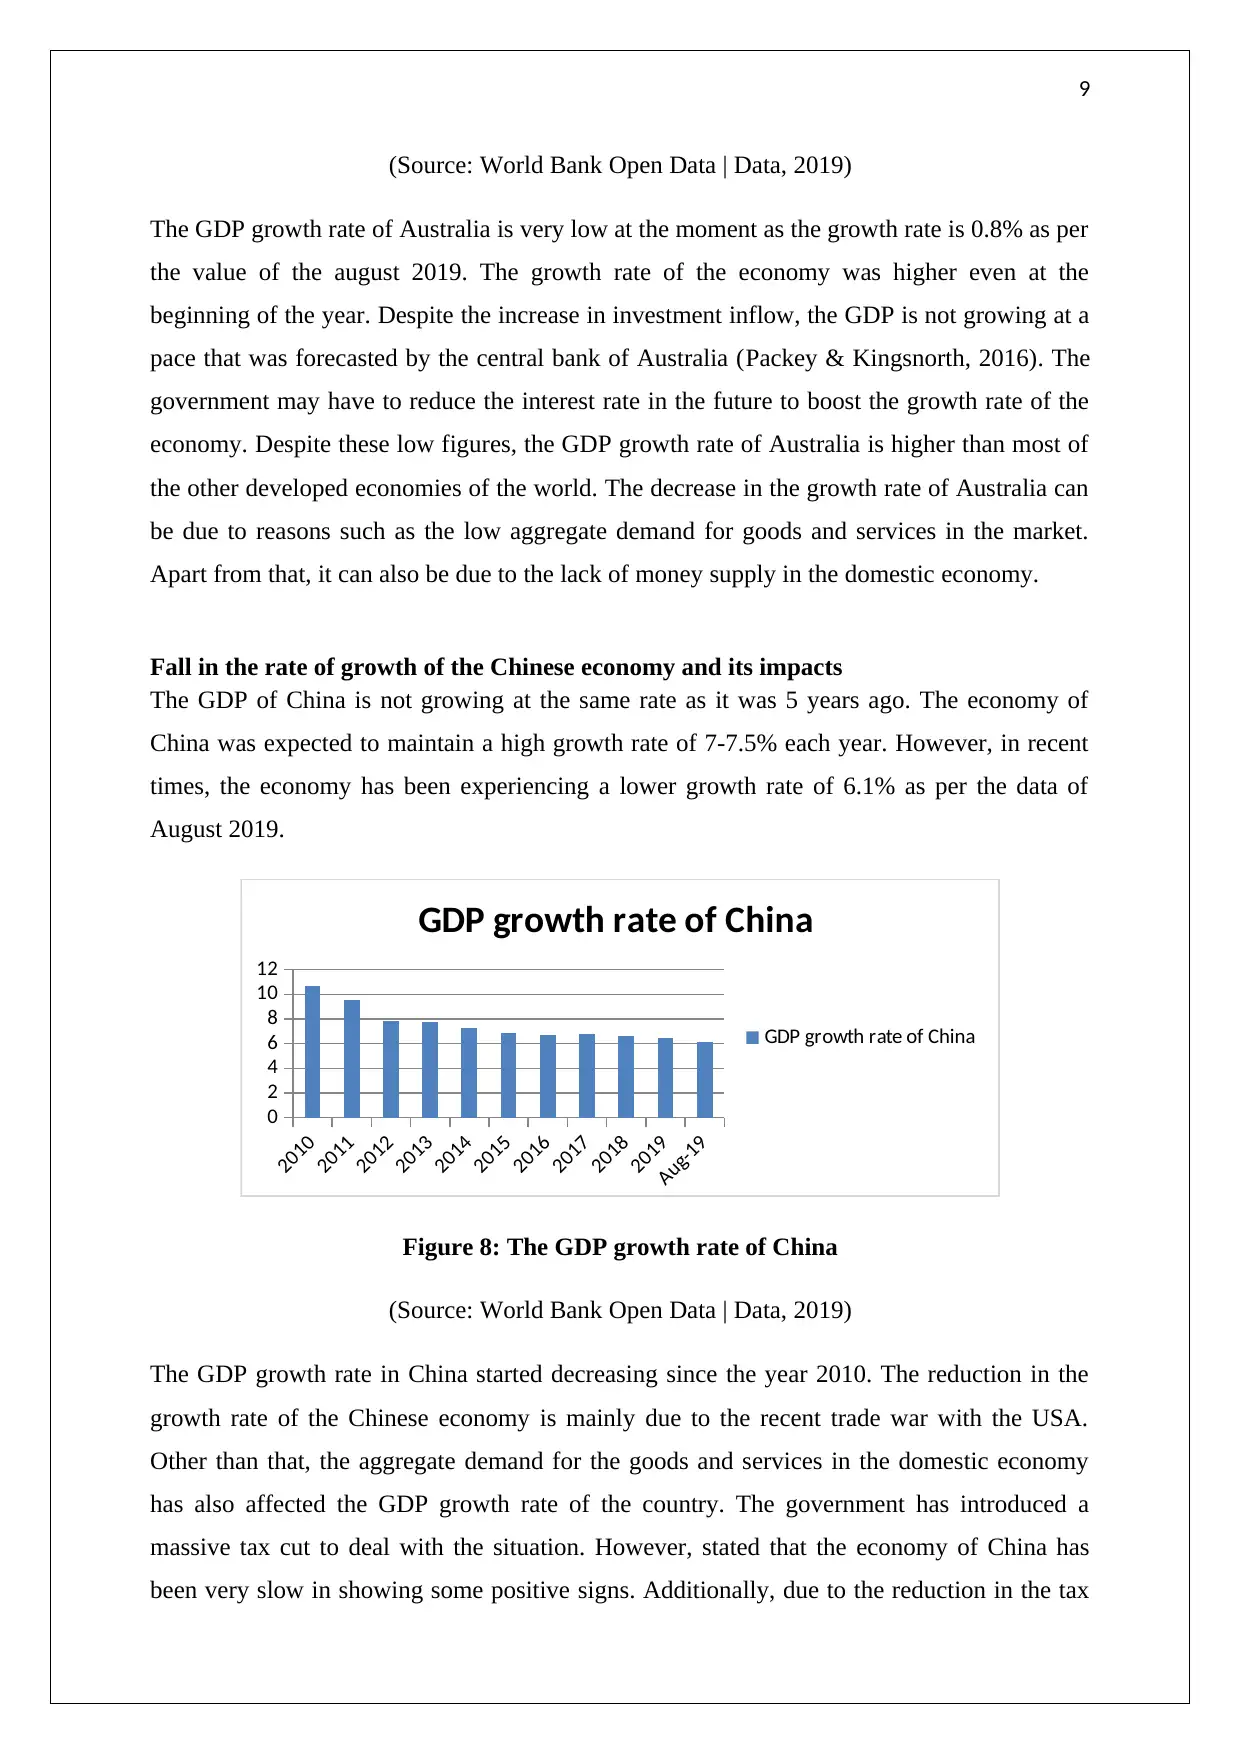
The GDP of China is not growing at the same rate as it was 5 years ago. The economy of
China was expected to maintain a high growth rate of 7-7.5% each year. However, in recent
times, the economy has been experiencing a lower growth rate of 6.1% as per the data of
August 2019.
2010
2011
2012
2013
2014
2015
2016
2017
2018
2019
Aug-19
0
2
4
6
8
10
12
GDP growth rate of China
GDP growth rate of China
Figure 8: The GDP growth rate of China
(Source: World Bank Open Data | Data, 2019)
The GDP growth rate in China started decreasing since the year 2010. The reduction in the
growth rate of the Chinese economy is mainly due to the recent trade war with the USA.
Other than that, the aggregate demand for the goods and services in the domestic economy
has also affected the GDP growth rate of the country. The government has introduced a
massive tax cut to deal with the situation. However, stated that the economy of China has
been very slow in showing some positive signs. Additionally, due to the reduction in the tax
(Source: World Bank Open Data | Data, 2019)
The GDP growth rate of Australia is very low at the moment as the growth rate is 0.8% as per
the value of the august 2019. The growth rate of the economy was higher even at the
beginning of the year. Despite the increase in investment inflow, the GDP is not growing at a
pace that was forecasted by the central bank of Australia (Packey & Kingsnorth, 2016). The
government may have to reduce the interest rate in the future to boost the growth rate of the
economy. Despite these low figures, the GDP growth rate of Australia is higher than most of
the other developed economies of the world. The decrease in the growth rate of Australia can
be due to reasons such as the low aggregate demand for goods and services in the market.
Apart from that, it can also be due to the lack of money supply in the domestic economy.
Fall in the rate of growth of the Chinese economy and its impacts
The GDP of China is not growing at the same rate as it was 5 years ago. The economy of
China was expected to maintain a high growth rate of 7-7.5% each year. However, in recent
times, the economy has been experiencing a lower growth rate of 6.1% as per the data of
August 2019.
2010
2011
2012
2013
2014
2015
2016
2017
2018
2019
Aug-19
0
2
4
6
8
10
12
GDP growth rate of China
GDP growth rate of China
Figure 8: The GDP growth rate of China
(Source: World Bank Open Data | Data, 2019)
The GDP growth rate in China started decreasing since the year 2010. The reduction in the
growth rate of the Chinese economy is mainly due to the recent trade war with the USA.
Other than that, the aggregate demand for the goods and services in the domestic economy
has also affected the GDP growth rate of the country. The government has introduced a
massive tax cut to deal with the situation. However, stated that the economy of China has
been very slow in showing some positive signs. Additionally, due to the reduction in the tax
10
revenue of the government, infrastructure development has halted for time being that can
further affect the GDP growth rate in the long run.
The downturn and slowness of the Chinese economy have also impacted the economy of
Australia as well. As can be seen from the current performance of the economic indicators of
Australia, it was already under the influence of the changes in the Chinese economy. The
main reason for the impact is the fact that China is among the largest trade partners of
Australia. The decrease in the per capita income leading to higher interest rate has reduced
the demand for the goods exported from Australia (Liu & Lu, 2015). Therefore, the net
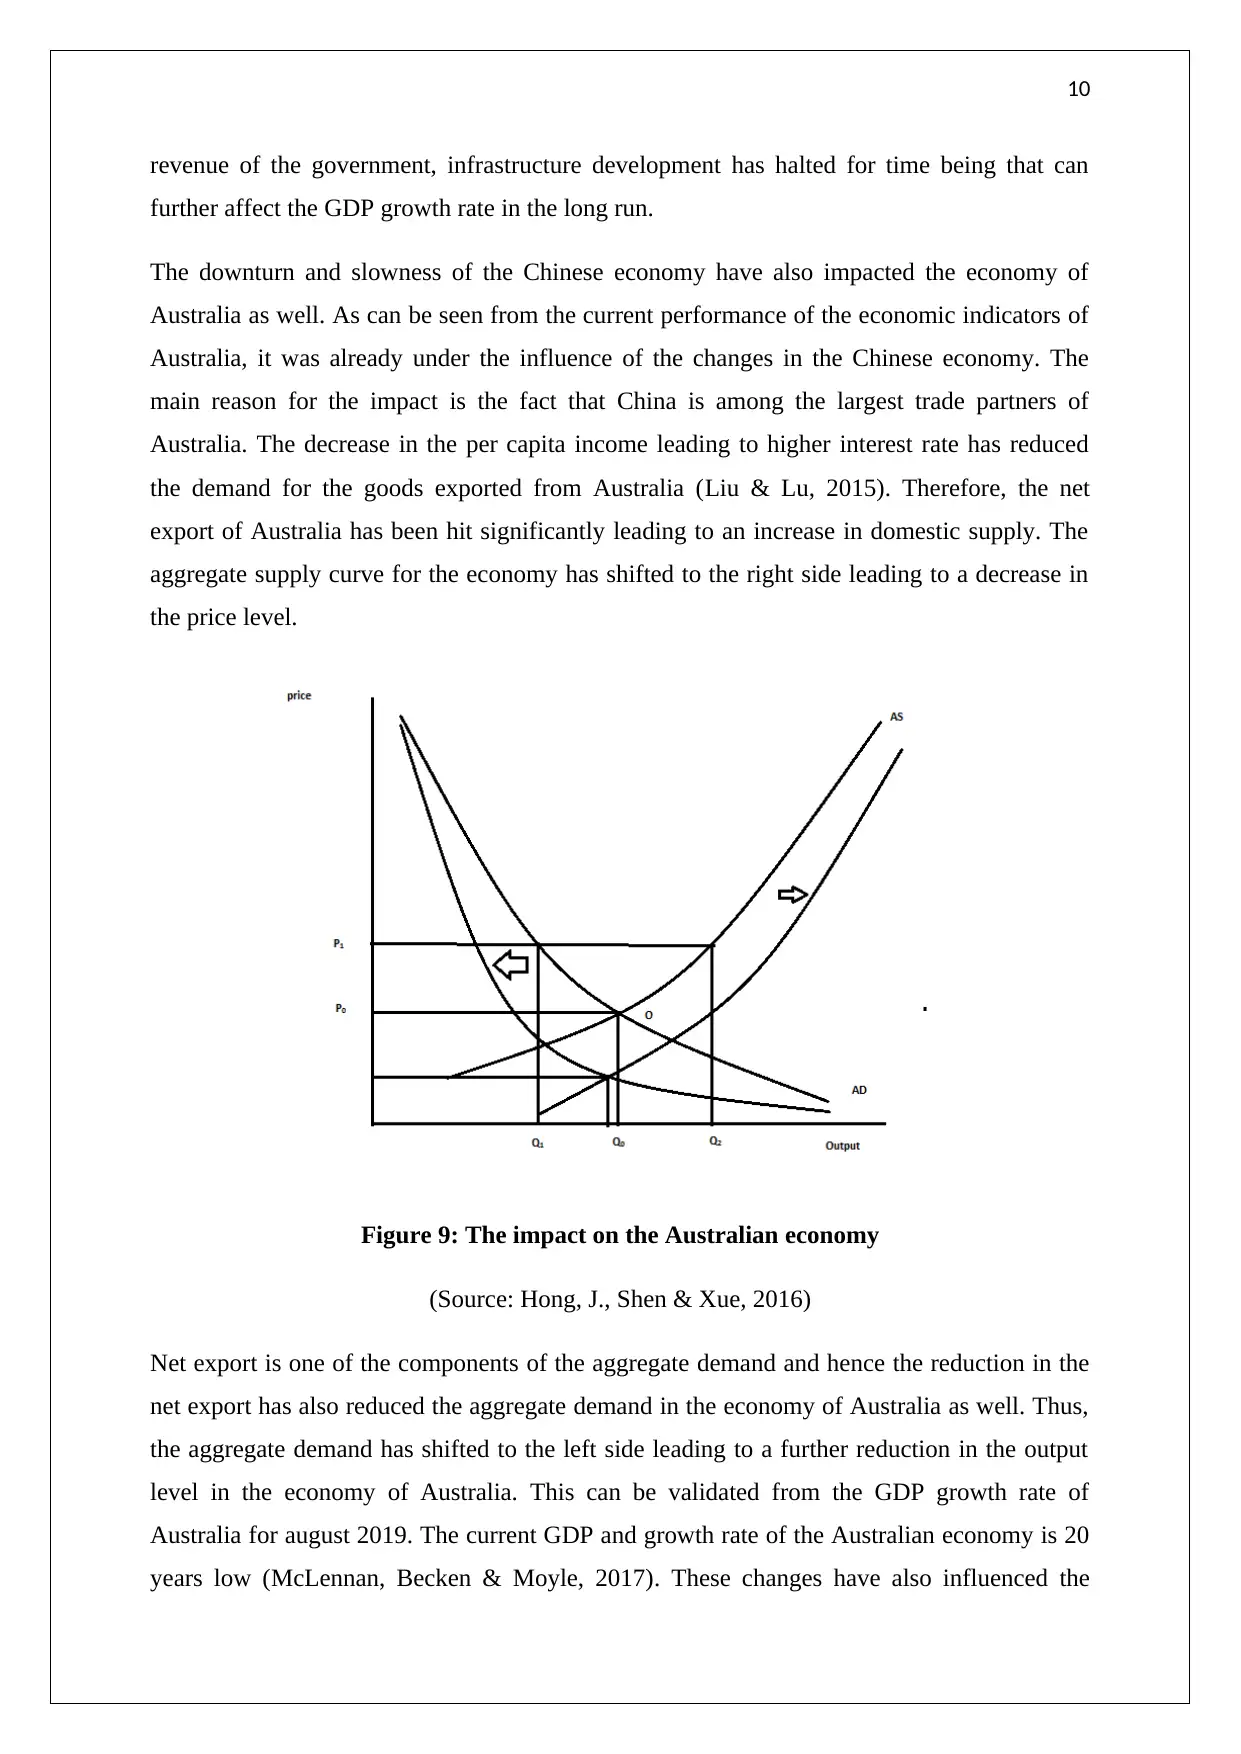
export of Australia has been hit significantly leading to an increase in domestic supply. The
aggregate supply curve for the economy has shifted to the right side leading to a decrease in
the price level.
Figure 9: The impact on the Australian economy
(Source: Hong, J., Shen & Xue, 2016)
Net export is one of the components of the aggregate demand and hence the reduction in the
net export has also reduced the aggregate demand in the economy of Australia as well. Thus,
the aggregate demand has shifted to the left side leading to a further reduction in the output
level in the economy of Australia. This can be validated from the GDP growth rate of
Australia for august 2019. The current GDP and growth rate of the Australian economy is 20
years low (McLennan, Becken & Moyle, 2017). These changes have also influenced the
revenue of the government, infrastructure development has halted for time being that can
further affect the GDP growth rate in the long run.
The downturn and slowness of the Chinese economy have also impacted the economy of
Australia as well. As can be seen from the current performance of the economic indicators of
Australia, it was already under the influence of the changes in the Chinese economy. The
main reason for the impact is the fact that China is among the largest trade partners of
Australia. The decrease in the per capita income leading to higher interest rate has reduced
the demand for the goods exported from Australia (Liu & Lu, 2015). Therefore, the net
export of Australia has been hit significantly leading to an increase in domestic supply. The
aggregate supply curve for the economy has shifted to the right side leading to a decrease in
the price level.
Figure 9: The impact on the Australian economy
(Source: Hong, J., Shen & Xue, 2016)
Net export is one of the components of the aggregate demand and hence the reduction in the
net export has also reduced the aggregate demand in the economy of Australia as well. Thus,
the aggregate demand has shifted to the left side leading to a further reduction in the output
level in the economy of Australia. This can be validated from the GDP growth rate of
Australia for august 2019. The current GDP and growth rate of the Australian economy is 20
years low (McLennan, Becken & Moyle, 2017). These changes have also influenced the
Secure Best Marks with AI Grader
Need help grading? Try our AI Grader for instant feedback on your assignments.
11
unemployment rate in the economy as well. The unemployment rate has increased since the
start of the year and is a sign of a downturn in the economy of Australia as well. Given the
interest rate of the economy is already low, the number of options left to the government for
bringing the economy back is very less. The economy of Australia will continue to get
affected until the trade war between the USA and China is not stopped.
Conclusion and recommendations
Therefore the economy of Australia is impacted by the changes in the economy of China. The
economic slowdown of China directly impacts the aggregate demand and supply in the
Australian economy. The reason behind this repercussion is the trade relationship between
the two countries which have been affected by the trade war between China and the USA.
Based on the study of the Australian economy and the impacts of the changes in the Chinese
economy it is recommended to the government to increase the money supply by issuing
government security bonds. In this situation, if the interest rate is reduced the growth will be
compromised further. In addition to that, it is also recommended to the government to reduce
the tax rate in the economy so that the disposable income of the consumers can be increased.
This can further increase the aggregate demand for the goods and the services in the economy
leading to a rise in price level and output. This will enable the economy of Australia to
bounce back and achieve the GDP growth level like before.
12
Reference
Benavente, J. M. G. (2016). Impact of a carbon tax on the Chilean economy: A computable
general equilibrium analysis. Energy Economics, 57, 106-127.
Brugger, B. (2018). Chinese Marxism in Flux 1978-84: Essays on Epistemology, Ideology
and Political Economy. Routledge.
Chan, A. (2016). China's Workers Under Assault: Exploitation and Abuse in a Globalizing
Economy: Exploitation and Abuse in a Globalizing Economy. Routledge.
Ghisellini, P., Cialani, C., & Ulgiati, S. (2016). A review on circular economy: the expected
transition to a balanced interplay of environmental and economic systems. Journal of Cleaner
production, 114, 11-32.
Hamari, J., Sjöklint, M., & Ukkonen, A. (2016). The sharing economy: Why people
participate in collaborative consumption. Journal of the association for information science
and technology, 67(9), 2047-2059.
Homrich, A. S., Galvao, G., Abadia, L. G., & Carvalho, M. M. (2018). The circular economy
umbrella: Trends and gaps on integrating pathways. Journal of Cleaner Production, 175,
525-543.
Hong, J., Shen, Q., & Xue, F. (2016). A multi-regional structural path analysis of the energy
supply chain in China's construction industry. Energy Policy, 92, 56-68.
Liu, Y., & Lu, Y. (2015). The economic impact of different carbon tax revenue recycling
schemes in China: A model-based scenario analysis. Applied Energy, 141, 96-105.
Mathews, J. A., & Tan, H. (2016). Circular economy: lessons from China. Nature
News, 531(7595), 440.
McLennan, C. L. J., Becken, S., & Moyle, B. D. (2017). Framing in a contested space: media
reporting on tourism and mining in Australia. Current Issues in Tourism, 20(9), 960-980.
Packey, D. J., & Kingsnorth, D. (2016). The impact of unregulated ionic clay rare earth
mining in China. Resources Policy, 48, 112-116.
13
Pan, S. Y., Du, M. A., Huang, I. T., Liu, I. H., Chang, E. E., & Chiang, P. C. (2015).
Strategies on implementation of waste-to-energy (WTE) supply chain for circular economy
system: a review. Journal of Cleaner Production, 108, 409-421.
Sarkodie, S. A., & Strezov, V. (2018). Empirical study of the environmental Kuznets curve
and environmental sustainability curve hypothesis for Australia, China, Ghana and
USA. Journal of cleaner production, 201, 98-110.
Wang, Y. (2017). An industrial ecology virtual framework for policy making in
China. Economic Systems Research, 29(2), 252-274.
World Bank Open Data | Data. (2019). Retrieved 22 September 2019, from
https://data.worldbank.org/
1 out of 13
Related Documents


Your All-in-One AI-Powered Toolkit for Academic Success.
+13062052269
info@desklib.com
Available 24*7 on WhatsApp / Email
![[object Object]](/_next/static/media/star-bottom.7253800d.svg)
Unlock your academic potential
© 2024 | Zucol Services PVT LTD | All rights reserved.