Statistics Problems: FVC, Height, Regression, T-Test
VerifiedAdded on 2021/06/16
|18
|5401
|13
Homework Assignment
AI Summary
This assignment presents a detailed statistical analysis, beginning with the calculation of Pearson correlation between FVC and height, including confidence intervals. It proceeds to build a linear regression model of FVC on height, discussing model significance, R-squared, and ANOVA results. Furthermore, the assignment calculates predicted FVC values and confidence intervals for specific heights. An independent samples t-test is performed to compare mean FVC values between men and women, followed by the comparison of the mean FVC values from both the t-test and the regression model. Finally, the assignment analyses the proportion of alcoholic cases in emergency departments across Australia and New Zealand using cross-tabulation and chi-square tests. The document includes SPSS output tables and relevant references to support the analysis.
1
Statistics Problems
Student Name: Student ID:
Due Date: Unit Name:
Statistics Problems
Student Name: Student ID:
Due Date: Unit Name:
Paraphrase This Document
Need a fresh take? Get an instant paraphrase of this document with our AI Paraphraser
2
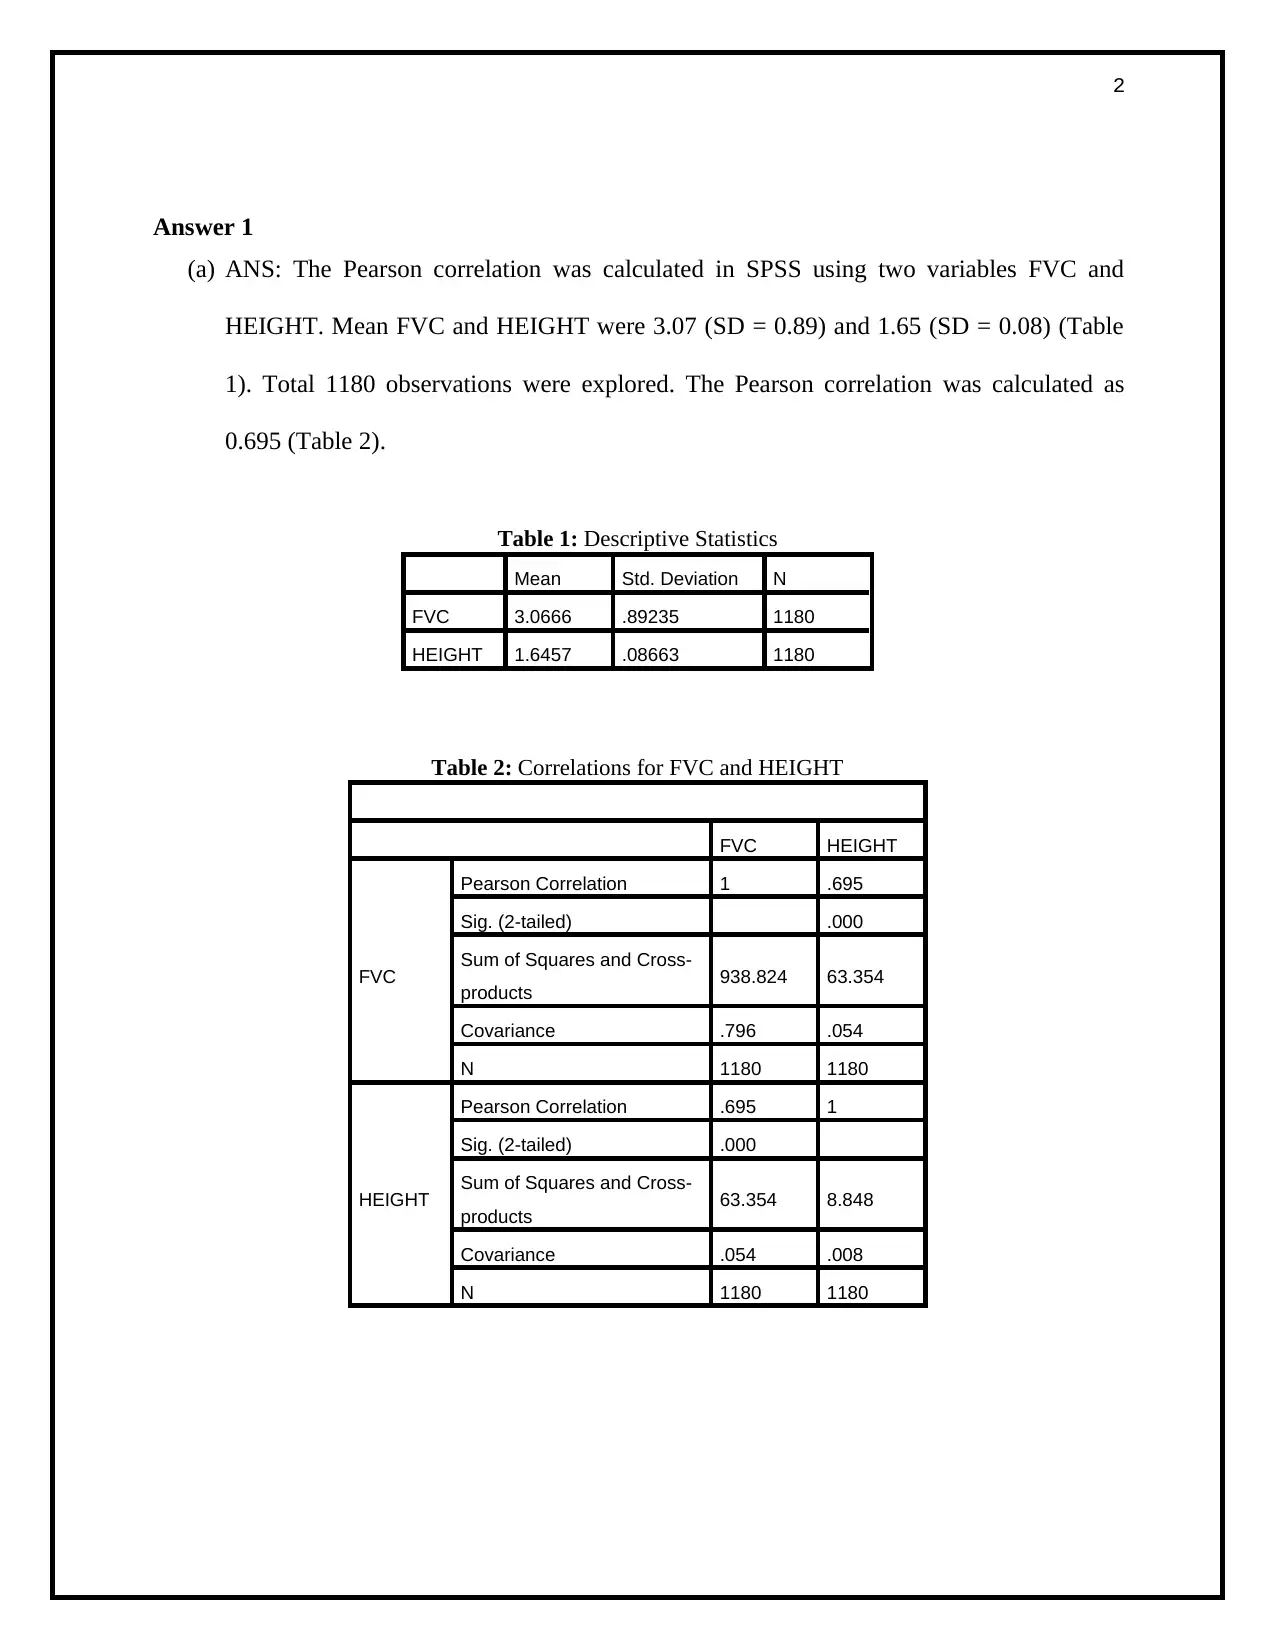
Answer 1
(a) ANS: The Pearson correlation was calculated in SPSS using two variables FVC and
HEIGHT. Mean FVC and HEIGHT were 3.07 (SD = 0.89) and 1.65 (SD = 0.08) (Table
1). Total 1180 observations were explored. The Pearson correlation was calculated as
0.695 (Table 2).
Table 1: Descriptive Statistics
Mean Std. Deviation N
FVC 3.0666 .89235 1180
HEIGHT 1.6457 .08663 1180
Table 2: Correlations for FVC and HEIGHT
FVC HEIGHT
FVC
Pearson Correlation 1 .695
Sig. (2-tailed) .000
Sum of Squares and Cross-
products 938.824 63.354
Covariance .796 .054
N 1180 1180
HEIGHT
Pearson Correlation .695 1
Sig. (2-tailed) .000
Sum of Squares and Cross-
products 63.354 8.848
Covariance .054 .008
N 1180 1180
3
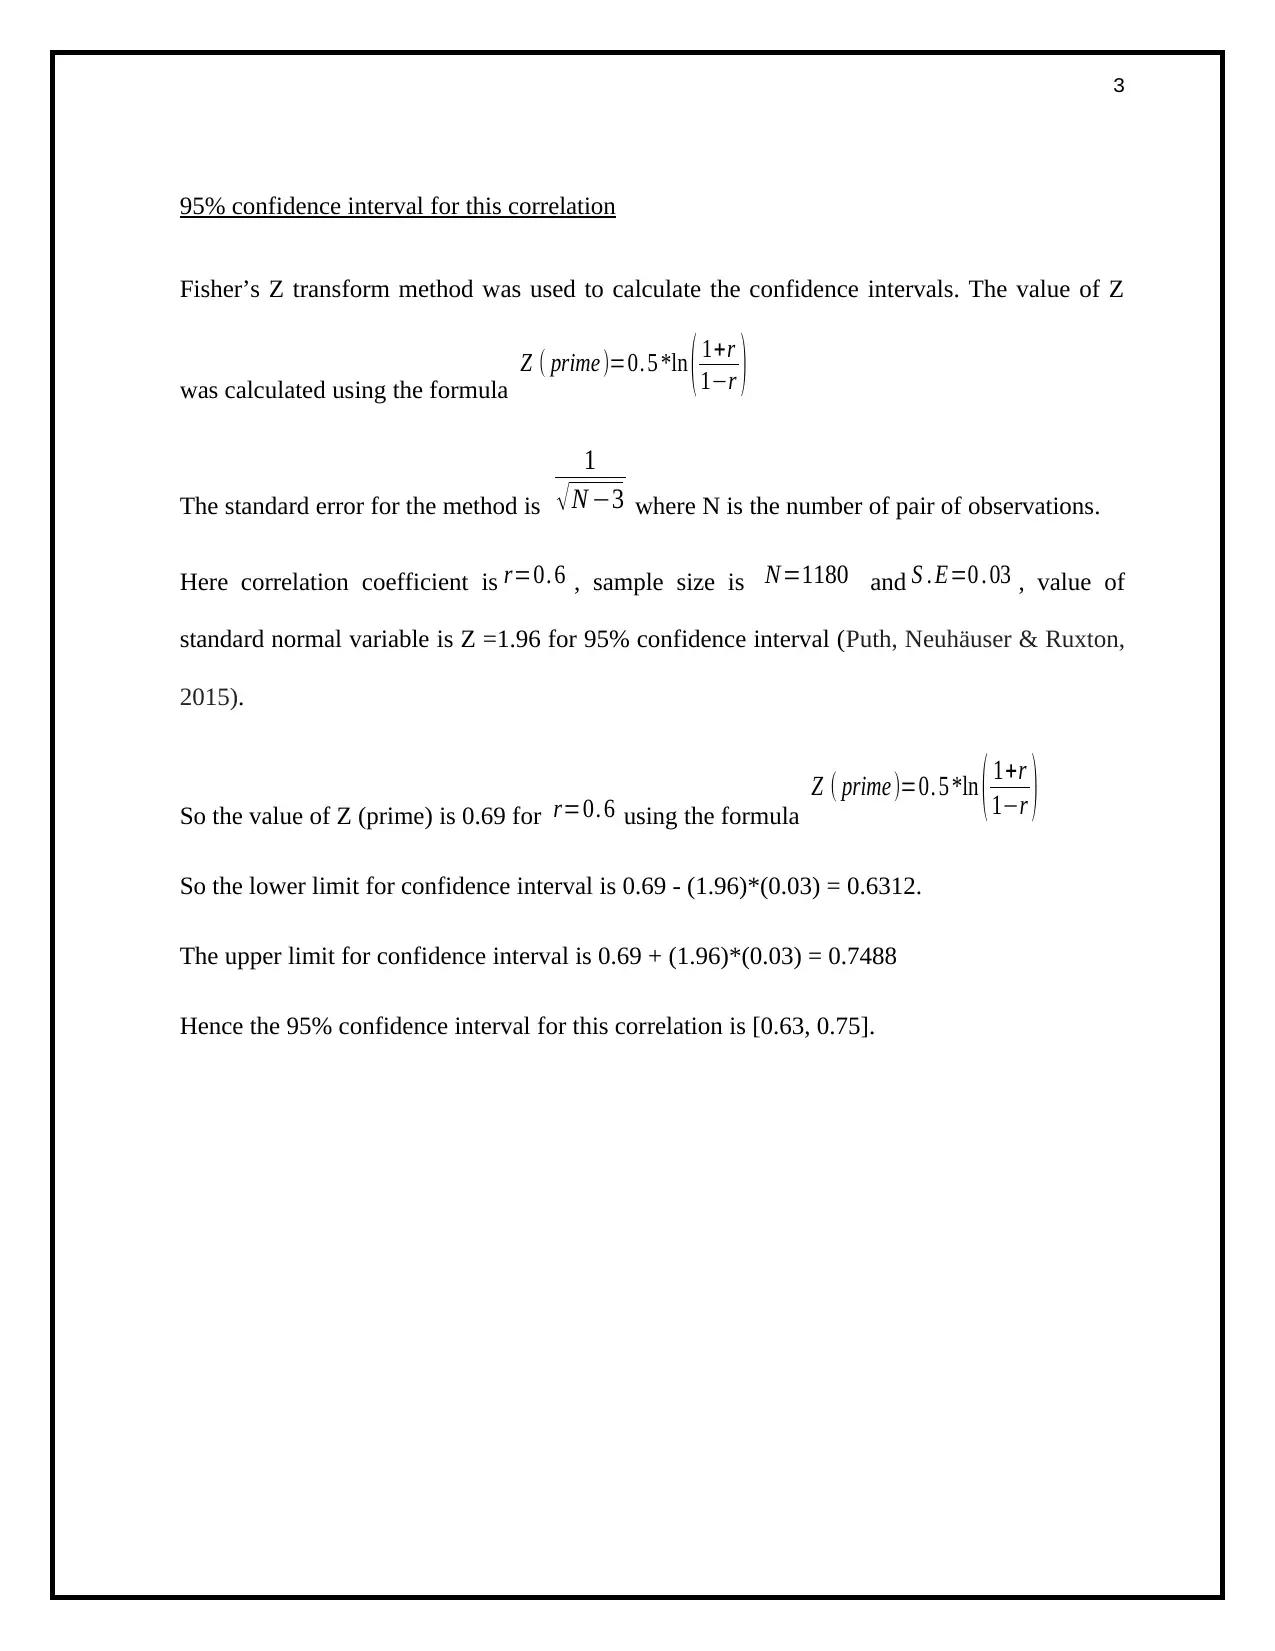
95% confidence interval for this correlation
Fisher’s Z transform method was used to calculate the confidence intervals. The value of Z
was calculated using the formula
Z ( prime )=0. 5 *ln ( 1+r
1−r )
The standard error for the method is
1
√ N −3 where N is the number of pair of observations.
Here correlation coefficient is r=0. 6 , sample size is N=1180 and S . E=0 . 03 , value of
standard normal variable is Z =1.96 for 95% confidence interval (Puth, Neuhäuser & Ruxton,
2015).
So the value of Z (prime) is 0.69 for r=0. 6 using the formula
Z ( prime )=0. 5 *ln ( 1+r
1−r )
So the lower limit for confidence interval is 0.69 - (1.96)*(0.03) = 0.6312.
The upper limit for confidence interval is 0.69 + (1.96)*(0.03) = 0.7488
Hence the 95% confidence interval for this correlation is [0.63, 0.75].
⊘ This is a preview!⊘
Do you want full access?
Subscribe today to unlock all pages.
Trusted by 1+ million students worldwide
4
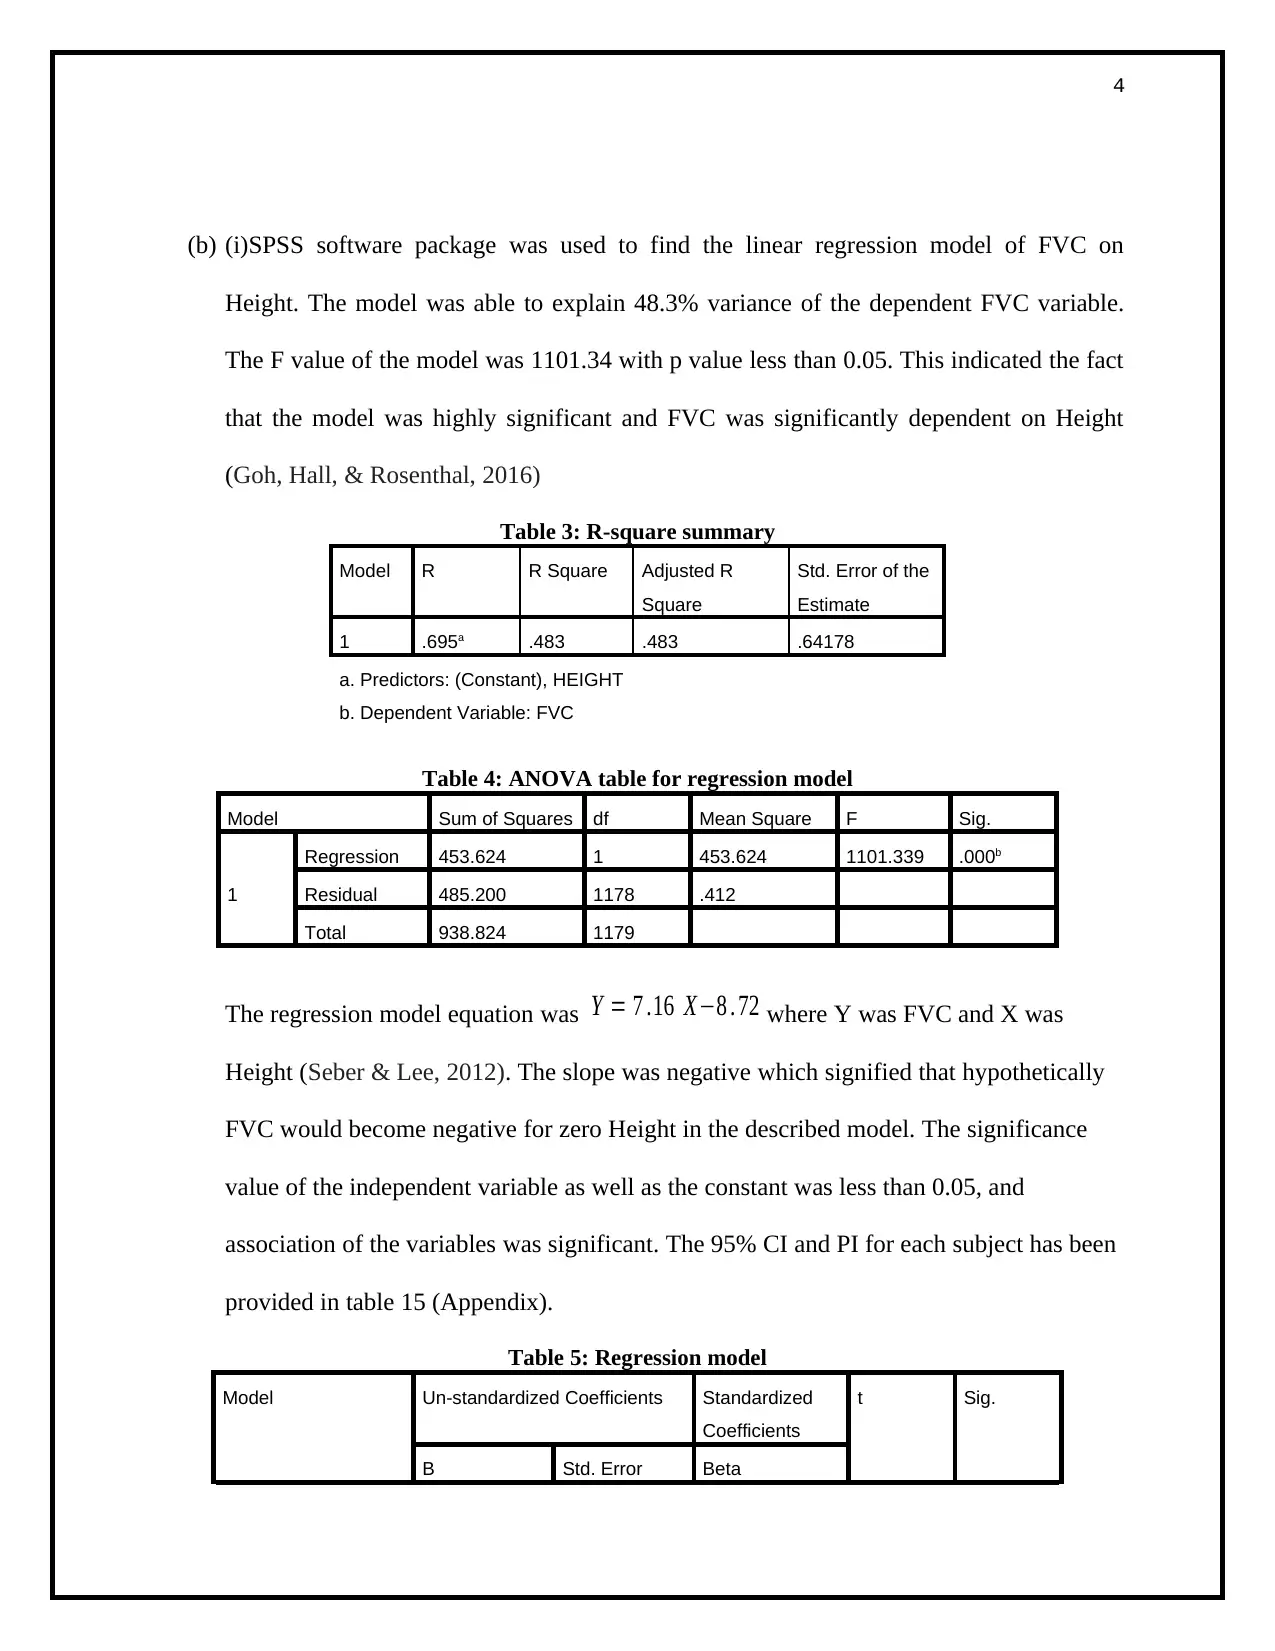
(b) (i)SPSS software package was used to find the linear regression model of FVC on
Height. The model was able to explain 48.3% variance of the dependent FVC variable.
The F value of the model was 1101.34 with p value less than 0.05. This indicated the fact
that the model was highly significant and FVC was significantly dependent on Height
(Goh, Hall, & Rosenthal, 2016)
Table 3: R-square summary
Model R R Square Adjusted R
Square
Std. Error of the
Estimate
1 .695a .483 .483 .64178
a. Predictors: (Constant), HEIGHT
b. Dependent Variable: FVC
Table 4: ANOVA table for regression model
Model Sum of Squares df Mean Square F Sig.
1
Regression 453.624 1 453.624 1101.339 .000b
Residual 485.200 1178 .412
Total 938.824 1179
The regression model equation was Y = 7 .16 X−8 . 72 where Y was FVC and X was
Height (Seber & Lee, 2012). The slope was negative which signified that hypothetically
FVC would become negative for zero Height in the described model. The significance
value of the independent variable as well as the constant was less than 0.05, and
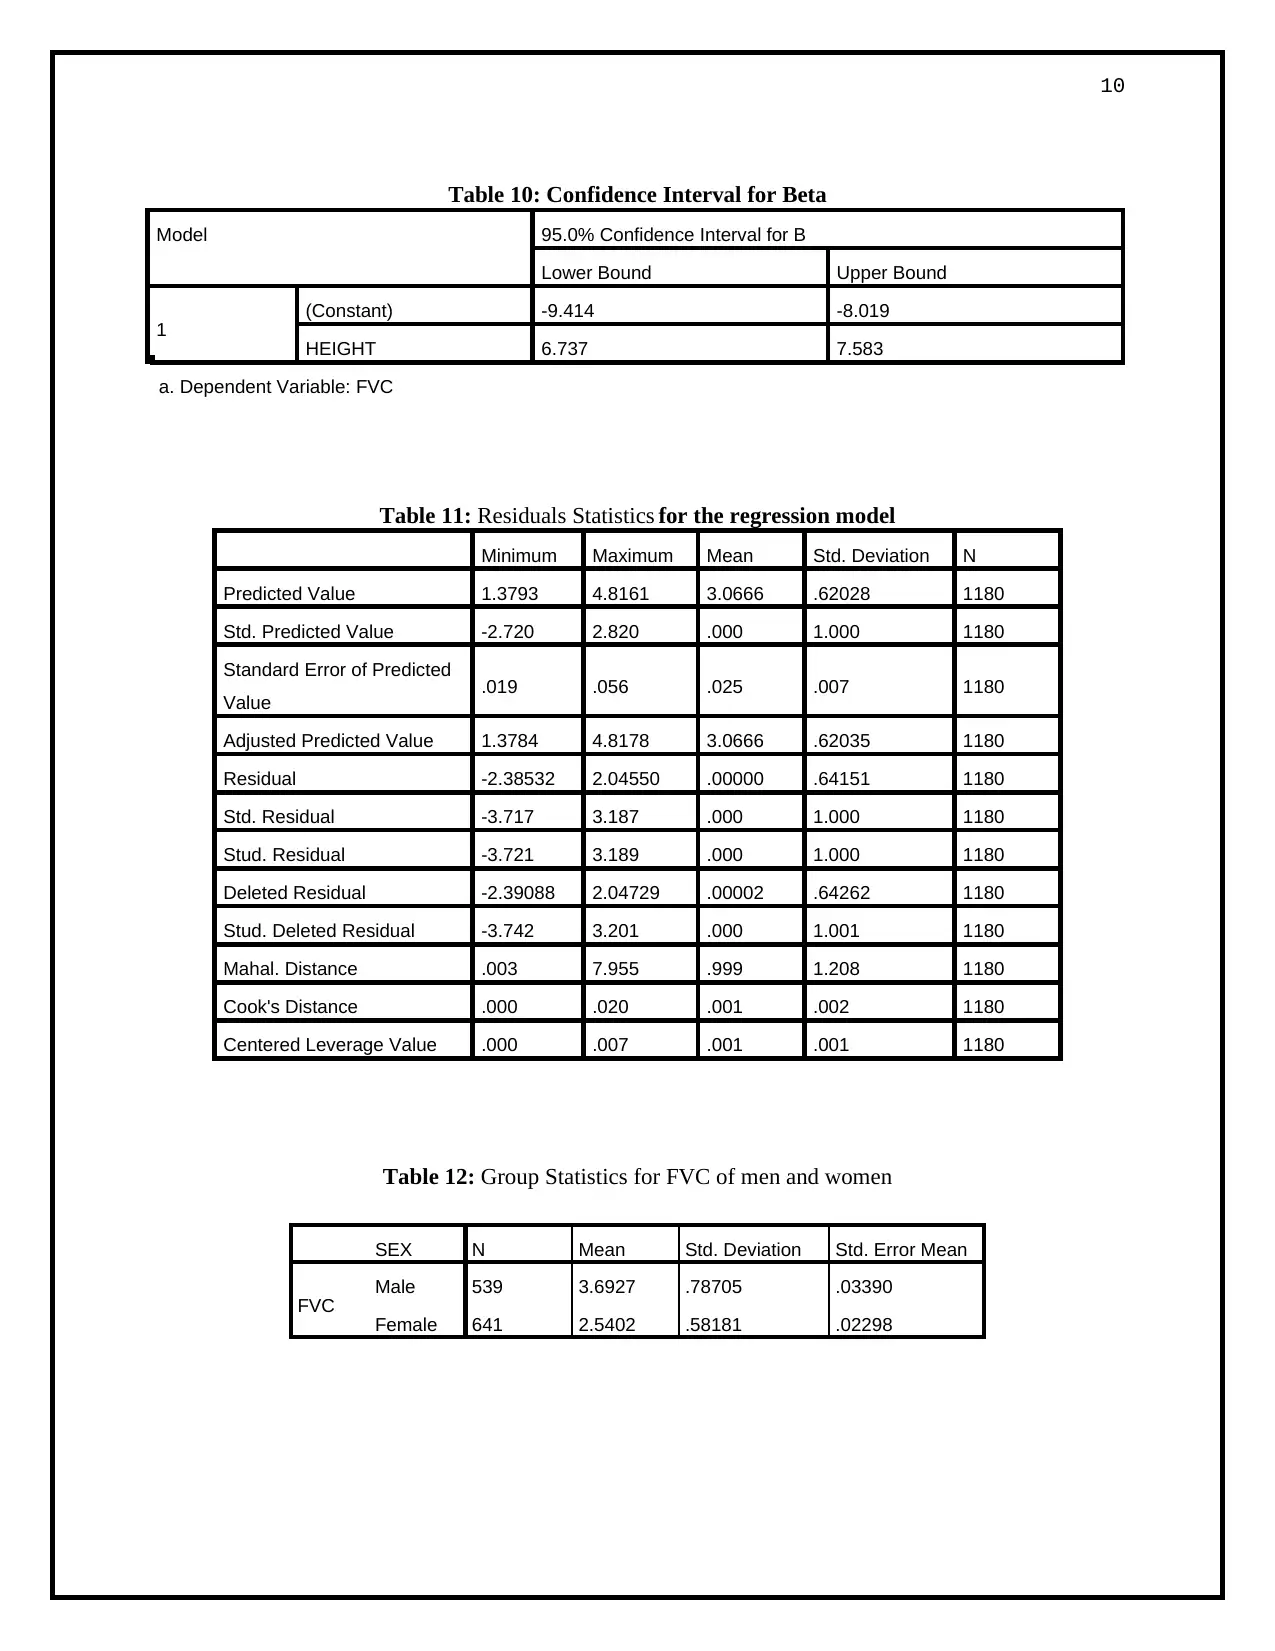
association of the variables was significant. The 95% CI and PI for each subject has been
provided in table 15 (Appendix).
Table 5: Regression model
Model Un-standardized Coefficients Standardized
Coefficients
t Sig.
B Std. Error Beta
(b) (i)SPSS software package was used to find the linear regression model of FVC on
Height. The model was able to explain 48.3% variance of the dependent FVC variable.
The F value of the model was 1101.34 with p value less than 0.05. This indicated the fact
that the model was highly significant and FVC was significantly dependent on Height
(Goh, Hall, & Rosenthal, 2016)
Table 3: R-square summary
Model R R Square Adjusted R
Square
Std. Error of the
Estimate
1 .695a .483 .483 .64178
a. Predictors: (Constant), HEIGHT
b. Dependent Variable: FVC
Table 4: ANOVA table for regression model
Model Sum of Squares df Mean Square F Sig.
1
Regression 453.624 1 453.624 1101.339 .000b
Residual 485.200 1178 .412
Total 938.824 1179
The regression model equation was Y = 7 .16 X−8 . 72 where Y was FVC and X was
Height (Seber & Lee, 2012). The slope was negative which signified that hypothetically
FVC would become negative for zero Height in the described model. The significance
value of the independent variable as well as the constant was less than 0.05, and
association of the variables was significant. The 95% CI and PI for each subject has been
provided in table 15 (Appendix).
Table 5: Regression model
Model Un-standardized Coefficients Standardized
Coefficients
t Sig.
B Std. Error Beta
Paraphrase This Document
Need a fresh take? Get an instant paraphrase of this document with our AI Paraphraser
5
1
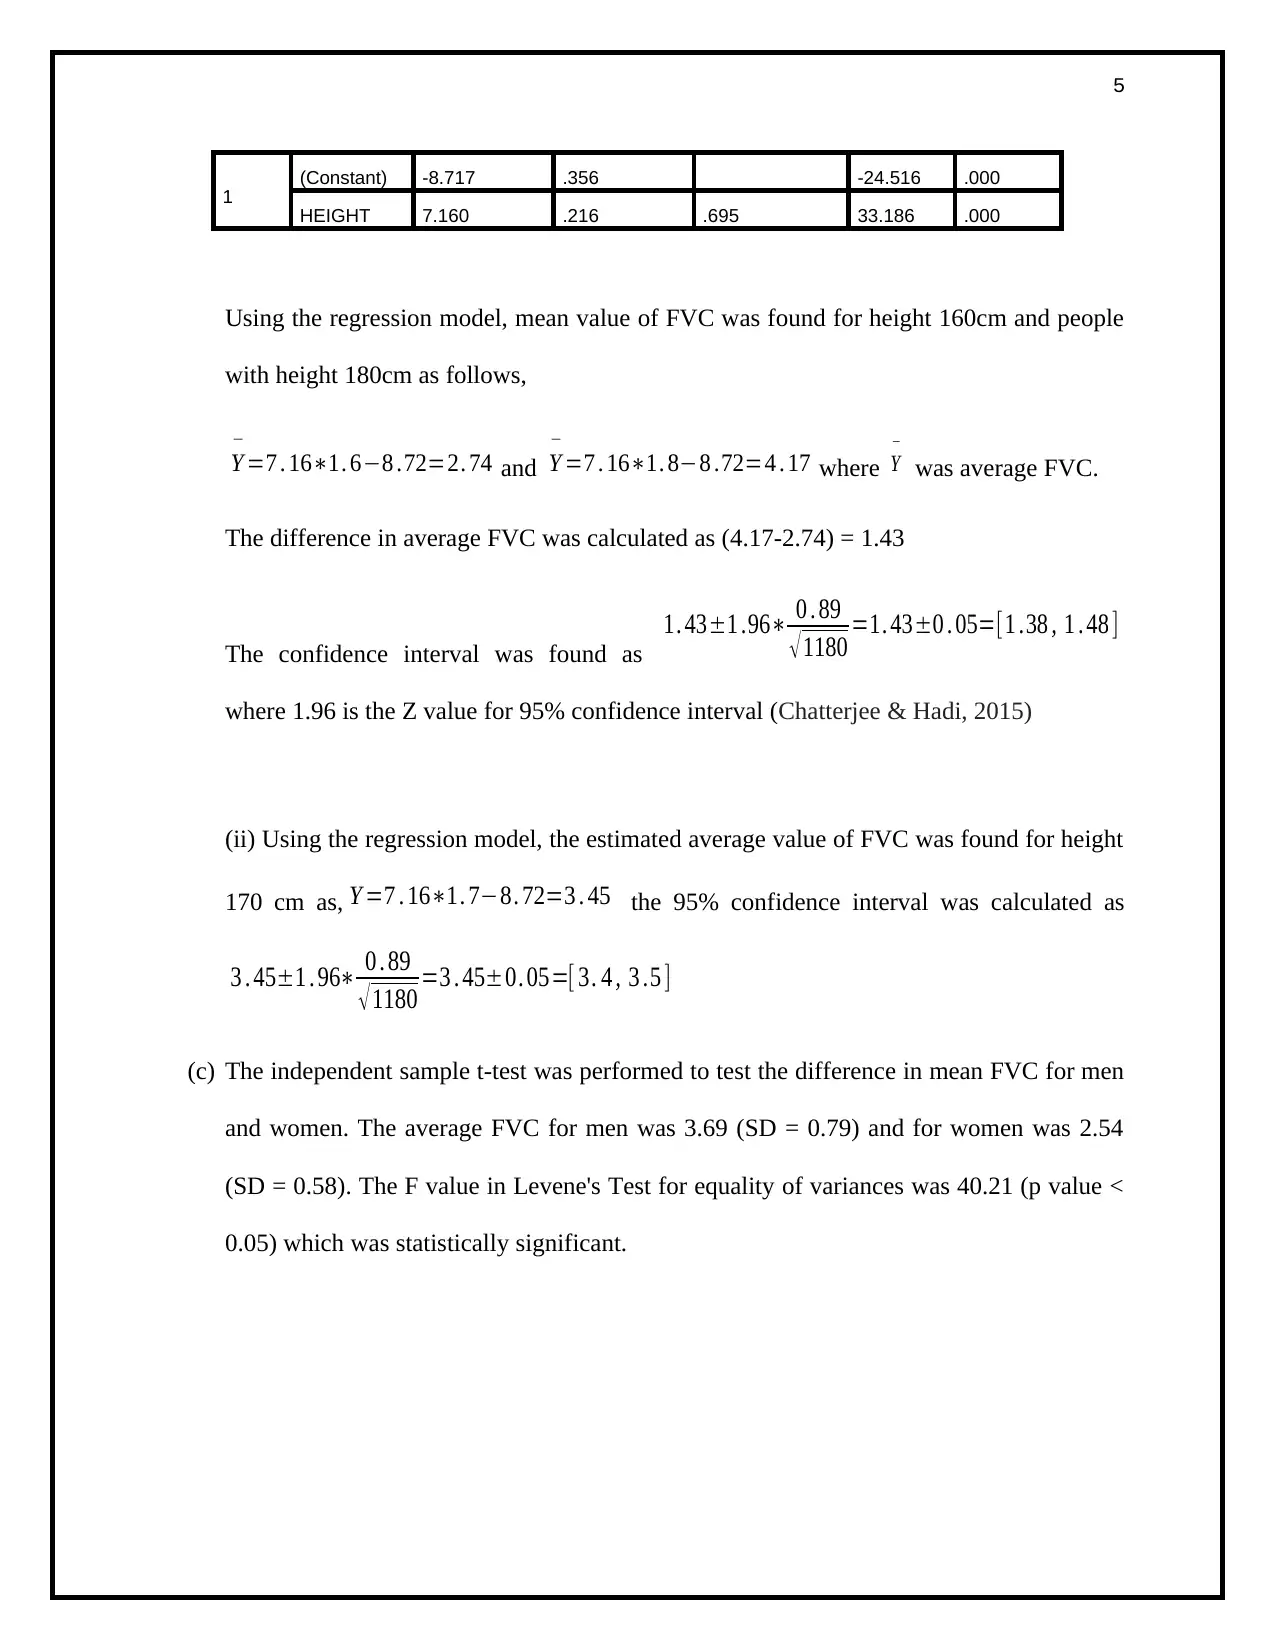
(Constant) -8.717 .356 -24.516 .000
HEIGHT 7.160 .216 .695 33.186 .000
Using the regression model, mean value of FVC was found for height 160cm and people
with height 180cm as follows,
Y
−
=7 . 16∗1. 6−8 .72=2. 74 and Y
−
=7 . 16∗1. 8−8 .72=4 . 17 where Y
−
was average FVC.
The difference in average FVC was calculated as (4.17-2.74) = 1.43
The confidence interval was found as
1. 43±1 .96∗ 0 . 89
√ 1180 =1. 43±0 . 05=[1 .38 , 1 . 48 ]
where 1.96 is the Z value for 95% confidence interval (Chatterjee & Hadi, 2015)
(ii) Using the regression model, the estimated average value of FVC was found for height
170 cm as, Y =7 . 16∗1. 7−8. 72=3 . 45 the 95% confidence interval was calculated as
3 . 45±1 . 96∗ 0 . 89
√ 1180 =3 . 45±0. 05=[ 3. 4 , 3 .5 ]
(c) The independent sample t-test was performed to test the difference in mean FVC for men
and women. The average FVC for men was 3.69 (SD = 0.79) and for women was 2.54
(SD = 0.58). The F value in Levene's Test for equality of variances was 40.21 (p value <
0.05) which was statistically significant.
1
(Constant) -8.717 .356 -24.516 .000
HEIGHT 7.160 .216 .695 33.186 .000
Using the regression model, mean value of FVC was found for height 160cm and people
with height 180cm as follows,
Y
−
=7 . 16∗1. 6−8 .72=2. 74 and Y
−
=7 . 16∗1. 8−8 .72=4 . 17 where Y
−
was average FVC.
The difference in average FVC was calculated as (4.17-2.74) = 1.43
The confidence interval was found as
1. 43±1 .96∗ 0 . 89
√ 1180 =1. 43±0 . 05=[1 .38 , 1 . 48 ]
where 1.96 is the Z value for 95% confidence interval (Chatterjee & Hadi, 2015)
(ii) Using the regression model, the estimated average value of FVC was found for height
170 cm as, Y =7 . 16∗1. 7−8. 72=3 . 45 the 95% confidence interval was calculated as
3 . 45±1 . 96∗ 0 . 89
√ 1180 =3 . 45±0. 05=[ 3. 4 , 3 .5 ]
(c) The independent sample t-test was performed to test the difference in mean FVC for men
and women. The average FVC for men was 3.69 (SD = 0.79) and for women was 2.54
(SD = 0.58). The F value in Levene's Test for equality of variances was 40.21 (p value <
0.05) which was statistically significant.
6
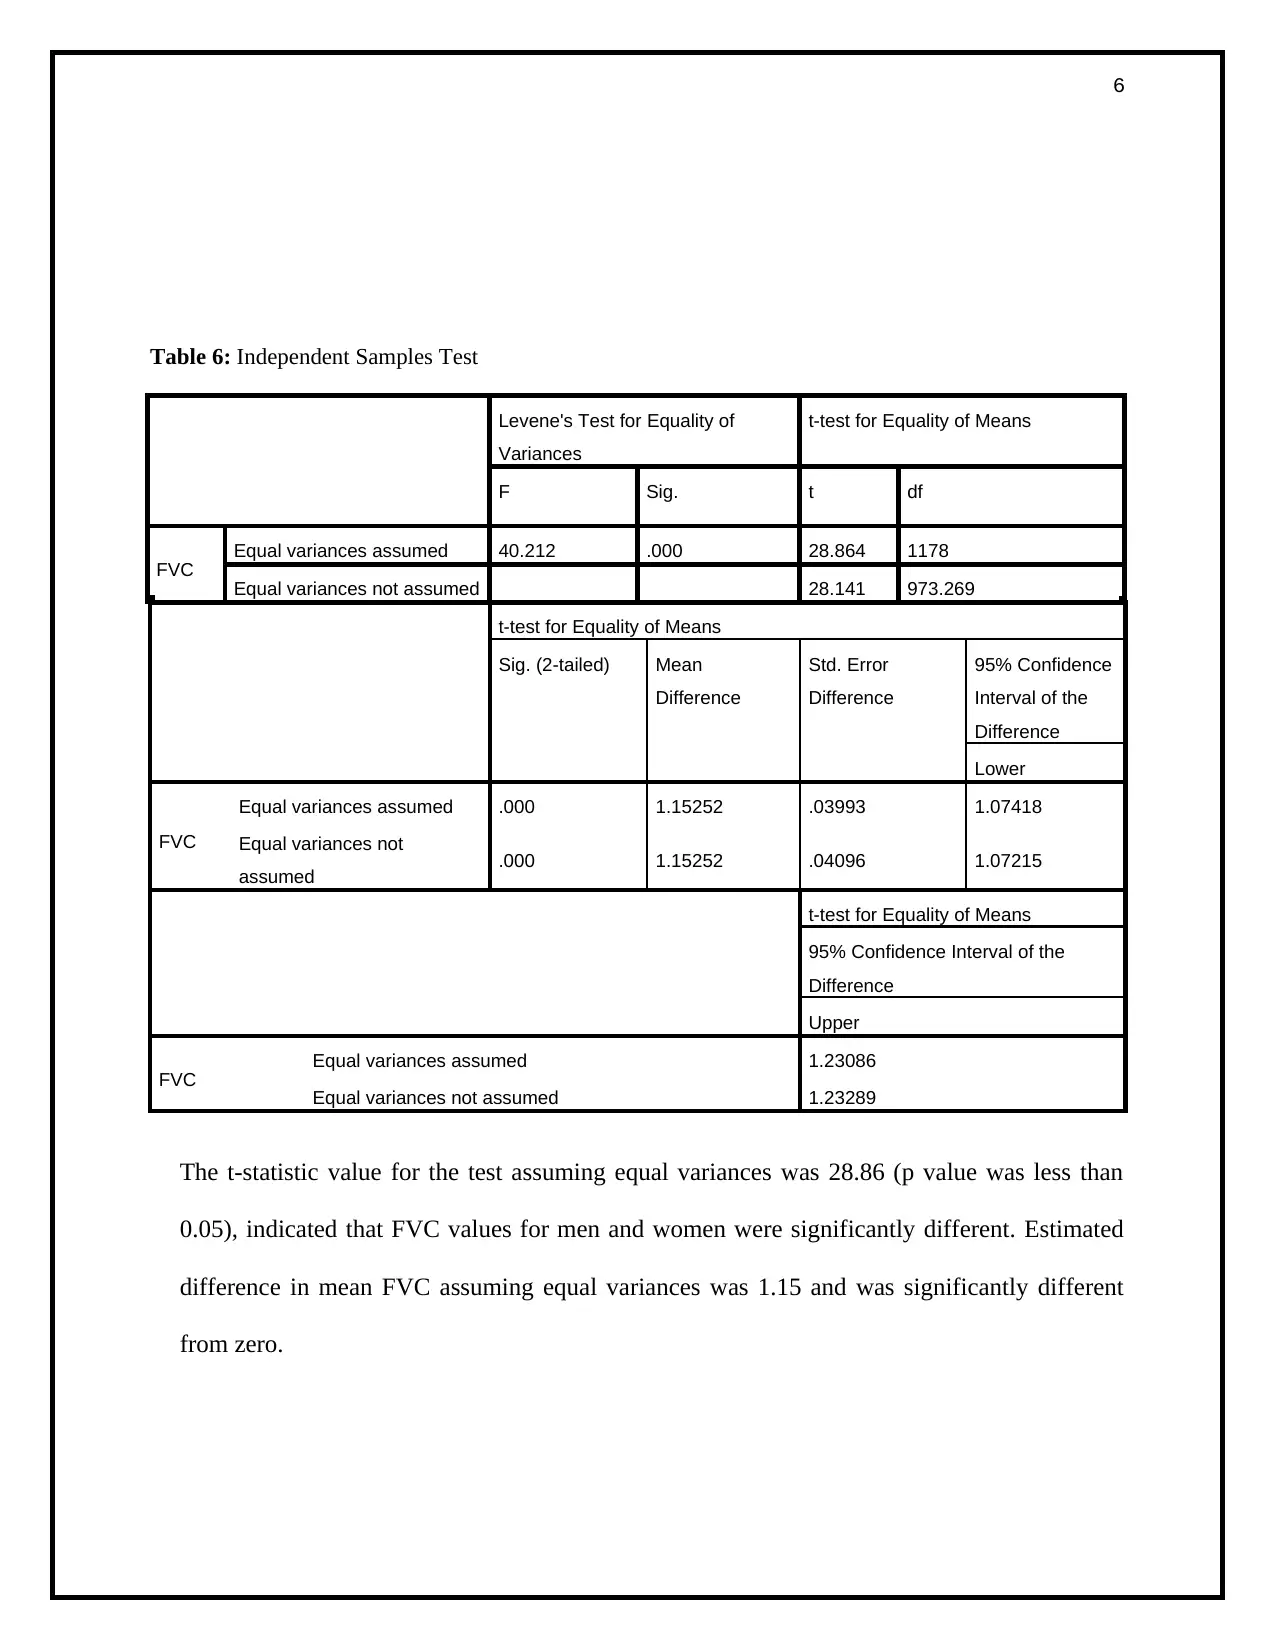
Table 6: Independent Samples Test
Levene's Test for Equality of
Variances
t-test for Equality of Means
F Sig. t df
FVC
Equal variances assumed 40.212 .000 28.864 1178
Equal variances not assumed 28.141 973.269
t-test for Equality of Means
Sig. (2-tailed) Mean
Difference
Std. Error
Difference
95% Confidence
Interval of the
Difference
Lower
FVC
Equal variances assumed .000 1.15252 .03993 1.07418
Equal variances not
assumed .000 1.15252 .04096 1.07215
t-test for Equality of Means
95% Confidence Interval of the
Difference
Upper
FVC Equal variances assumed 1.23086
Equal variances not assumed 1.23289
The t-statistic value for the test assuming equal variances was 28.86 (p value was less than
0.05), indicated that FVC values for men and women were significantly different. Estimated
difference in mean FVC assuming equal variances was 1.15 and was significantly different
from zero.
⊘ This is a preview!⊘
Do you want full access?
Subscribe today to unlock all pages.
Trusted by 1+ million students worldwide
7
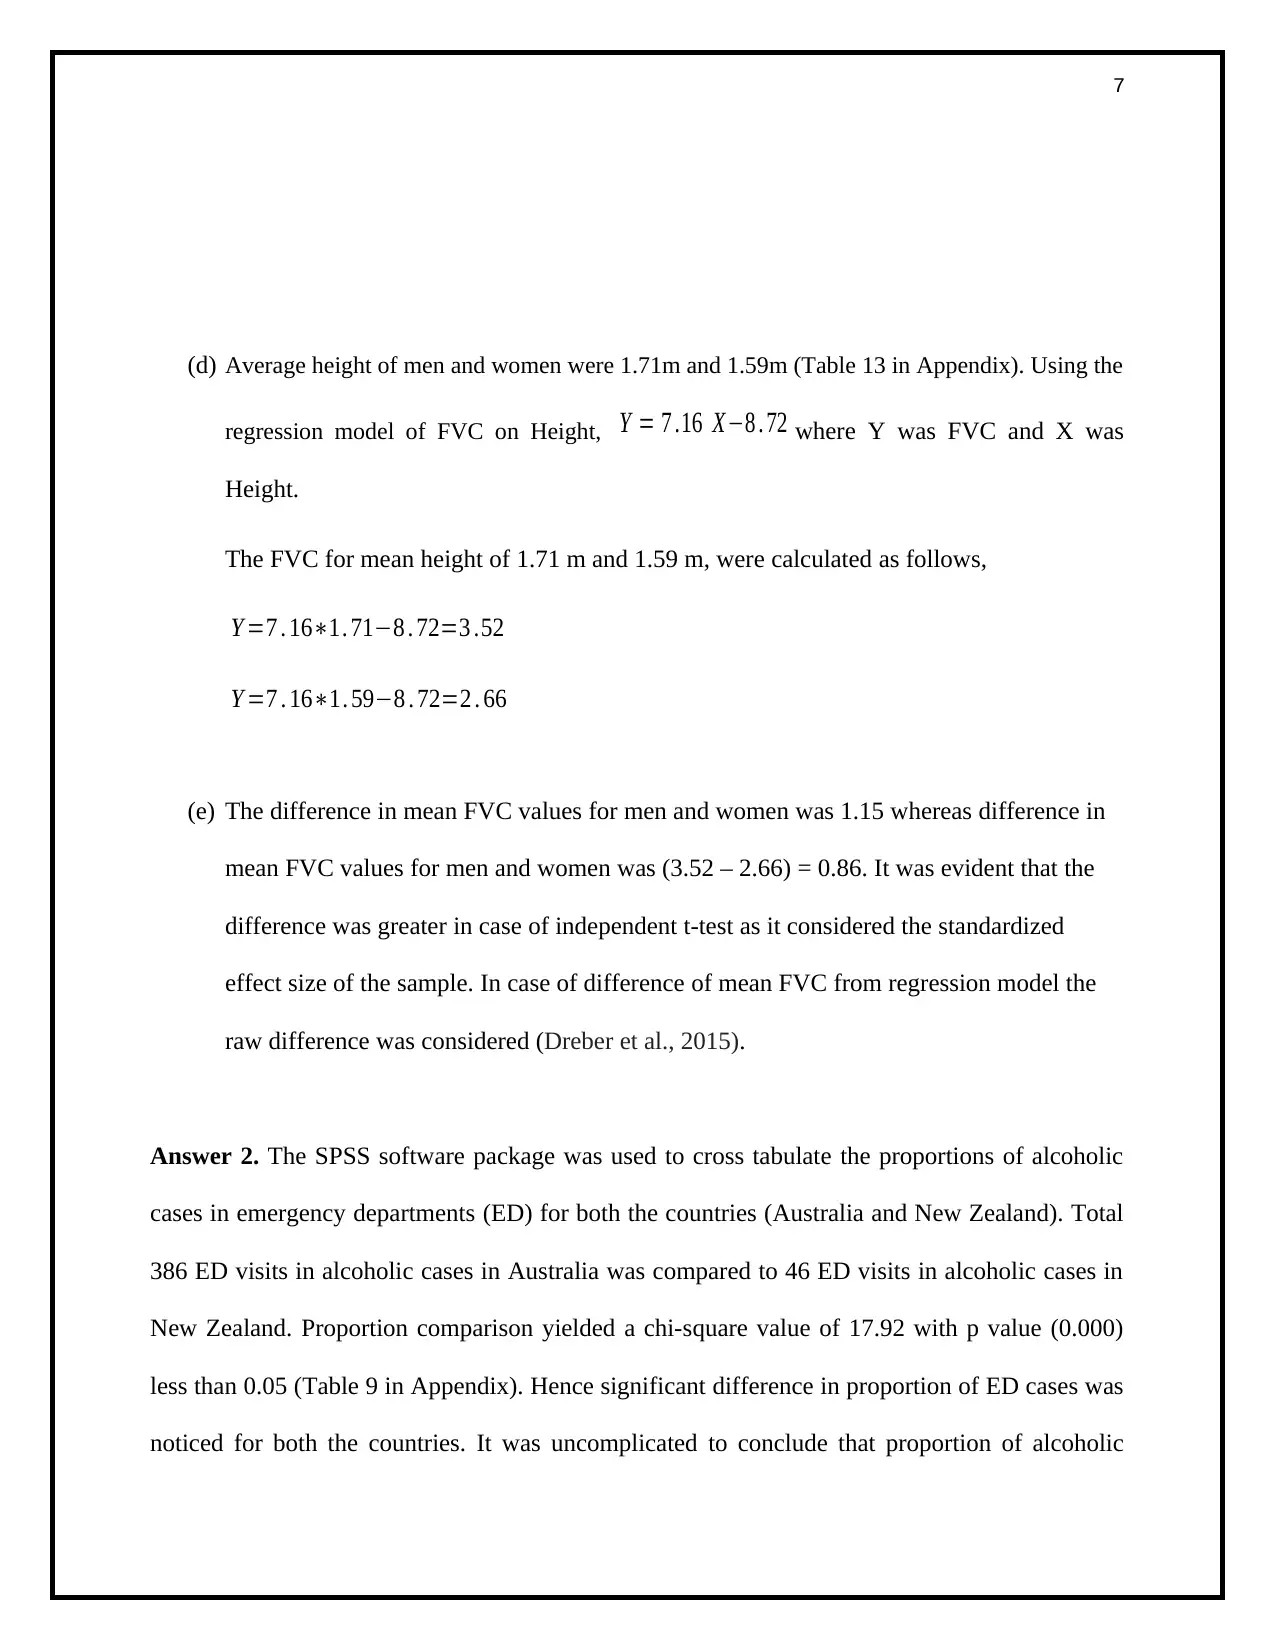
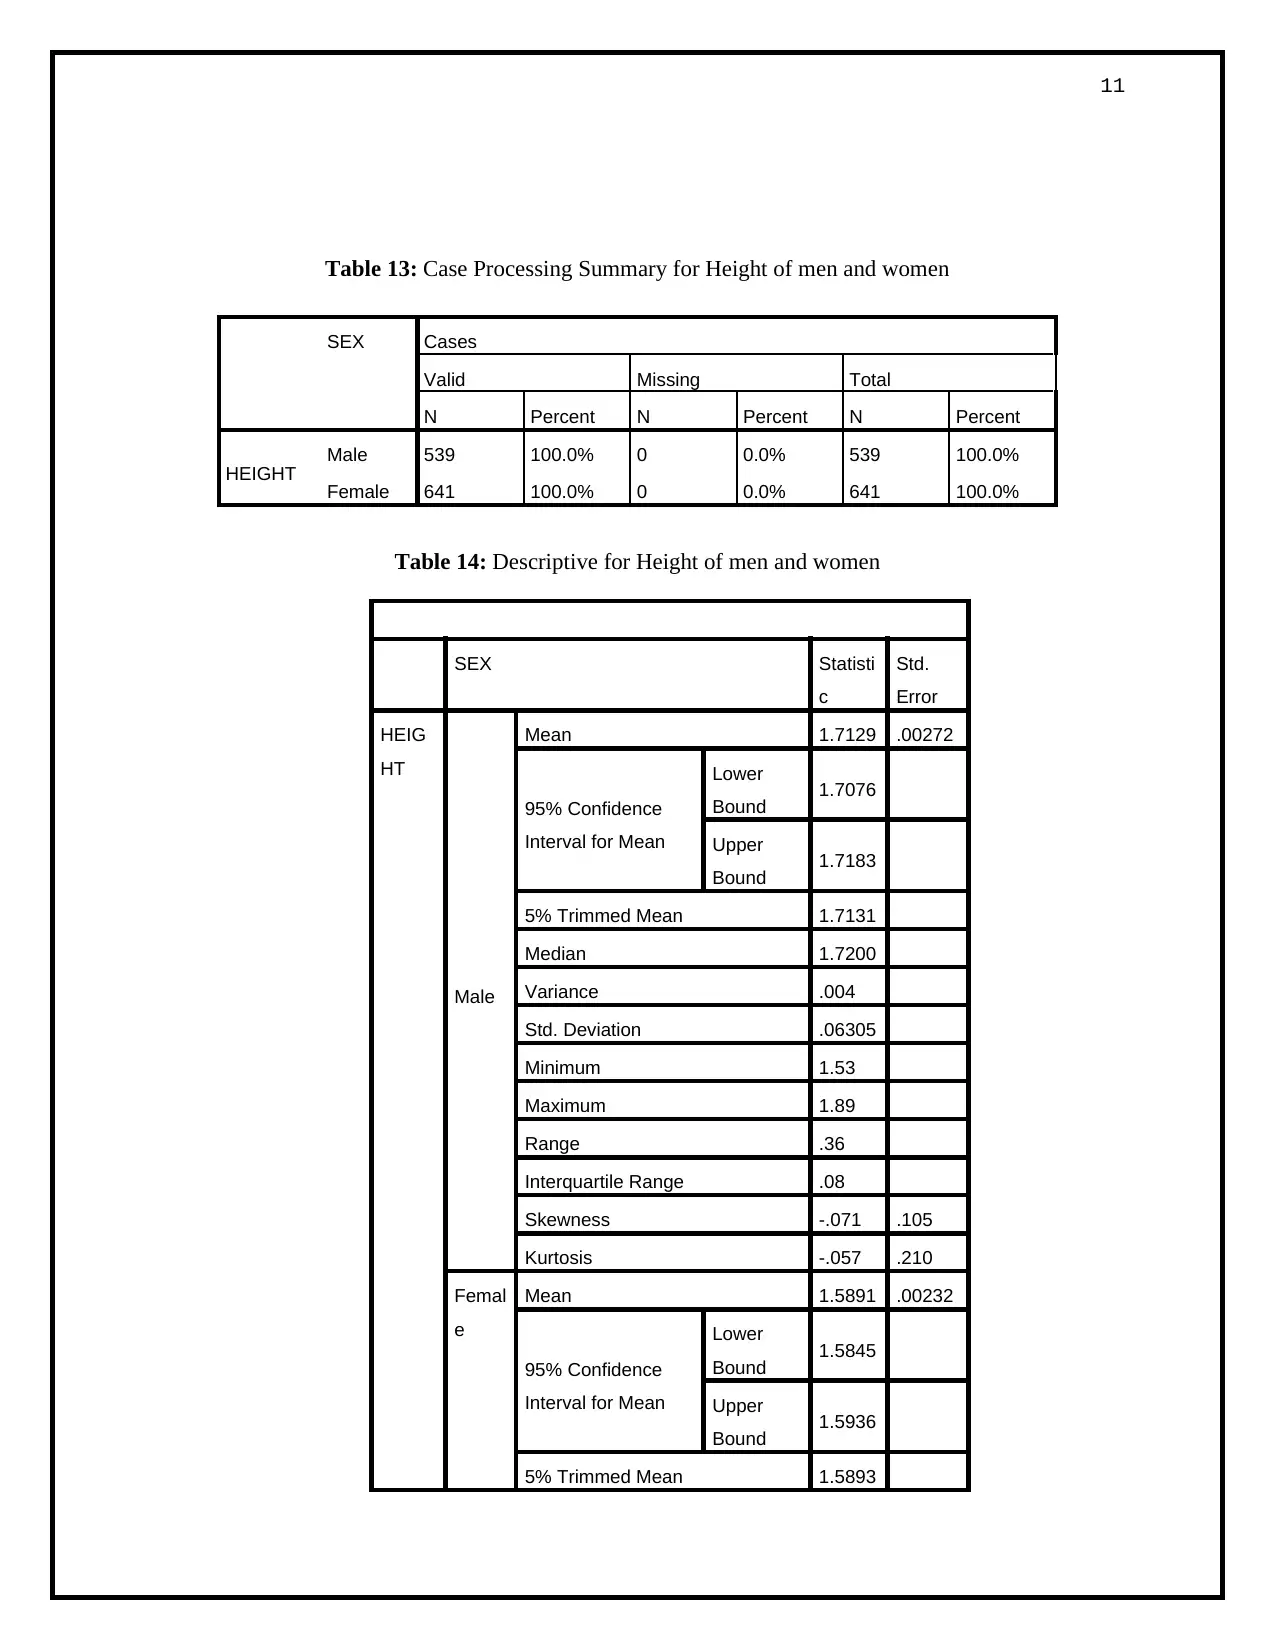
(d) Average height of men and women were 1.71m and 1.59m (Table 13 in Appendix). Using the
regression model of FVC on Height, Y = 7 .16 X−8 . 72 where Y was FVC and X was
Height.
The FVC for mean height of 1.71 m and 1.59 m, were calculated as follows,
Y =7 . 16∗1. 71−8 . 72=3 .52
Y =7 . 16∗1. 59−8 . 72=2 . 66
(e) The difference in mean FVC values for men and women was 1.15 whereas difference in
mean FVC values for men and women was (3.52 – 2.66) = 0.86. It was evident that the
difference was greater in case of independent t-test as it considered the standardized
effect size of the sample. In case of difference of mean FVC from regression model the
raw difference was considered (Dreber et al., 2015).
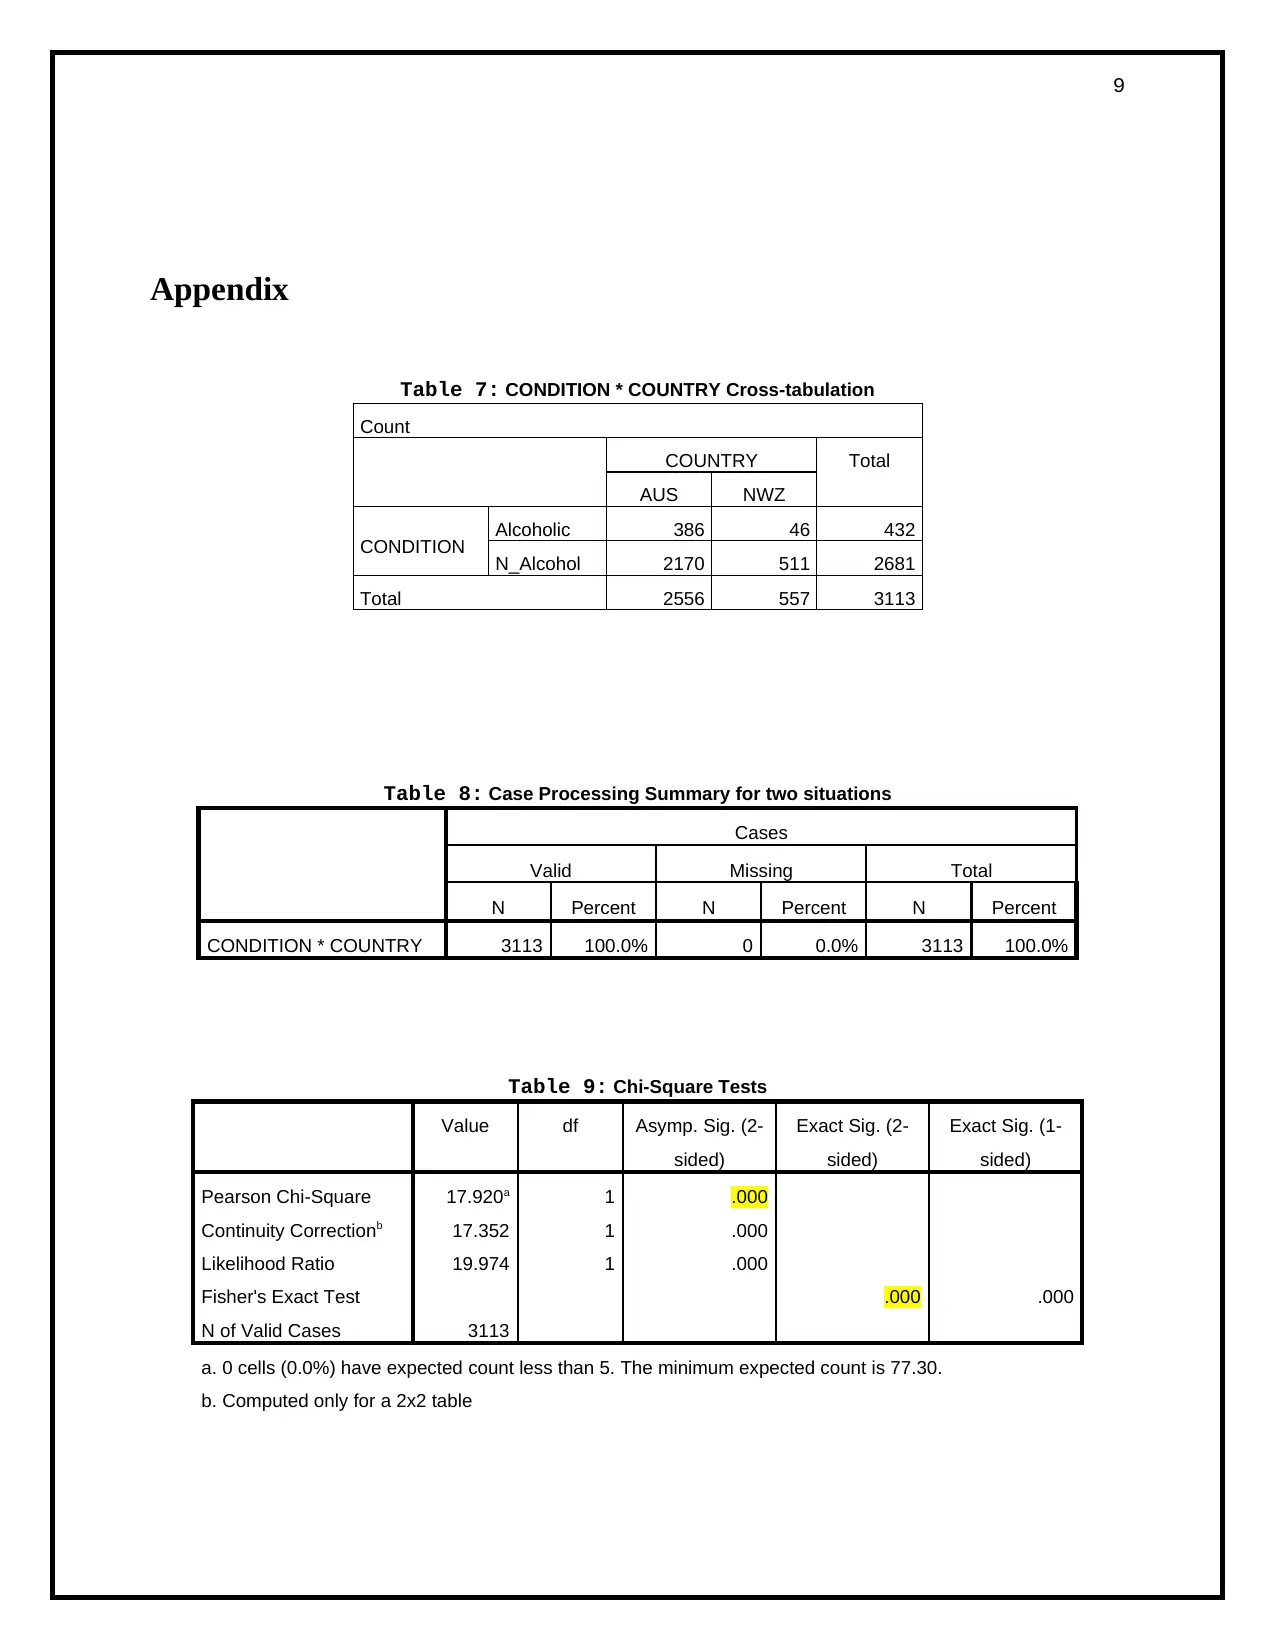
Answer 2. The SPSS software package was used to cross tabulate the proportions of alcoholic
cases in emergency departments (ED) for both the countries (Australia and New Zealand). Total
386 ED visits in alcoholic cases in Australia was compared to 46 ED visits in alcoholic cases in
New Zealand. Proportion comparison yielded a chi-square value of 17.92 with p value (0.000)
less than 0.05 (Table 9 in Appendix). Hence significant difference in proportion of ED cases was
noticed for both the countries. It was uncomplicated to conclude that proportion of alcoholic
(d) Average height of men and women were 1.71m and 1.59m (Table 13 in Appendix). Using the
regression model of FVC on Height, Y = 7 .16 X−8 . 72 where Y was FVC and X was
Height.
The FVC for mean height of 1.71 m and 1.59 m, were calculated as follows,
Y =7 . 16∗1. 71−8 . 72=3 .52
Y =7 . 16∗1. 59−8 . 72=2 . 66
(e) The difference in mean FVC values for men and women was 1.15 whereas difference in
mean FVC values for men and women was (3.52 – 2.66) = 0.86. It was evident that the
difference was greater in case of independent t-test as it considered the standardized
effect size of the sample. In case of difference of mean FVC from regression model the
raw difference was considered (Dreber et al., 2015).
Answer 2. The SPSS software package was used to cross tabulate the proportions of alcoholic
cases in emergency departments (ED) for both the countries (Australia and New Zealand). Total
386 ED visits in alcoholic cases in Australia was compared to 46 ED visits in alcoholic cases in
New Zealand. Proportion comparison yielded a chi-square value of 17.92 with p value (0.000)
less than 0.05 (Table 9 in Appendix). Hence significant difference in proportion of ED cases was
noticed for both the countries. It was uncomplicated to conclude that proportion of alcoholic
Paraphrase This Document
Need a fresh take? Get an instant paraphrase of this document with our AI Paraphraser
8
people in Australia visiting emergency departments was higher than that of New Zealand 9
(Song, Wang, & Cavusgil, 2015).
References
Seber, G. A., & Lee, A. J. (2012). Linear regression analysis (Vol. 329). John Wiley & Sons.
Dreber, A., Pfeiffer, T., Almenberg, J., Isaksson, S., Wilson, B., Chen, Y., ... & Johannesson, M.
(2015). Using prediction markets to estimate the reproducibility of scientific
research. Proceedings of the National Academy of Sciences, 112(50), 15343-15347.
Song, J., Wang, R., & Cavusgil, S. T. (2015). State ownership and market orientation in China's
public firms: An agency theory perspective. International Business Review, 24(4), 690-
699.
Puth, M. T., Neuhäuser, M., & Ruxton, G. D. (2015). Effective use of Spearman's and Kendall's
correlation coefficients for association between two measured traits. Animal
Behaviour, 102, 77-84.
Goh, J. X., Hall, J. A., & Rosenthal, R. (2016). Mini meta‐analysis of your own studies: Some
arguments on why and a primer on how. Social and Personality Psychology
Compass, 10(10), 535-549.
Chatterjee, S., & Hadi, A. S. (2015). Regression analysis by example. John Wiley & Sons.
9
Appendix
Table 7: CONDITION * COUNTRY Cross-tabulation
Count
COUNTRY Total
AUS NWZ
CONDITION Alcoholic 386 46 432
N_Alcohol 2170 511 2681
Total 2556 557 3113
Table 8: Case Processing Summary for two situations
Cases
Valid Missing Total
N Percent N Percent N Percent
CONDITION * COUNTRY 3113 100.0% 0 0.0% 3113 100.0%
Table 9: Chi-Square Tests
Value df Asymp. Sig. (2-
sided)
Exact Sig. (2-
sided)
Exact Sig. (1-
sided)
Pearson Chi-Square 17.920a 1 .000
Continuity Correctionb 17.352 1 .000
Likelihood Ratio 19.974 1 .000
Fisher's Exact Test .000 .000
N of Valid Cases 3113
a. 0 cells (0.0%) have expected count less than 5. The minimum expected count is 77.30.
b. Computed only for a 2x2 table
⊘ This is a preview!⊘
Do you want full access?
Subscribe today to unlock all pages.
Trusted by 1+ million students worldwide
10
Table 10: Confidence Interval for Beta
Model 95.0% Confidence Interval for B
Lower Bound Upper Bound
1
(Constant) -9.414 -8.019
HEIGHT 6.737 7.583
a. Dependent Variable: FVC
Table 11: Residuals Statistics for the regression model
Minimum Maximum Mean Std. Deviation N
Predicted Value 1.3793 4.8161 3.0666 .62028 1180
Std. Predicted Value -2.720 2.820 .000 1.000 1180
Standard Error of Predicted
Value .019 .056 .025 .007 1180
Adjusted Predicted Value 1.3784 4.8178 3.0666 .62035 1180
Residual -2.38532 2.04550 .00000 .64151 1180
Std. Residual -3.717 3.187 .000 1.000 1180
Stud. Residual -3.721 3.189 .000 1.000 1180
Deleted Residual -2.39088 2.04729 .00002 .64262 1180
Stud. Deleted Residual -3.742 3.201 .000 1.001 1180
Mahal. Distance .003 7.955 .999 1.208 1180
Cook's Distance .000 .020 .001 .002 1180
Centered Leverage Value .000 .007 .001 .001 1180
Table 12: Group Statistics for FVC of men and women
SEX N Mean Std. Deviation Std. Error Mean
FVC Male 539 3.6927 .78705 .03390
Female 641 2.5402 .58181 .02298
Paraphrase This Document
Need a fresh take? Get an instant paraphrase of this document with our AI Paraphraser
11
Table 13: Case Processing Summary for Height of men and women
SEX Cases
Valid Missing Total
N Percent N Percent N Percent
HEIGHT Male 539 100.0% 0 0.0% 539 100.0%
Female 641 100.0% 0 0.0% 641 100.0%
Table 14: Descriptive for Height of men and women
SEX Statisti
c
Std.
Error
HEIG
HT
Male
Mean 1.7129 .00272
95% Confidence
Interval for Mean
Lower
Bound 1.7076
Upper
Bound 1.7183
5% Trimmed Mean 1.7131
Median 1.7200
Variance .004
Std. Deviation .06305
Minimum 1.53
Maximum 1.89
Range .36
Interquartile Range .08
Skewness -.071 .105
Kurtosis -.057 .210
Femal
e
Mean 1.5891 .00232
95% Confidence
Interval for Mean
Lower
Bound 1.5845
Upper
Bound 1.5936
5% Trimmed Mean 1.5893

12
Median 1.5900
Variance .003
Std. Deviation .05886
Minimum 1.41
Maximum 1.78
Range .37
Interquartile Range .08
Skewness -.037 .097
Kurtosis -.191 .193
Table 15: 95% Confidence Interval for PI for each subject
LICI_1 UICI_1 Age LICI_1 UICI_1 Age LICI_1 UICI_1 Age LICI_1 UICI_1 Age
1.41 3.93 76.6 2.41 4.93 68.3 2.41 4.93 66.8 1.77 4.29 66.9
1.26 3.78 64.9 1.98 4.50 63.6 1.77 4.29 56.2 2.55 5.07 63.9
1.98 4.50 81.1 0.76 3.28 68.1 2.77 5.29 82.9 1.62 4.14 63
1.34 3.86 75.2 0.76 3.28 66.5 1.91 4.43 60.4 1.05 3.57 58.2
1.19 3.71 59.7 0.91 3.43 73.9 2.34 4.86 73.7 1.77 4.29 66.6
2.77 5.29 59.7 1.41 3.93 62.6 2.55 5.07 58.4 2.55 5.07 59.8
1.26 3.78 56.6 2.12 4.64 61.6 1.84 4.36 77.3 2.62 5.15 57
1.91 4.43 58.3 1.98 4.50 59.7 1.41 3.93 77.9 2.48 5.00 74
1.41 3.93 81.9 1.19 3.71 72.2 1.12 3.64 84.6 1.41 3.93 66.8
0.83 3.36 57.1 2.27 4.79 58.5 1.77 4.29 62.7 2.98 5.50 58.5
1.69 4.21 67.8 1.12 3.64 67.2 1.05 3.57 78.8 1.84 4.36 58.1
1.48 4.00 68.7 2.62 5.15 67.2 1.55 4.07 68.4 2.41 4.93 71.6
2.12 4.64 73.3 1.62 4.14 82.3 2.05 4.57 72.4 1.55 4.07 68.9
0.98 3.50 77.1 0.69 3.21 73 0.76 3.28 73.1 1.69 4.21 67.4
2.12 4.64 65 1.77 4.29 69.3 0.91 3.43 76.2 2.84 5.36 66.8
0.83 3.36 81 1.55 4.07 60.5 0.91 3.43 57.2 3.27 5.79 70
1.34 3.86 78.2 1.48 4.00 63 1.48 4.00 73.4 1.19 3.71 68.4
1.41 3.93 60.9 1.91 4.43 69.5 2.20 4.72 75.2 2.05 4.57 76.6
0.62 3.14 56.7 1.77 4.29 64 2.05 4.57 62.7 1.48 4.00 73.8
0.91 3.43 71.6 1.91 4.43 67.5 1.98 4.50 67.2 2.55 5.07 55.4
1.34 3.86 77.2 3.05 5.58 67 1.77 4.29 74.1 1.84 4.36 65.7
1.98 4.50 61.3 1.19 3.71 64.6 1.98 4.50 68 1.91 4.43 55.6
1.98 4.50 68.9 1.19 3.71 65.1 2.27 4.79 65.3 1.98 4.50 68.6
1.19 3.71 63.9 0.83 3.36 67.4 1.34 3.86 63.9 1.69 4.21 68.3
1.05 3.57 59.7 2.05 4.57 81.4 1.12 3.64 55.3 1.19 3.71 57.7
1.69 4.21 64.9 1.12 3.64 59.6 0.91 3.43 76 2.77 5.29 55.4
1.91 4.43 62.9 1.34 3.86 77.3 2.41 4.93 62.8 1.69 4.21 55.2
1.91 4.43 61.1 1.05 3.57 73.9 0.76 3.28 75.3 1.05 3.57 76
2.70 5.22 59.1 2.84 5.36 71.2 1.19 3.71 78.8 1.91 4.43 75
1.98 4.50 61 0.83 3.36 65.2 1.19 3.71 59.3 1.26 3.78 70.9
1.05 3.57 75 2.27 4.79 66 1.48 4.00 83.5 1.55 4.07 65.2
⊘ This is a preview!⊘
Do you want full access?
Subscribe today to unlock all pages.
Trusted by 1+ million students worldwide
1 out of 18
Related Documents


Your All-in-One AI-Powered Toolkit for Academic Success.
+13062052269
info@desklib.com
Available 24*7 on WhatsApp / Email
![[object Object]](/_next/static/media/star-bottom.7253800d.svg)
Unlock your academic potential
Copyright © 2020–2026 A2Z Services. All Rights Reserved. Developed and managed by ZUCOL.