Analysis of Six Sigma, Lean, and DFSS for Supply Chain Optimization
VerifiedAdded on 2022/11/12
|20
|4183
|210
Homework Assignment
AI Summary
This assignment delves into the application of Six Sigma, Lean thinking, and Design for Six Sigma (DFSS) methodologies within the context of Supply Chain Management (SCM). It addresses key concepts such as the Six Sigma concept for SCM, the advantages of Quality Function Deployment (QFD) matrices, and the steps involved in benchmarking. The assignment also explores various Six Sigma tools like Affinity diagrams, Kano models, Pareto analysis, Ishikawa diagrams, process flowcharts, Failure Mode and Effects Analysis (FMEA), and Design of Experiments (DOE). Furthermore, it examines the final stage of the DMAIC cycle, the principles of lean thinking, and the creation of value stream process maps. The assignment also explores DFSS for supply chain design and the steps to redesign a supply chain process using DFSS. Key factors for implementing a successful Six Sigma program for SCM, along with Six Sigma applications for logistics and supply chain management are discussed. The SCOR model, its strengths, and weaknesses, along with the convergence of SCOR with Six Sigma (Lean) are also elaborated.
LEAN SIX SIGMA
Paraphrase This Document
Need a fresh take? Get an instant paraphrase of this document with our AI Paraphraser
1
Contents
Topic one questions...............................................................................................................................2
Question 1: Six sigma concept for SCM............................................................................................2
Question 2: Two advantages of developing and utilising a QFD matrix............................................2
Question 3: Each part of the QFD matrix..........................................................................................2
Question 4: Steps for benchmarking..................................................................................................3
Question 5: Description of six sigma tools........................................................................................4
Question 6: Last stage of DMAIC...................................................................................................10
Question 7: Lean thinking...............................................................................................................10
Question 8: Creating value stream process map..............................................................................11
Topic Two questions...........................................................................................................................11
Question 1: DFSS............................................................................................................................11
Question 2: Steps to redesign a supply chain process using DFSS..................................................11
Topic three questions...........................................................................................................................12
Question 1: Key factors for implementing a successful six sigma program for SCM......................12
Question 2: Six sigma applications for logistics and supply chain management.............................13
Topic four questions............................................................................................................................14
Question 1: SCOR Model................................................................................................................14
Strengths of the SCOR model......................................................................................................14
Weaknesses of the SCOR model.................................................................................................15
Question 2: SCOR Six Sigma (Lean) convergence..........................................................................15
SCOR add to six sigma................................................................................................................15
References...........................................................................................................................................17
Figure 1: Affinity Diagram......................................................................................................................5
Figure 2: Kano Model............................................................................................................................6
Figure 3: Pareto analysis........................................................................................................................7
Figure 4: Ishikawa Diagram....................................................................................................................8
Figure 5: Process flow chart...................................................................................................................9
Figure 6: Example of FMEA analysis......................................................................................................9
Figure 7: Example of Design of Experiment tool..................................................................................10
Figure 8 Supply chain process using DFSS............................................................................................12
Figure 9 SCOR add to six sigma............................................................................................................15
2
Topic one questions
Question 1: Six sigma concept for SCM
Six sigma is utilised for making the process improvements which is essential in the
management of the operations and improving the quality of the overall processes such as
Supply Chain Management (Stanton, 2019). Six Sigma works on statistics hence it is an
effective tool that helps in predicting the future outcomes and also helps in bringing control
in the SCM which is critical for managing the demand and supply and hence bringing
efficiency in the overall process and decreasing the numbers of mistakes in the process.
Question 2: Two advantages of developing and utilising a QFD matrix
Different advantages of generating and utilising a QFD matrix has been showcased below:
Customer driven: Since the development and utilisation of the QFD is done on the
basis of the demands of the customers hence the overall development process is
dependent on the wants of the consumers.
Reduced development time: The likelihood of the design alters as the development of
this model emphasise on improvements that are done for satisfying the major
demands of the consumers. Higher attention towards requirements of the consumers
declines the threat that alteration will be needed lately in the life cycle of the project
(Quality-one, 2019).
Question 3: Each part of the QFD matrix
There are four parts of the QFD matrix. These include:
Product definition: This phase starts with accumulation of the demands of the
customers and translating the demands of the customers into the product specification.
Product development: In this part, the essential assemblies and parts are found out.
Essential product characteristics are cascaded down and translated to critical or key
parts and assembly specifications or characteristics.
Process development: In this part, processes related to manufacturing and assembly
are planned on the basis of specifications of product and components. There is
development of process flow and essential process characteristics are also found out
(Borysowich, 2019).
⊘ This is a preview!⊘
Do you want full access?
Subscribe today to unlock all pages.
Trusted by 1+ million students worldwide
3
Process quality control: Before launching of the production, QFD process recognizes
essential parts and process characteristics. Process parameters are found out and
suitable process control are created and applied.
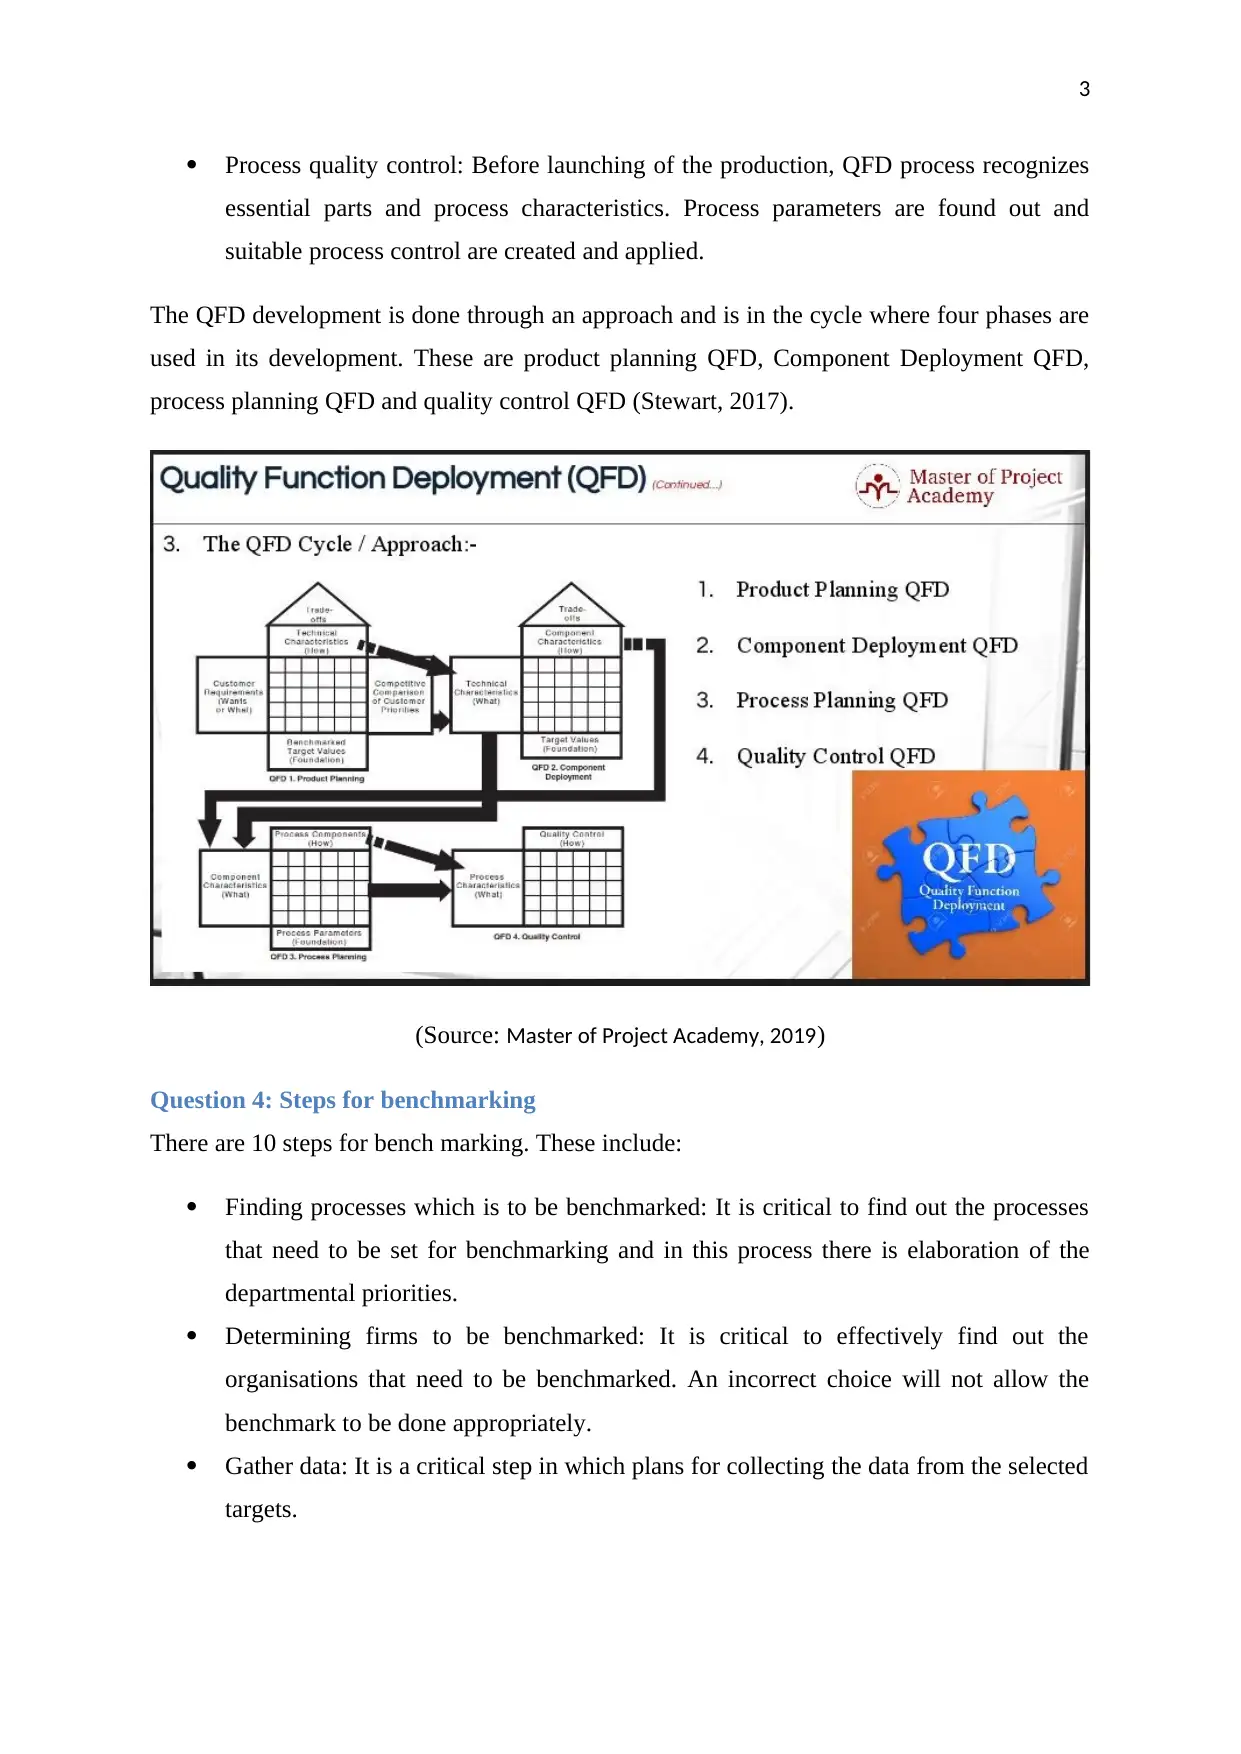
The QFD development is done through an approach and is in the cycle where four phases are
used in its development. These are product planning QFD, Component Deployment QFD,
process planning QFD and quality control QFD (Stewart, 2017).
(Source: Master of Project Academy, 2019)
Question 4: Steps for benchmarking
There are 10 steps for bench marking. These include:
Finding processes which is to be benchmarked: It is critical to find out the processes
that need to be set for benchmarking and in this process there is elaboration of the
departmental priorities.
Determining firms to be benchmarked: It is critical to effectively find out the
organisations that need to be benchmarked. An incorrect choice will not allow the
benchmark to be done appropriately.
Gather data: It is a critical step in which plans for collecting the data from the selected
targets.
Process quality control: Before launching of the production, QFD process recognizes
essential parts and process characteristics. Process parameters are found out and
suitable process control are created and applied.
The QFD development is done through an approach and is in the cycle where four phases are
used in its development. These are product planning QFD, Component Deployment QFD,
process planning QFD and quality control QFD (Stewart, 2017).
(Source: Master of Project Academy, 2019)
Question 4: Steps for benchmarking
There are 10 steps for bench marking. These include:
Finding processes which is to be benchmarked: It is critical to find out the processes
that need to be set for benchmarking and in this process there is elaboration of the
departmental priorities.
Determining firms to be benchmarked: It is critical to effectively find out the
organisations that need to be benchmarked. An incorrect choice will not allow the
benchmark to be done appropriately.
Gather data: It is a critical step in which plans for collecting the data from the selected
targets.
Paraphrase This Document
Need a fresh take? Get an instant paraphrase of this document with our AI Paraphraser
4
Gap analysis: In this process there is analysis of the data accumulation and hence
performance lag is found out and accordingly the best attributes from the best
practices into a process that are ideal are found (Burke, 2019).
Determining future trends: Find out future demands and the previous performance in
relation to their rivals, forecasting probable alterations.
Reveal outcomes and sell the process: In this there is communication about the
benchmarking results and their impact to higher numbers of people in the firm and
motivating the audience to carry on with alterations.
Attain accord of revised goals: In this there is revision of the goals to overcome the
gap in the performance found out in above step.
Establishing of action plan: There must be designing of the step-by-step plan for
achieving the desired goals.
Implementing plans and monitoring outcomes: The steps include executing the agreed
best-practice processes and daily monitoring of alterations.
Recalibrate benchmarks: This step make sure that the firm stays on the cutting edge
by regular evaluation of the benchmarked practices.
Question 5: Description of six sigma tools
There are different types tools utilised in Six sigma. Among them the some of the tools that
can be utilised are:
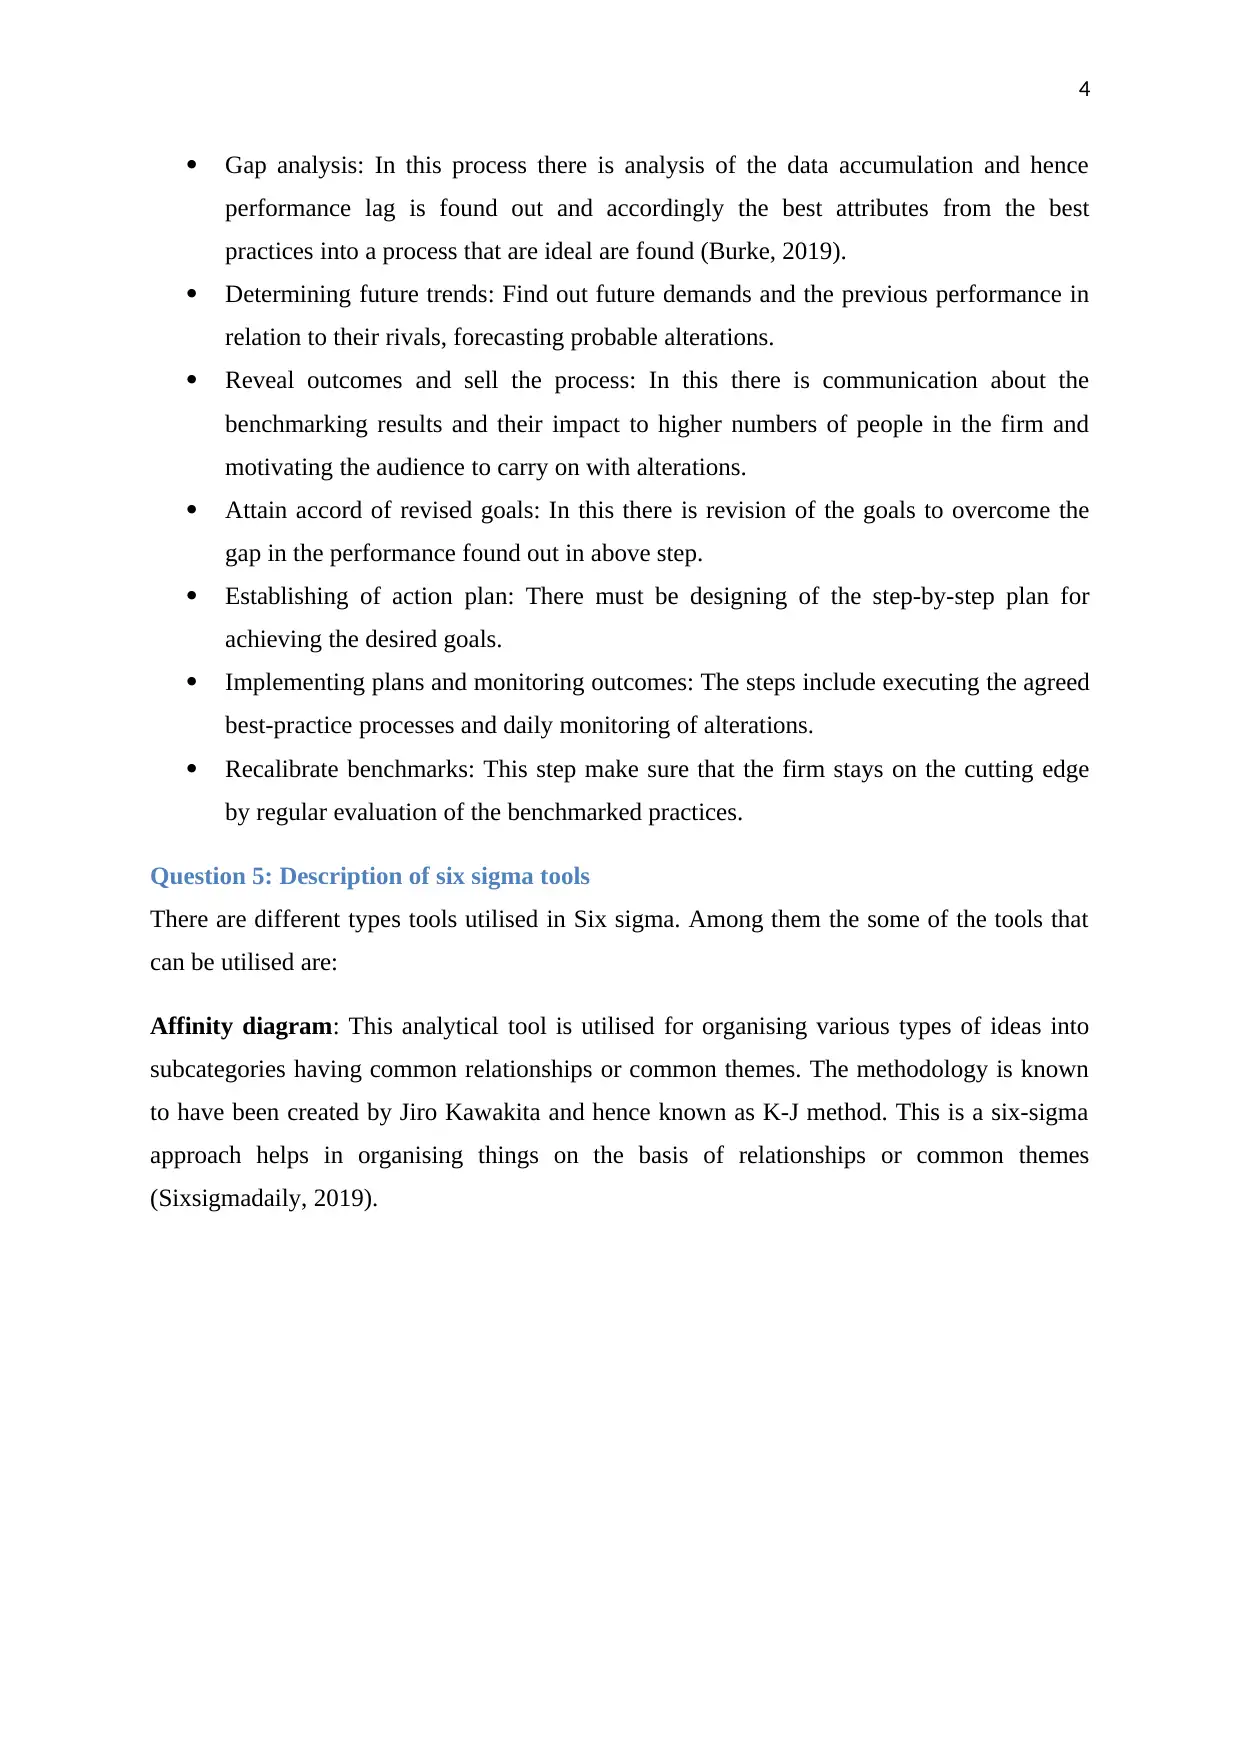
Affinity diagram: This analytical tool is utilised for organising various types of ideas into
subcategories having common relationships or common themes. The methodology is known
to have been created by Jiro Kawakita and hence known as K-J method. This is a six-sigma
approach helps in organising things on the basis of relationships or common themes
(Sixsigmadaily, 2019).
Gap analysis: In this process there is analysis of the data accumulation and hence
performance lag is found out and accordingly the best attributes from the best
practices into a process that are ideal are found (Burke, 2019).
Determining future trends: Find out future demands and the previous performance in
relation to their rivals, forecasting probable alterations.
Reveal outcomes and sell the process: In this there is communication about the
benchmarking results and their impact to higher numbers of people in the firm and
motivating the audience to carry on with alterations.
Attain accord of revised goals: In this there is revision of the goals to overcome the
gap in the performance found out in above step.
Establishing of action plan: There must be designing of the step-by-step plan for
achieving the desired goals.
Implementing plans and monitoring outcomes: The steps include executing the agreed
best-practice processes and daily monitoring of alterations.
Recalibrate benchmarks: This step make sure that the firm stays on the cutting edge
by regular evaluation of the benchmarked practices.
Question 5: Description of six sigma tools
There are different types tools utilised in Six sigma. Among them the some of the tools that
can be utilised are:
Affinity diagram: This analytical tool is utilised for organising various types of ideas into
subcategories having common relationships or common themes. The methodology is known
to have been created by Jiro Kawakita and hence known as K-J method. This is a six-sigma
approach helps in organising things on the basis of relationships or common themes
(Sixsigmadaily, 2019).
5
Figure 1: Affinity Diagram
(Source: Edrawsoft, 2019)
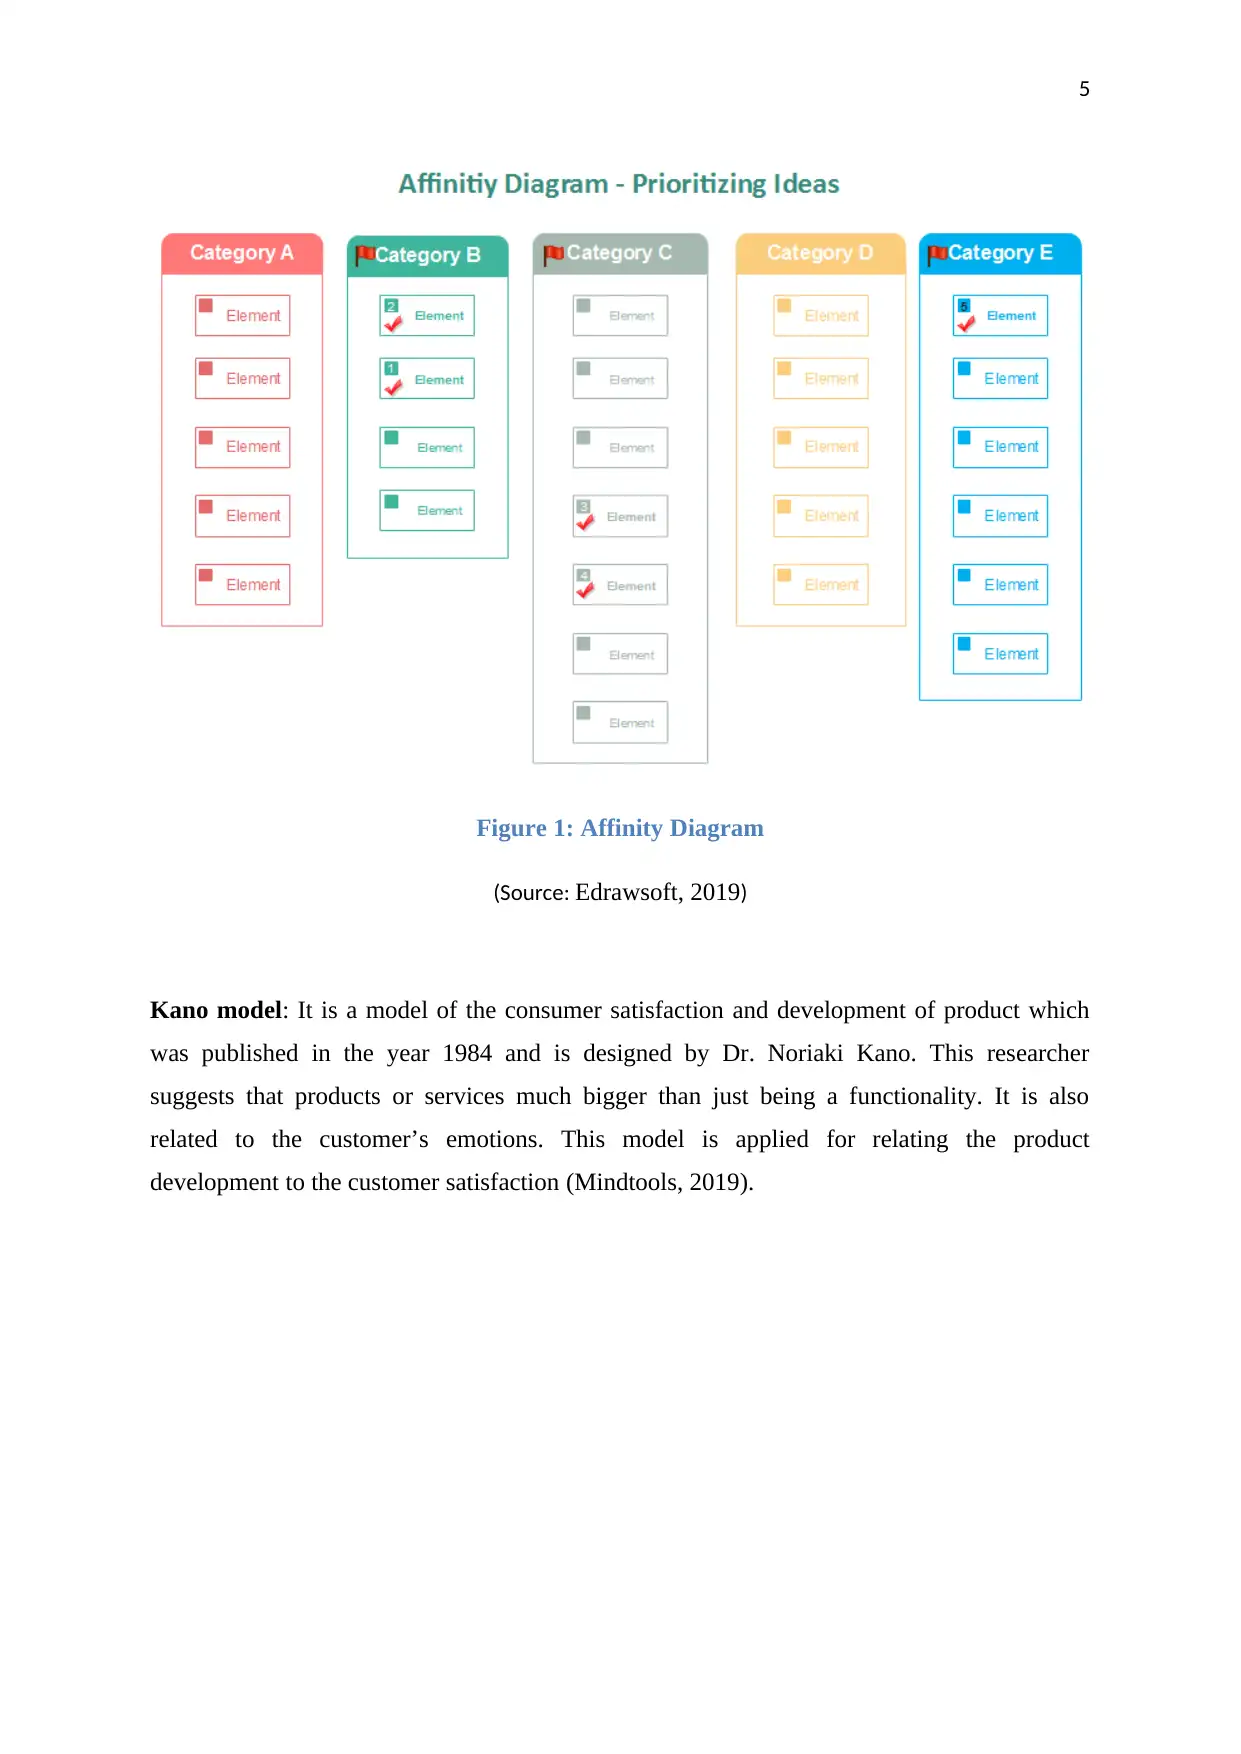
Kano model: It is a model of the consumer satisfaction and development of product which
was published in the year 1984 and is designed by Dr. Noriaki Kano. This researcher
suggests that products or services much bigger than just being a functionality. It is also
related to the customer’s emotions. This model is applied for relating the product
development to the customer satisfaction (Mindtools, 2019).
Figure 1: Affinity Diagram
(Source: Edrawsoft, 2019)
Kano model: It is a model of the consumer satisfaction and development of product which
was published in the year 1984 and is designed by Dr. Noriaki Kano. This researcher
suggests that products or services much bigger than just being a functionality. It is also
related to the customer’s emotions. This model is applied for relating the product
development to the customer satisfaction (Mindtools, 2019).
⊘ This is a preview!⊘
Do you want full access?
Subscribe today to unlock all pages.
Trusted by 1+ million students worldwide
6
Figure 2: Kano Model
(Source: Creative Safety Supply, 2017)
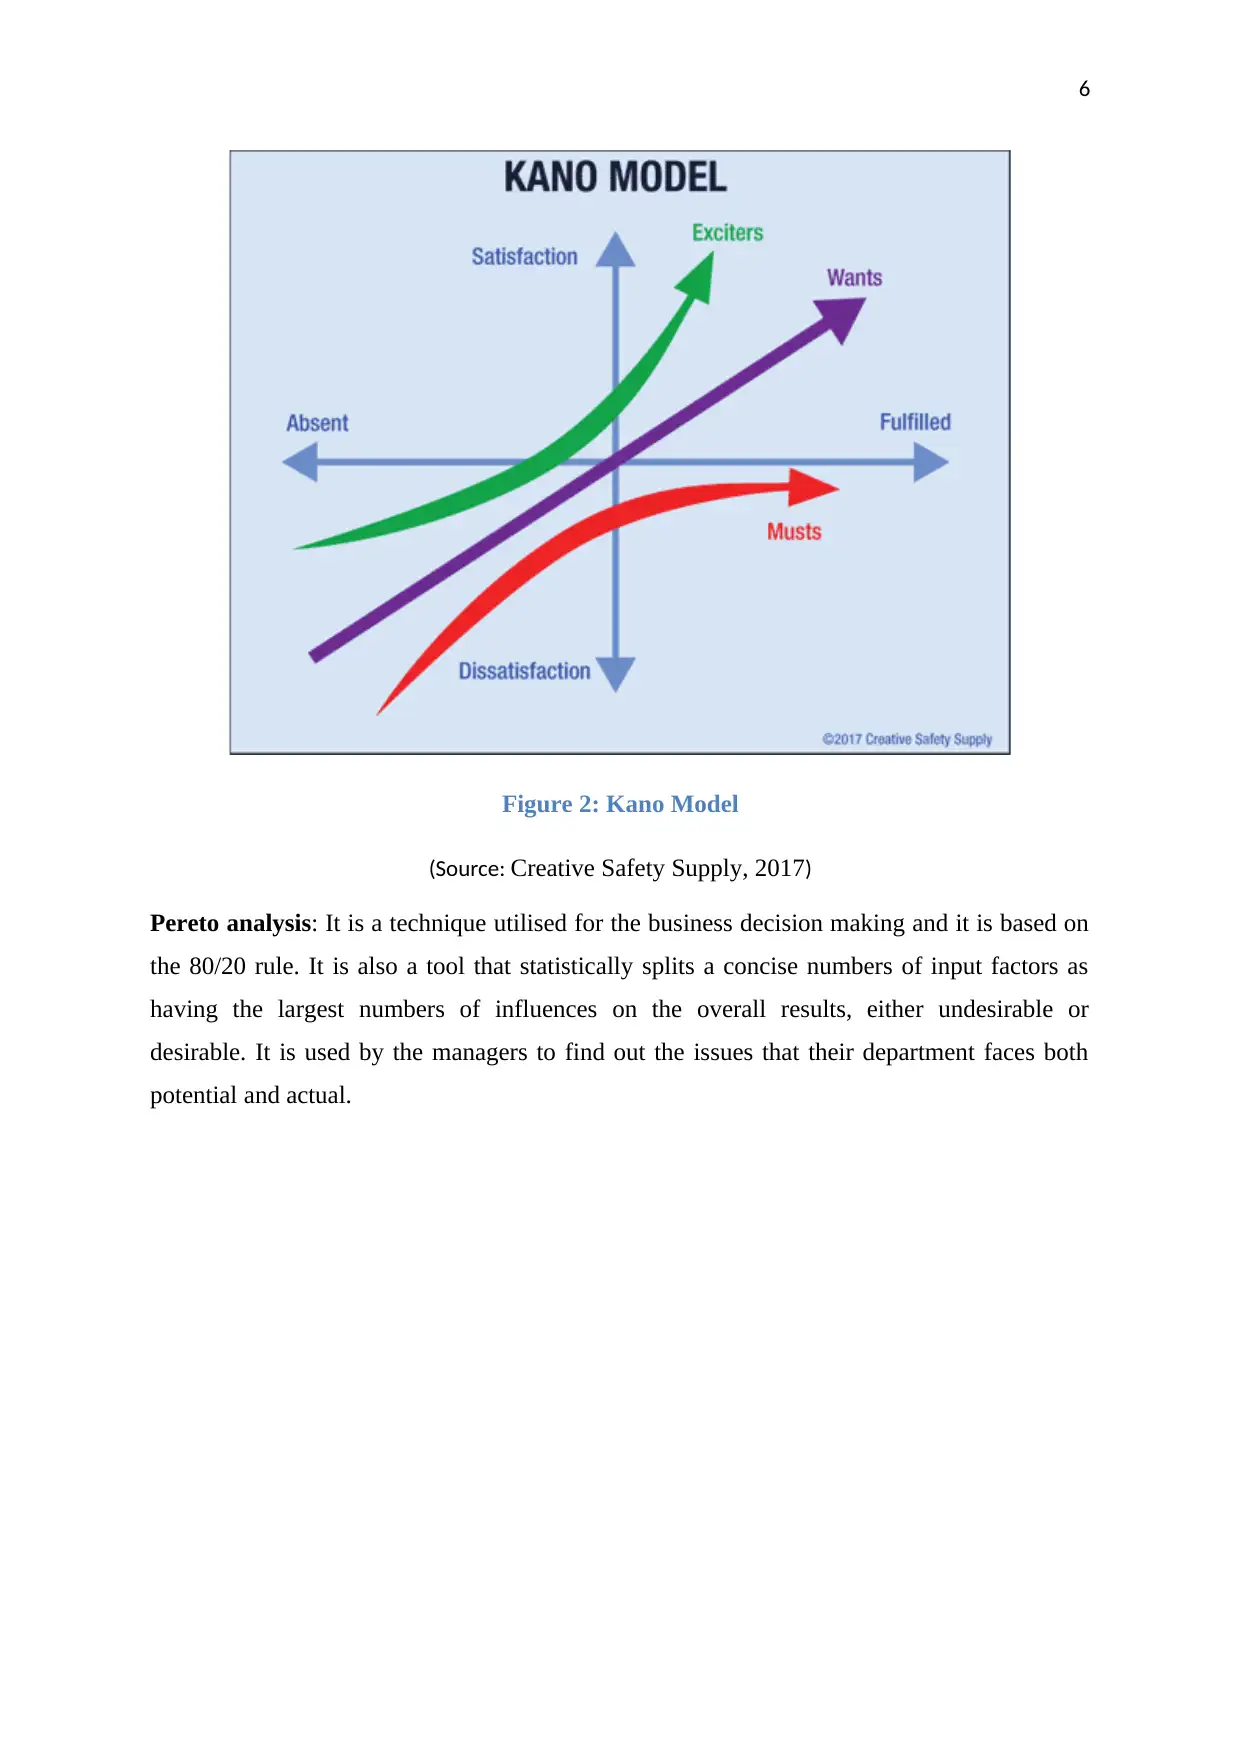
Pereto analysis: It is a technique utilised for the business decision making and it is based on
the 80/20 rule. It is also a tool that statistically splits a concise numbers of input factors as
having the largest numbers of influences on the overall results, either undesirable or
desirable. It is used by the managers to find out the issues that their department faces both
potential and actual.
Figure 2: Kano Model
(Source: Creative Safety Supply, 2017)
Pereto analysis: It is a technique utilised for the business decision making and it is based on
the 80/20 rule. It is also a tool that statistically splits a concise numbers of input factors as
having the largest numbers of influences on the overall results, either undesirable or
desirable. It is used by the managers to find out the issues that their department faces both
potential and actual.
Paraphrase This Document
Need a fresh take? Get an instant paraphrase of this document with our AI Paraphraser
7
Figure 3: Pareto analysis
(Source: Haughey, 2019)
Brainstorming: This is a group creativity technique in which activities are done for finding
out the conclusion for any given problem. It is done by accumulating idea’s list
spontaneously contributed by their associates. Brainstorming is always used in the areas
where an innovative idea needs to be used for resolving any problem.
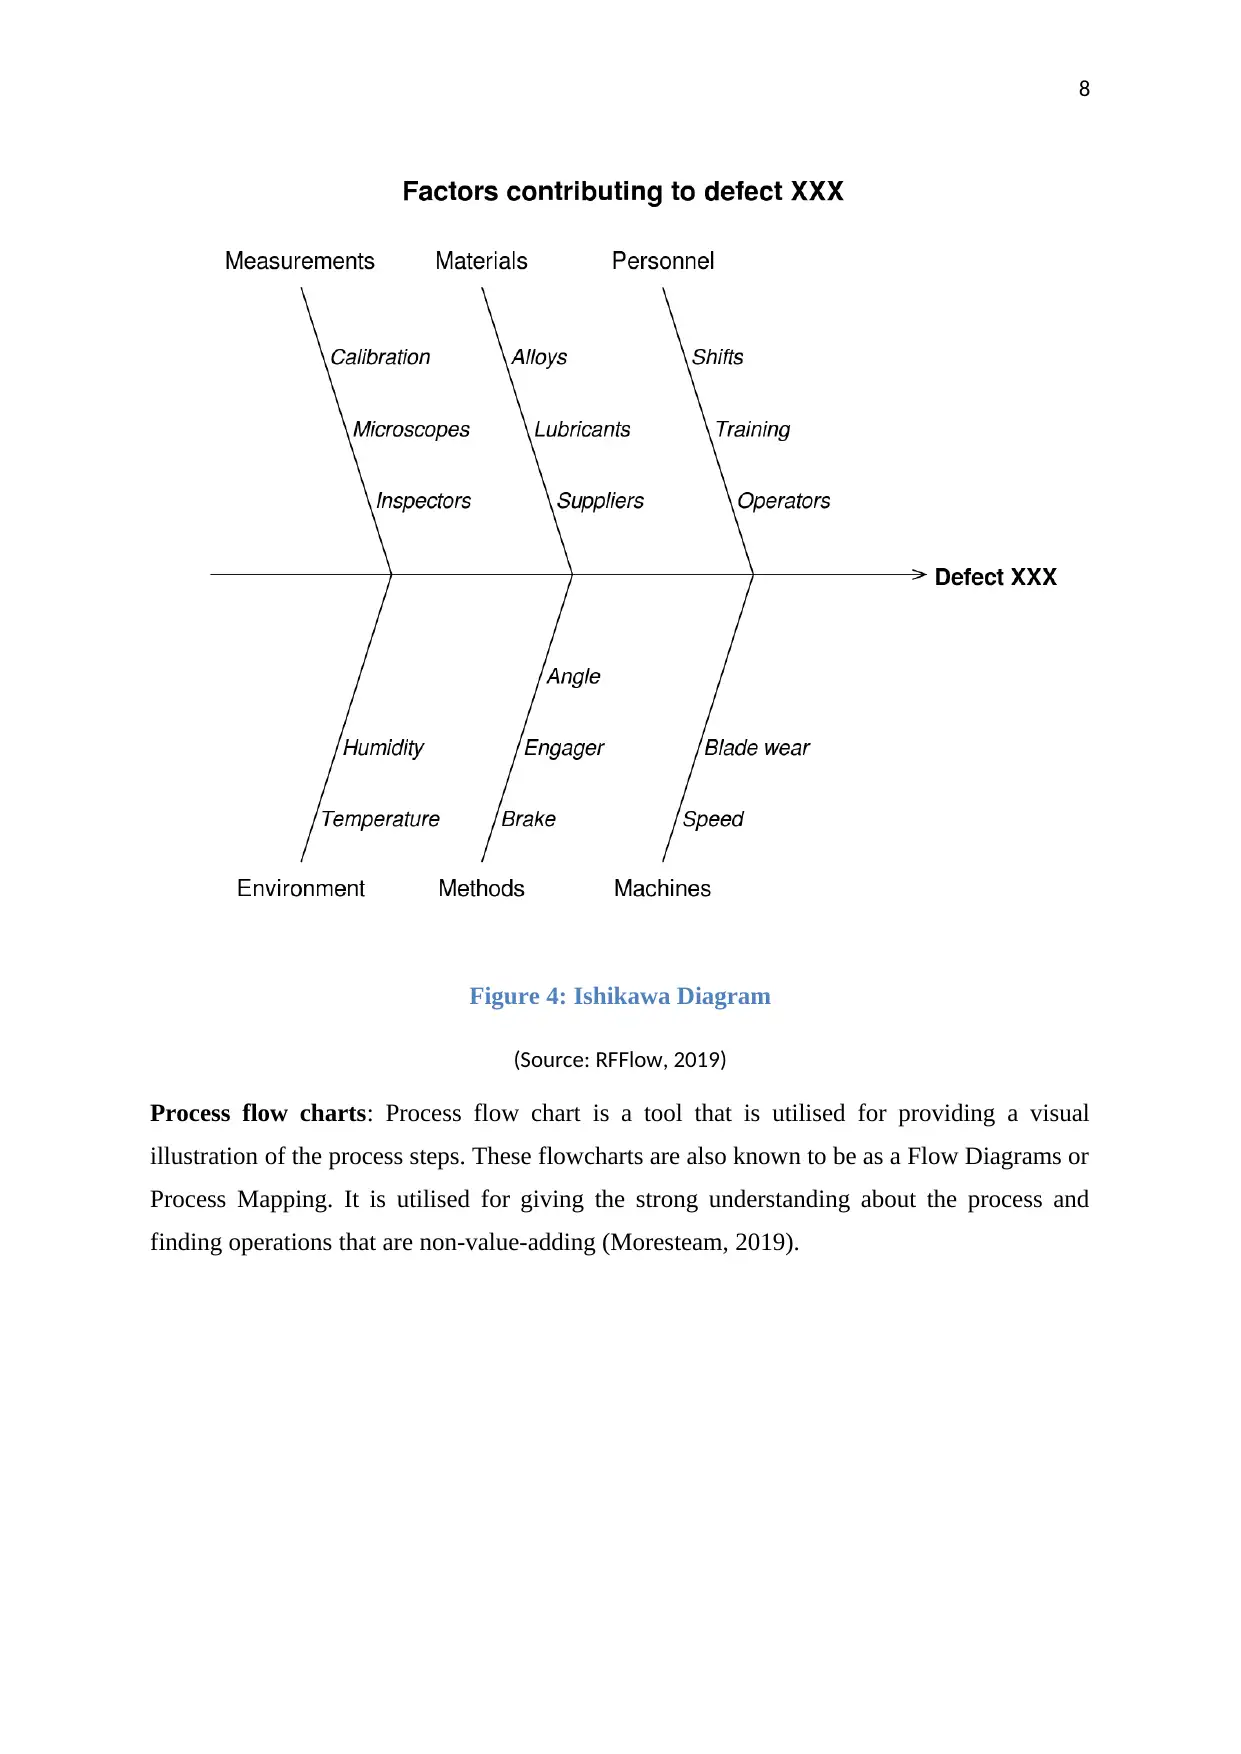
Fishbone or Ishikawa: This diagram illustrates about the causes that led to particular events.
Common utilisation of this tool is for product design as well as prevention of quality defect
by finding out the potential factors that causes these specific events.
Figure 3: Pareto analysis
(Source: Haughey, 2019)
Brainstorming: This is a group creativity technique in which activities are done for finding
out the conclusion for any given problem. It is done by accumulating idea’s list
spontaneously contributed by their associates. Brainstorming is always used in the areas
where an innovative idea needs to be used for resolving any problem.
Fishbone or Ishikawa: This diagram illustrates about the causes that led to particular events.
Common utilisation of this tool is for product design as well as prevention of quality defect
by finding out the potential factors that causes these specific events.
8
Figure 4: Ishikawa Diagram
(Source: RFFlow, 2019)
Process flow charts: Process flow chart is a tool that is utilised for providing a visual
illustration of the process steps. These flowcharts are also known to be as a Flow Diagrams or
Process Mapping. It is utilised for giving the strong understanding about the process and
finding operations that are non-value-adding (Moresteam, 2019).
⊘ This is a preview!⊘
Do you want full access?
Subscribe today to unlock all pages.
Trusted by 1+ million students worldwide
9
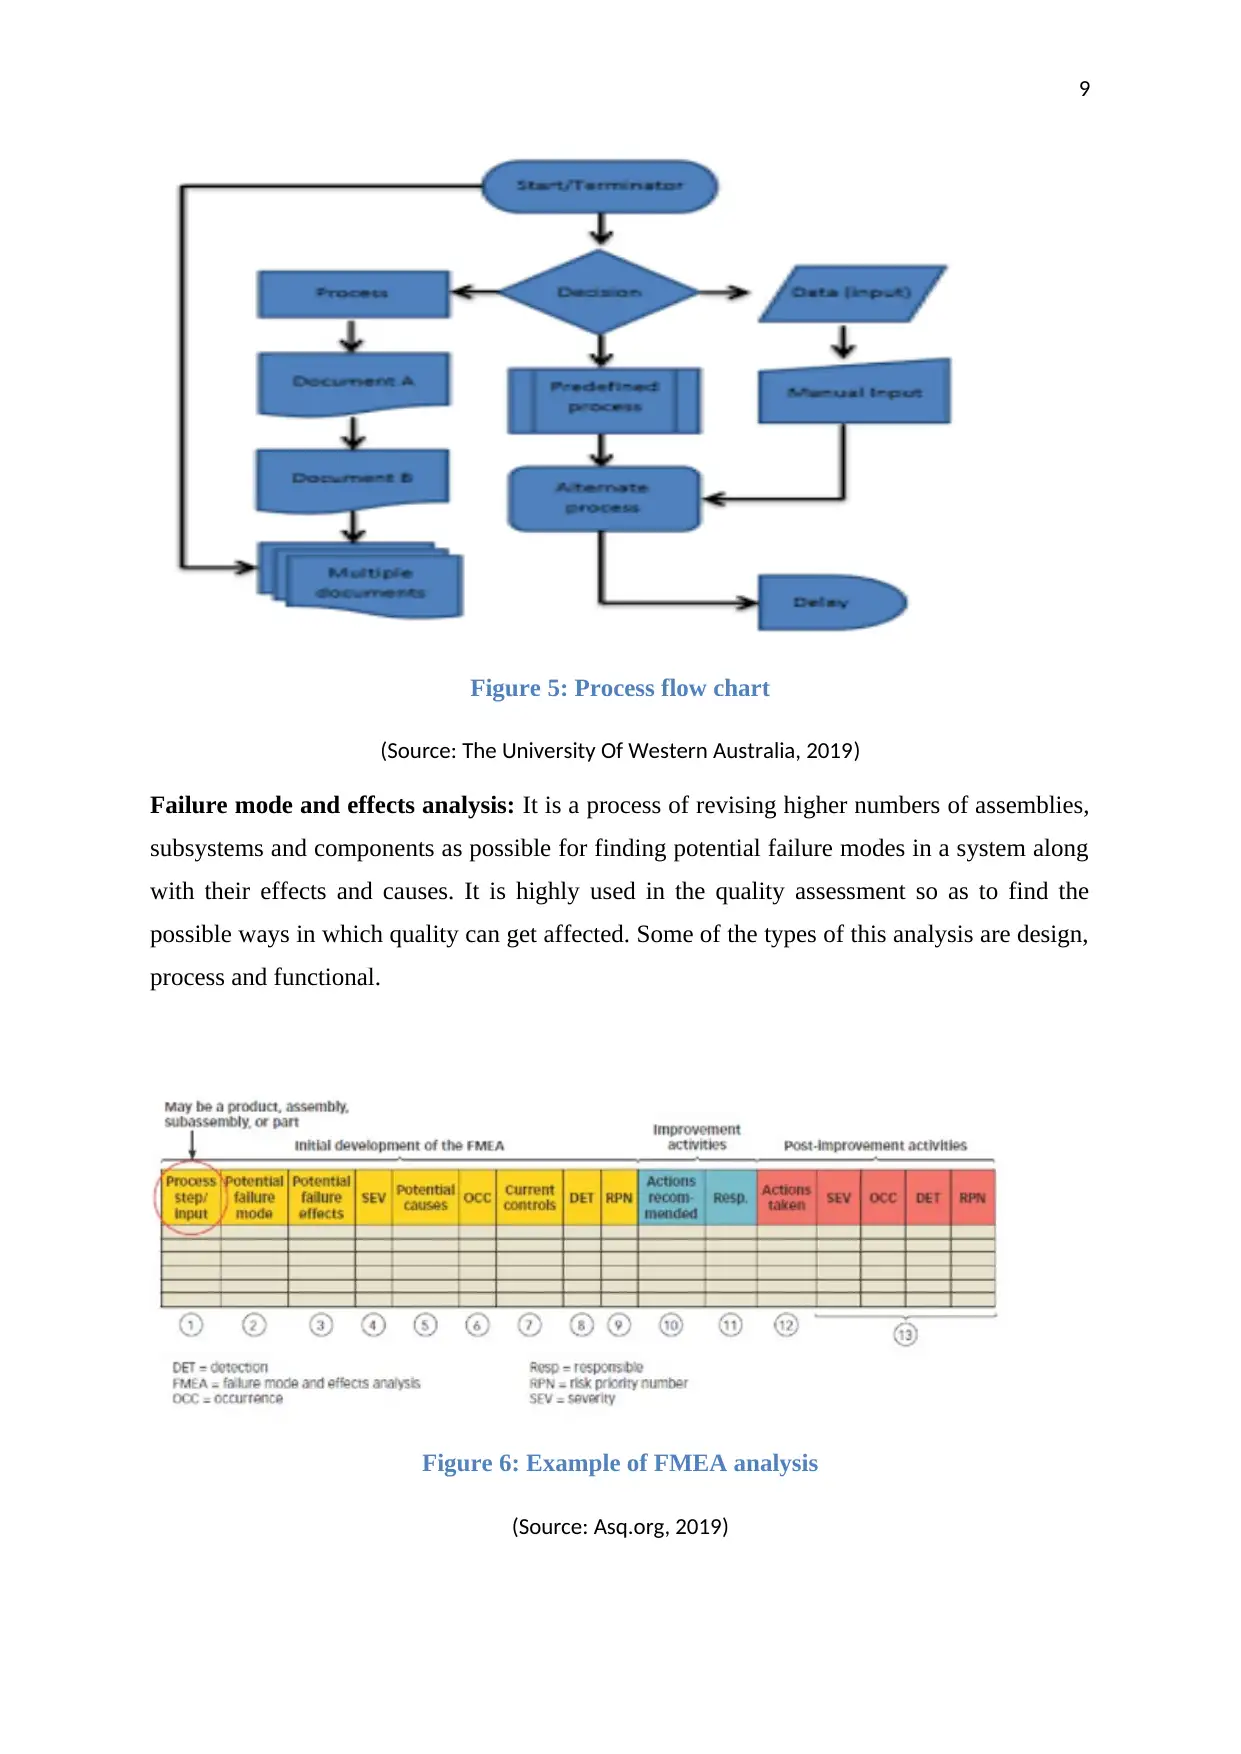
Figure 5: Process flow chart
(Source: The University Of Western Australia, 2019)
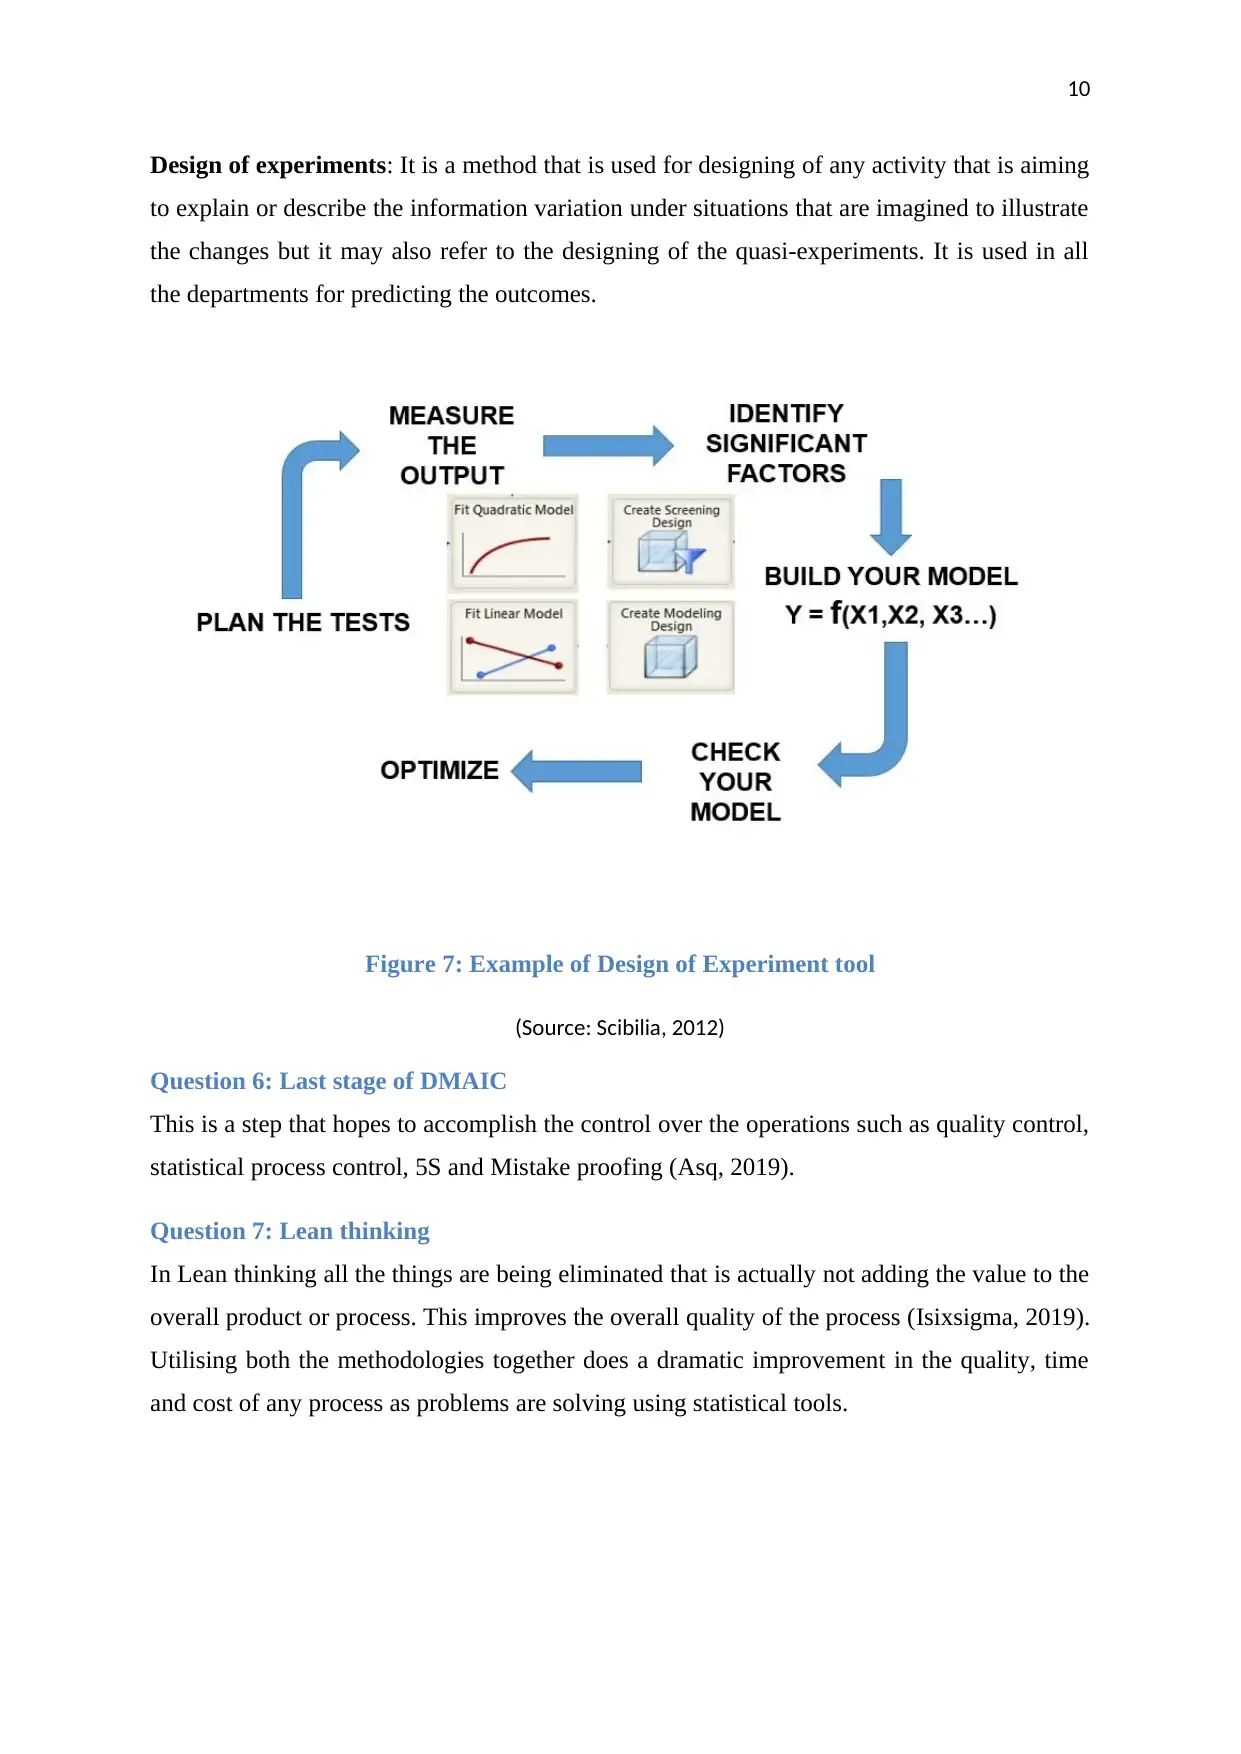
Failure mode and effects analysis: It is a process of revising higher numbers of assemblies,
subsystems and components as possible for finding potential failure modes in a system along
with their effects and causes. It is highly used in the quality assessment so as to find the
possible ways in which quality can get affected. Some of the types of this analysis are design,
process and functional.
Figure 6: Example of FMEA analysis
(Source: Asq.org, 2019)
Figure 5: Process flow chart
(Source: The University Of Western Australia, 2019)
Failure mode and effects analysis: It is a process of revising higher numbers of assemblies,
subsystems and components as possible for finding potential failure modes in a system along
with their effects and causes. It is highly used in the quality assessment so as to find the
possible ways in which quality can get affected. Some of the types of this analysis are design,
process and functional.
Figure 6: Example of FMEA analysis
(Source: Asq.org, 2019)
Paraphrase This Document
Need a fresh take? Get an instant paraphrase of this document with our AI Paraphraser
10
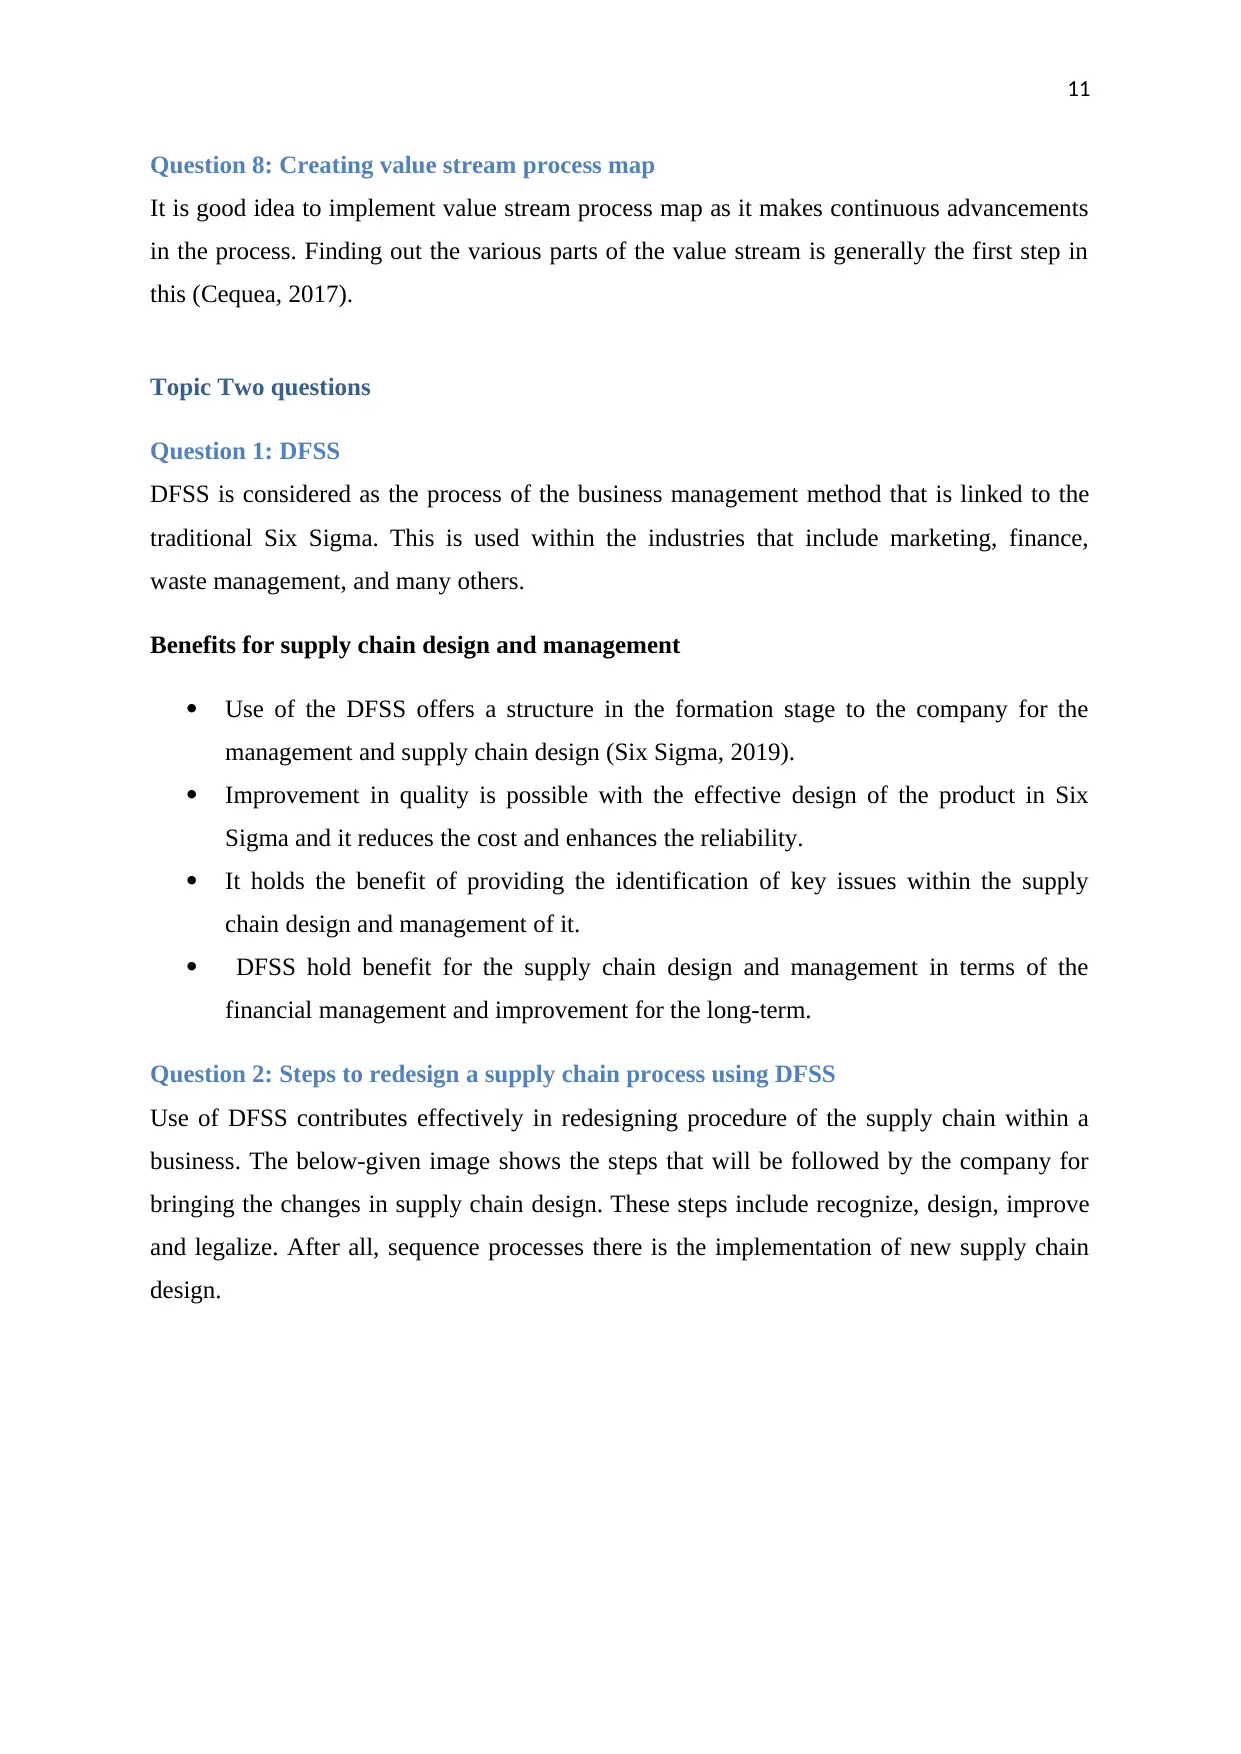
Design of experiments: It is a method that is used for designing of any activity that is aiming
to explain or describe the information variation under situations that are imagined to illustrate
the changes but it may also refer to the designing of the quasi-experiments. It is used in all
the departments for predicting the outcomes.
Figure 7: Example of Design of Experiment tool
(Source: Scibilia, 2012)
Question 6: Last stage of DMAIC
This is a step that hopes to accomplish the control over the operations such as quality control,
statistical process control, 5S and Mistake proofing (Asq, 2019).
Question 7: Lean thinking
In Lean thinking all the things are being eliminated that is actually not adding the value to the
overall product or process. This improves the overall quality of the process (Isixsigma, 2019).
Utilising both the methodologies together does a dramatic improvement in the quality, time
and cost of any process as problems are solving using statistical tools.
11
Question 8: Creating value stream process map
It is good idea to implement value stream process map as it makes continuous advancements
in the process. Finding out the various parts of the value stream is generally the first step in
this (Cequea, 2017).
Topic Two questions
Question 1: DFSS
DFSS is considered as the process of the business management method that is linked to the
traditional Six Sigma. This is used within the industries that include marketing, finance,
waste management, and many others.
Benefits for supply chain design and management
Use of the DFSS offers a structure in the formation stage to the company for the
management and supply chain design (Six Sigma, 2019).
Improvement in quality is possible with the effective design of the product in Six
Sigma and it reduces the cost and enhances the reliability.
It holds the benefit of providing the identification of key issues within the supply
chain design and management of it.
DFSS hold benefit for the supply chain design and management in terms of the
financial management and improvement for the long-term.
Question 2: Steps to redesign a supply chain process using DFSS
Use of DFSS contributes effectively in redesigning procedure of the supply chain within a
business. The below-given image shows the steps that will be followed by the company for
bringing the changes in supply chain design. These steps include recognize, design, improve
and legalize. After all, sequence processes there is the implementation of new supply chain
design.
⊘ This is a preview!⊘
Do you want full access?
Subscribe today to unlock all pages.
Trusted by 1+ million students worldwide
1 out of 20
Related Documents


Your All-in-One AI-Powered Toolkit for Academic Success.
+13062052269
info@desklib.com
Available 24*7 on WhatsApp / Email
![[object Object]](/_next/static/media/star-bottom.7253800d.svg)
Unlock your academic potential
Copyright © 2020–2025 A2Z Services. All Rights Reserved. Developed and managed by ZUCOL.