Business Decision Making

Verified

Added on  2023/04/04

|19
|532
|393
PowerPoint Presentation
AI Summary
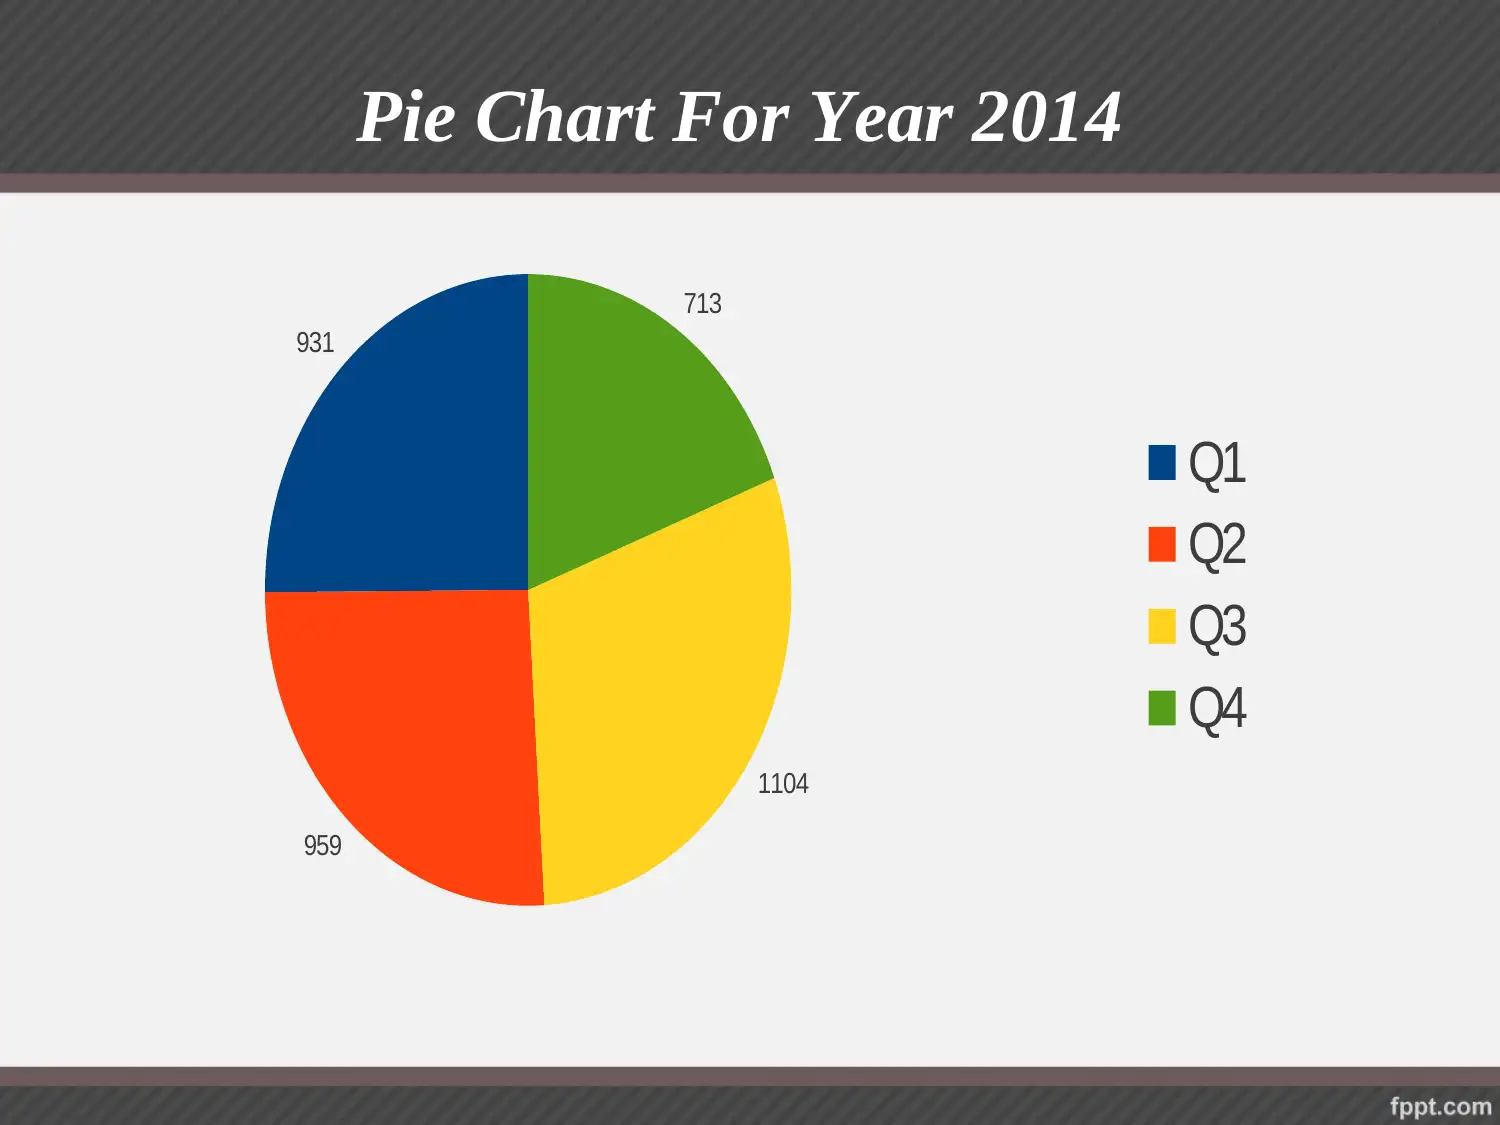
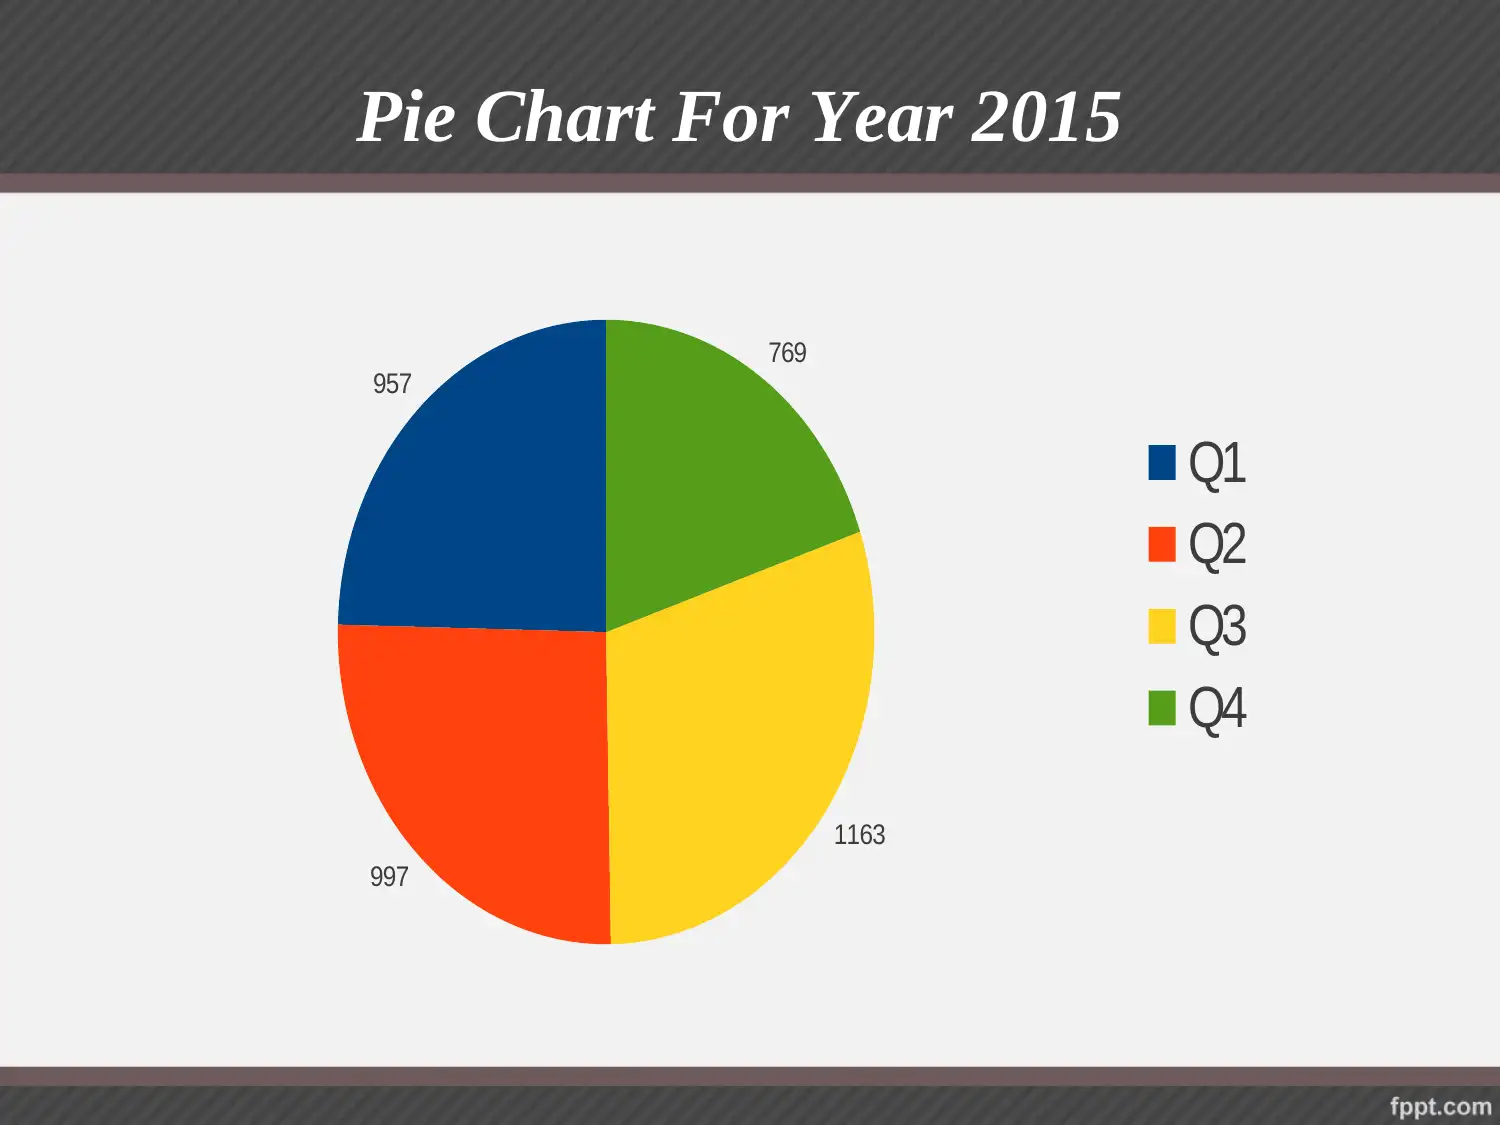
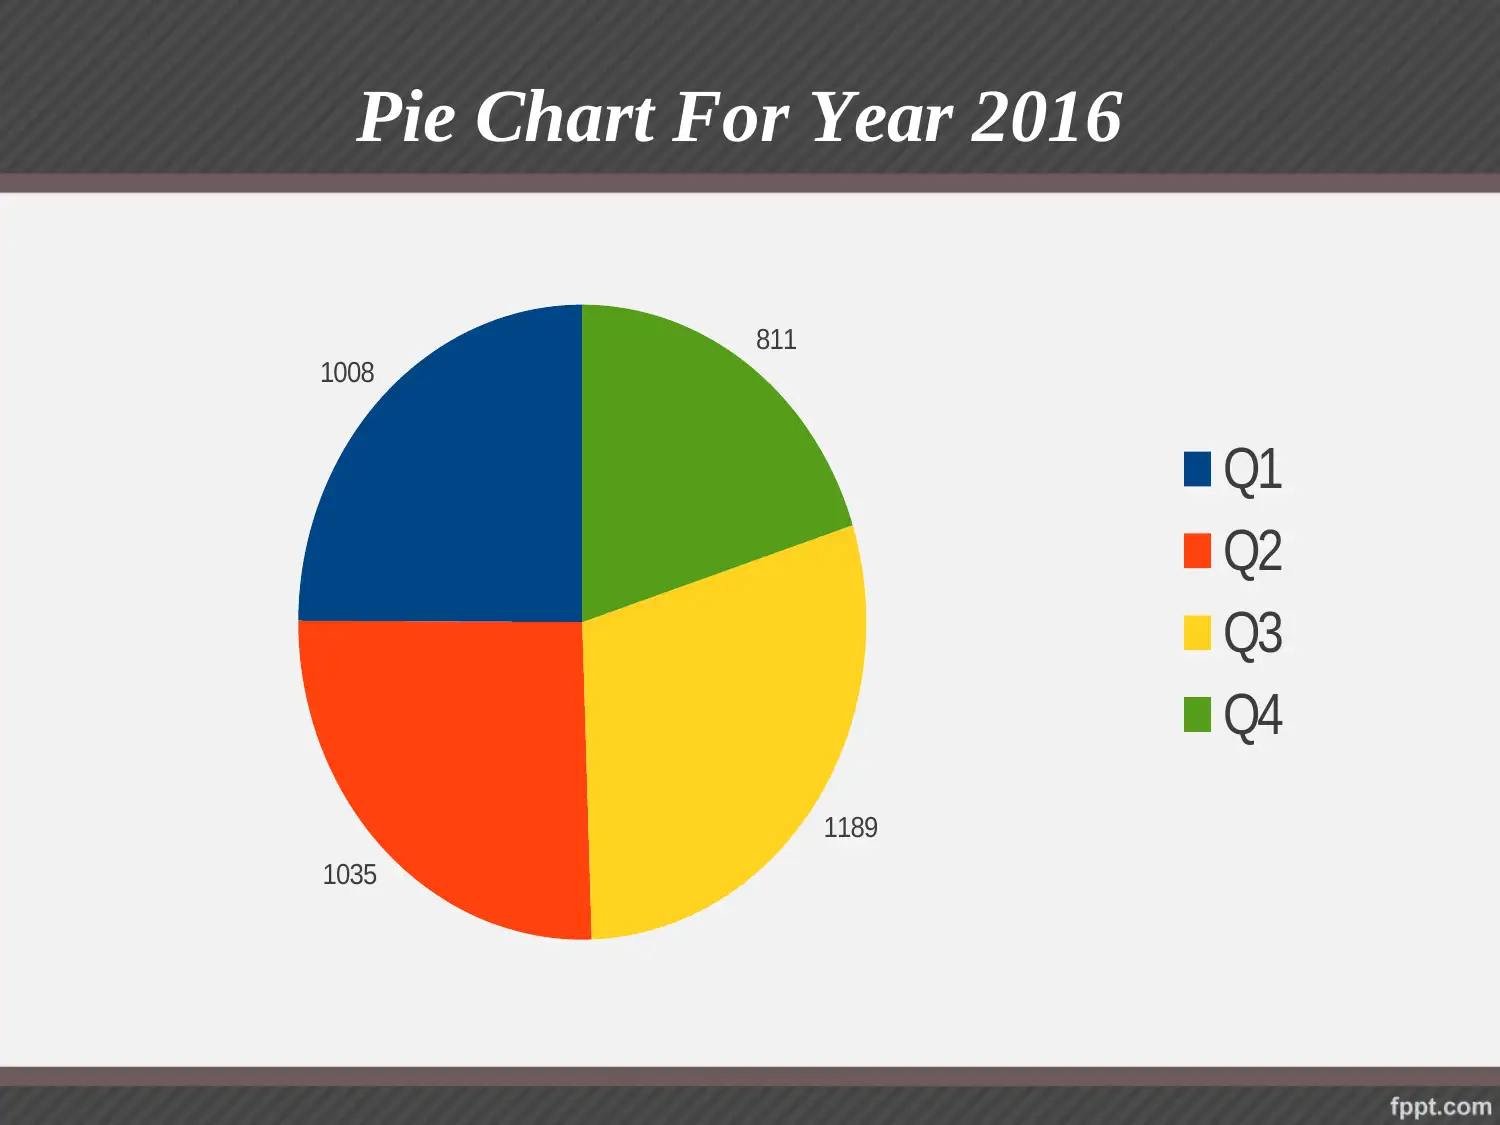
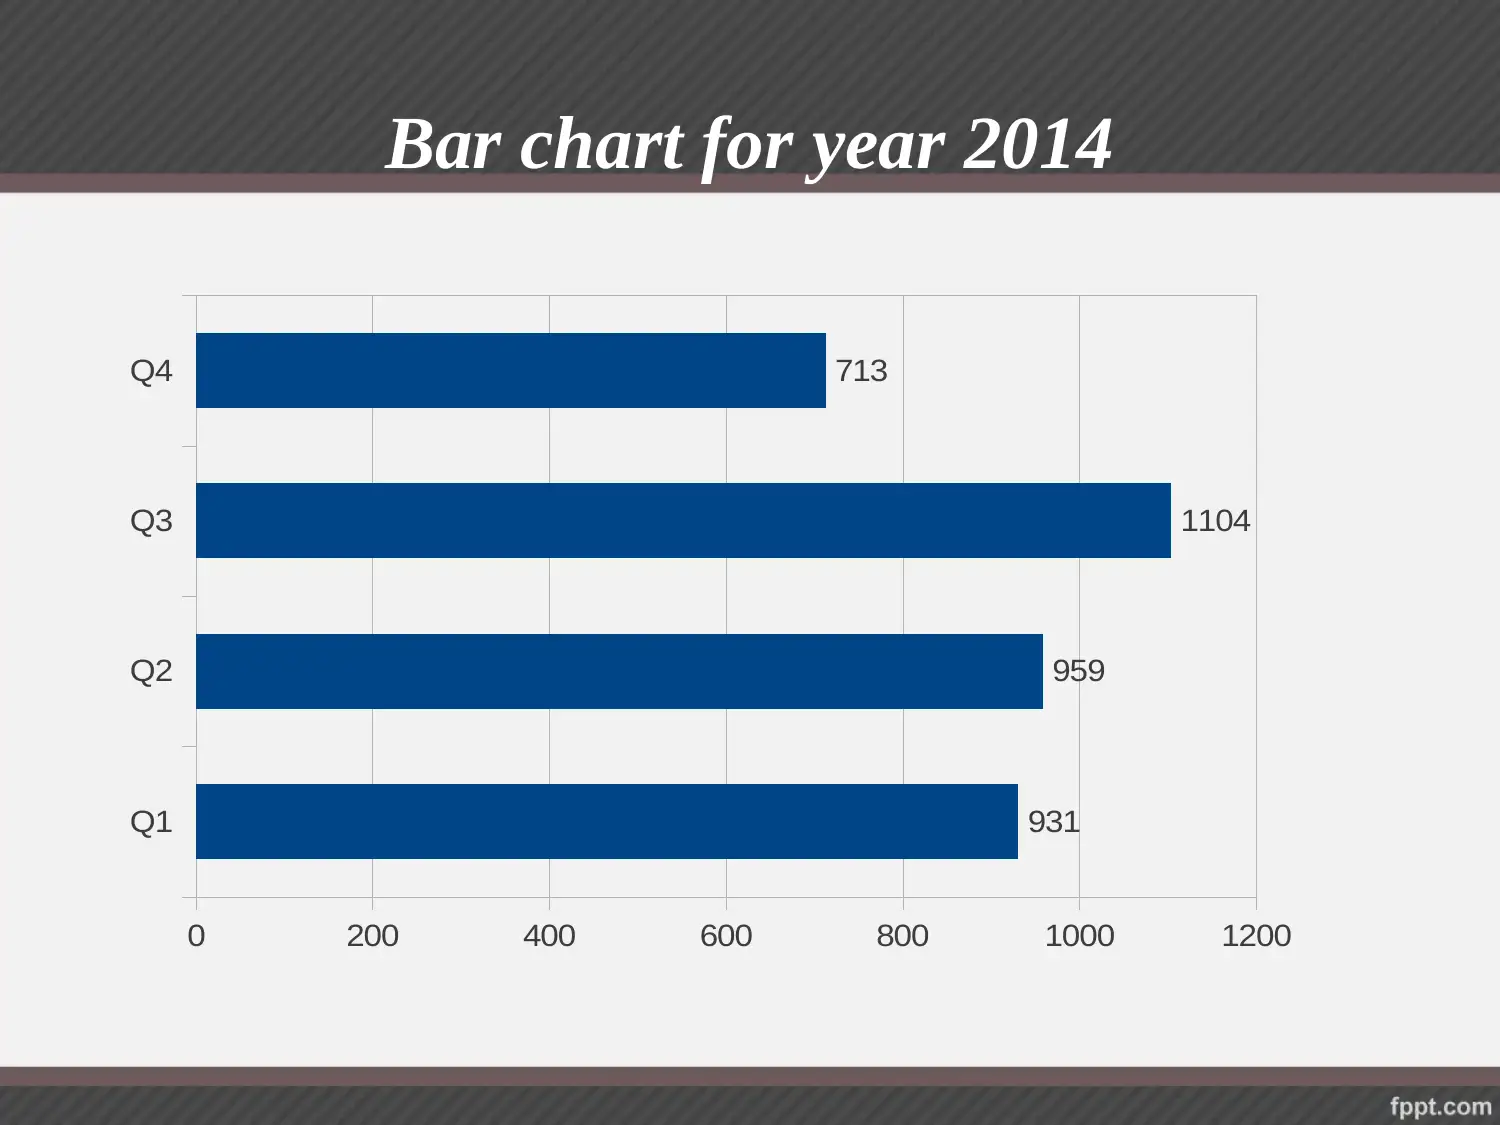
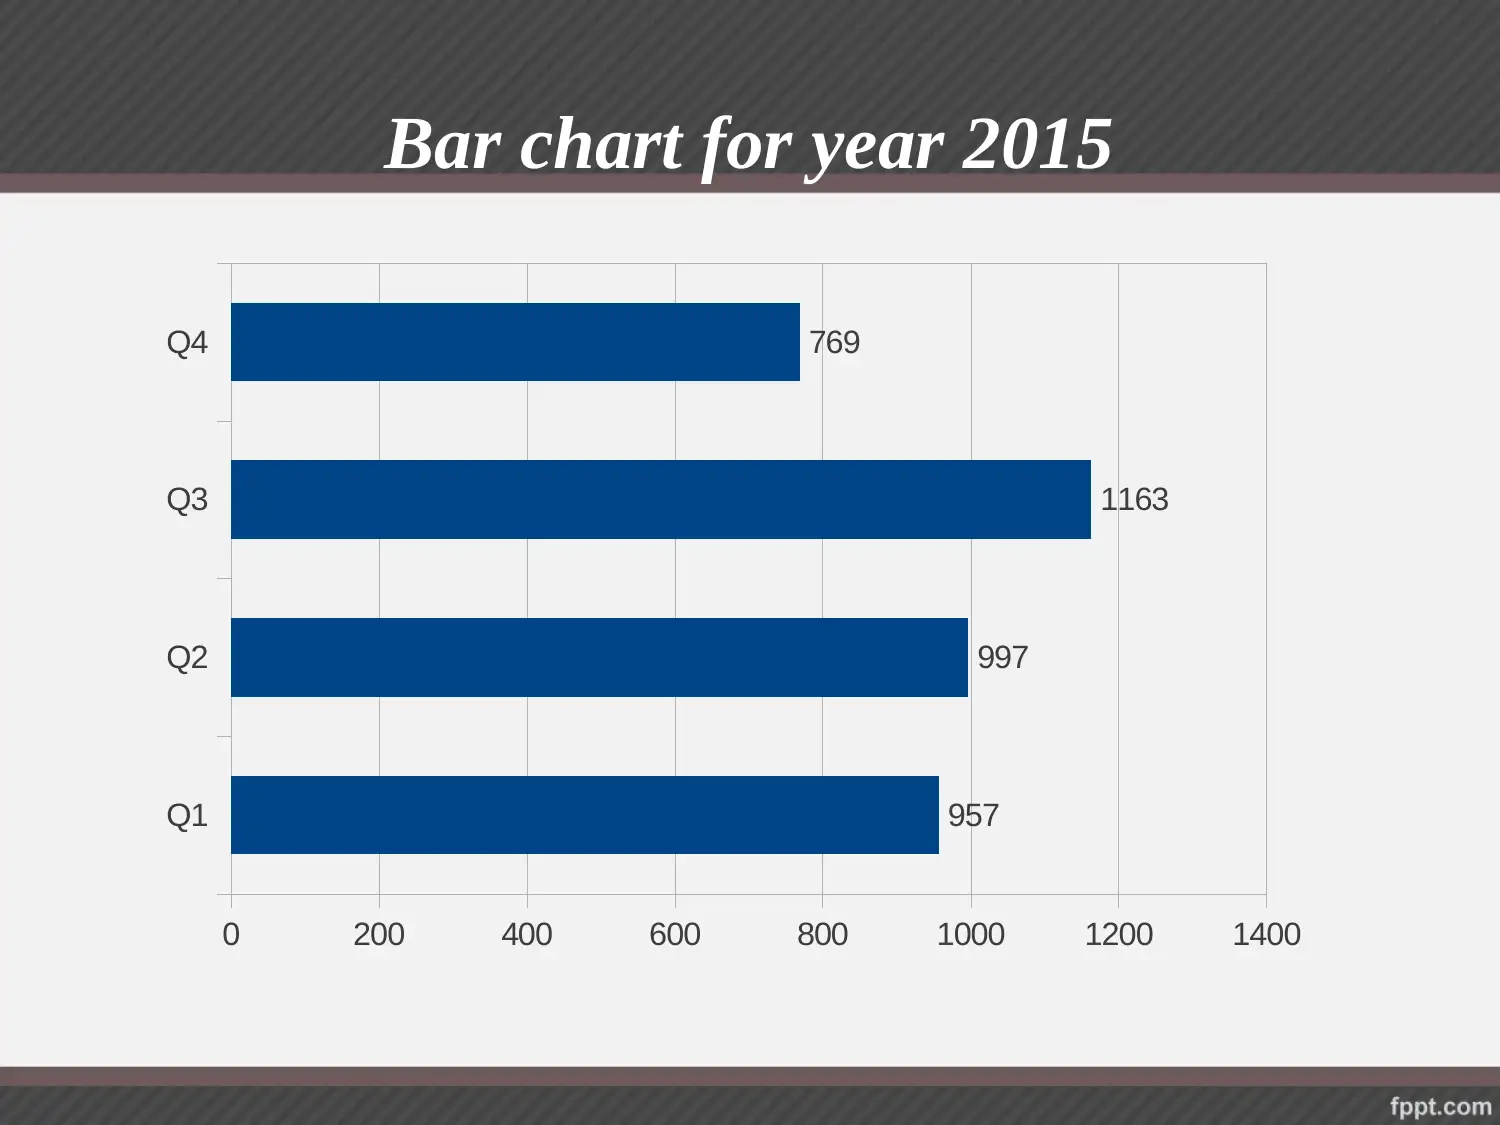
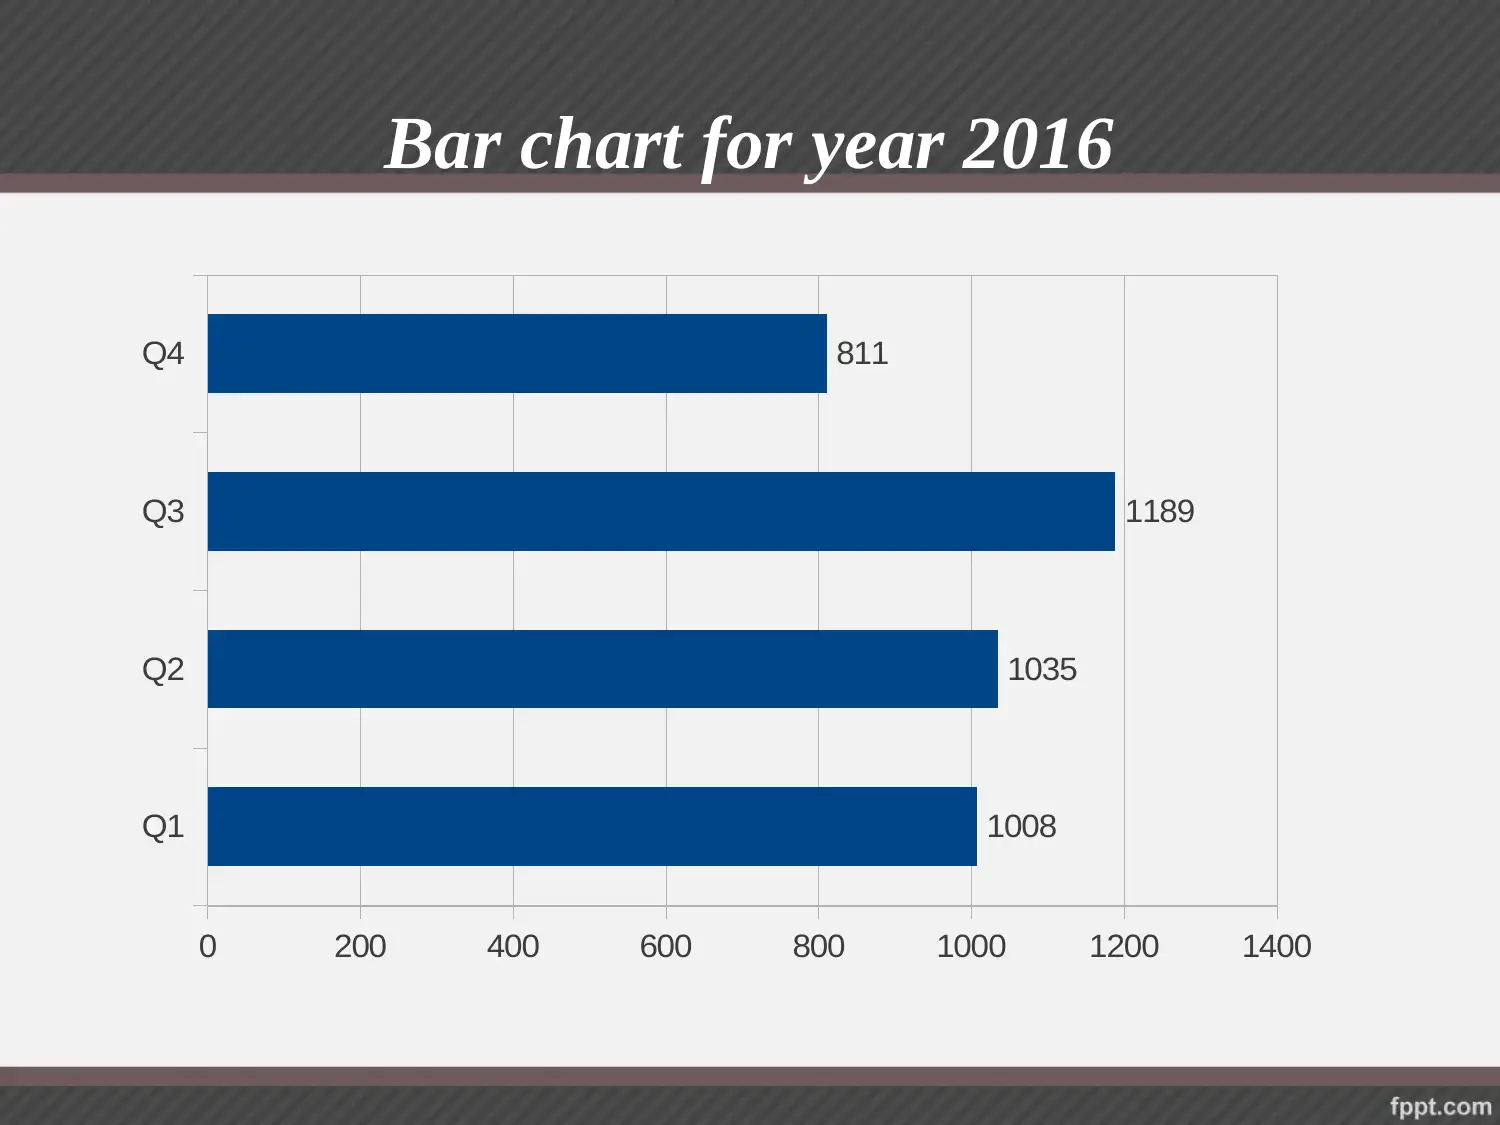
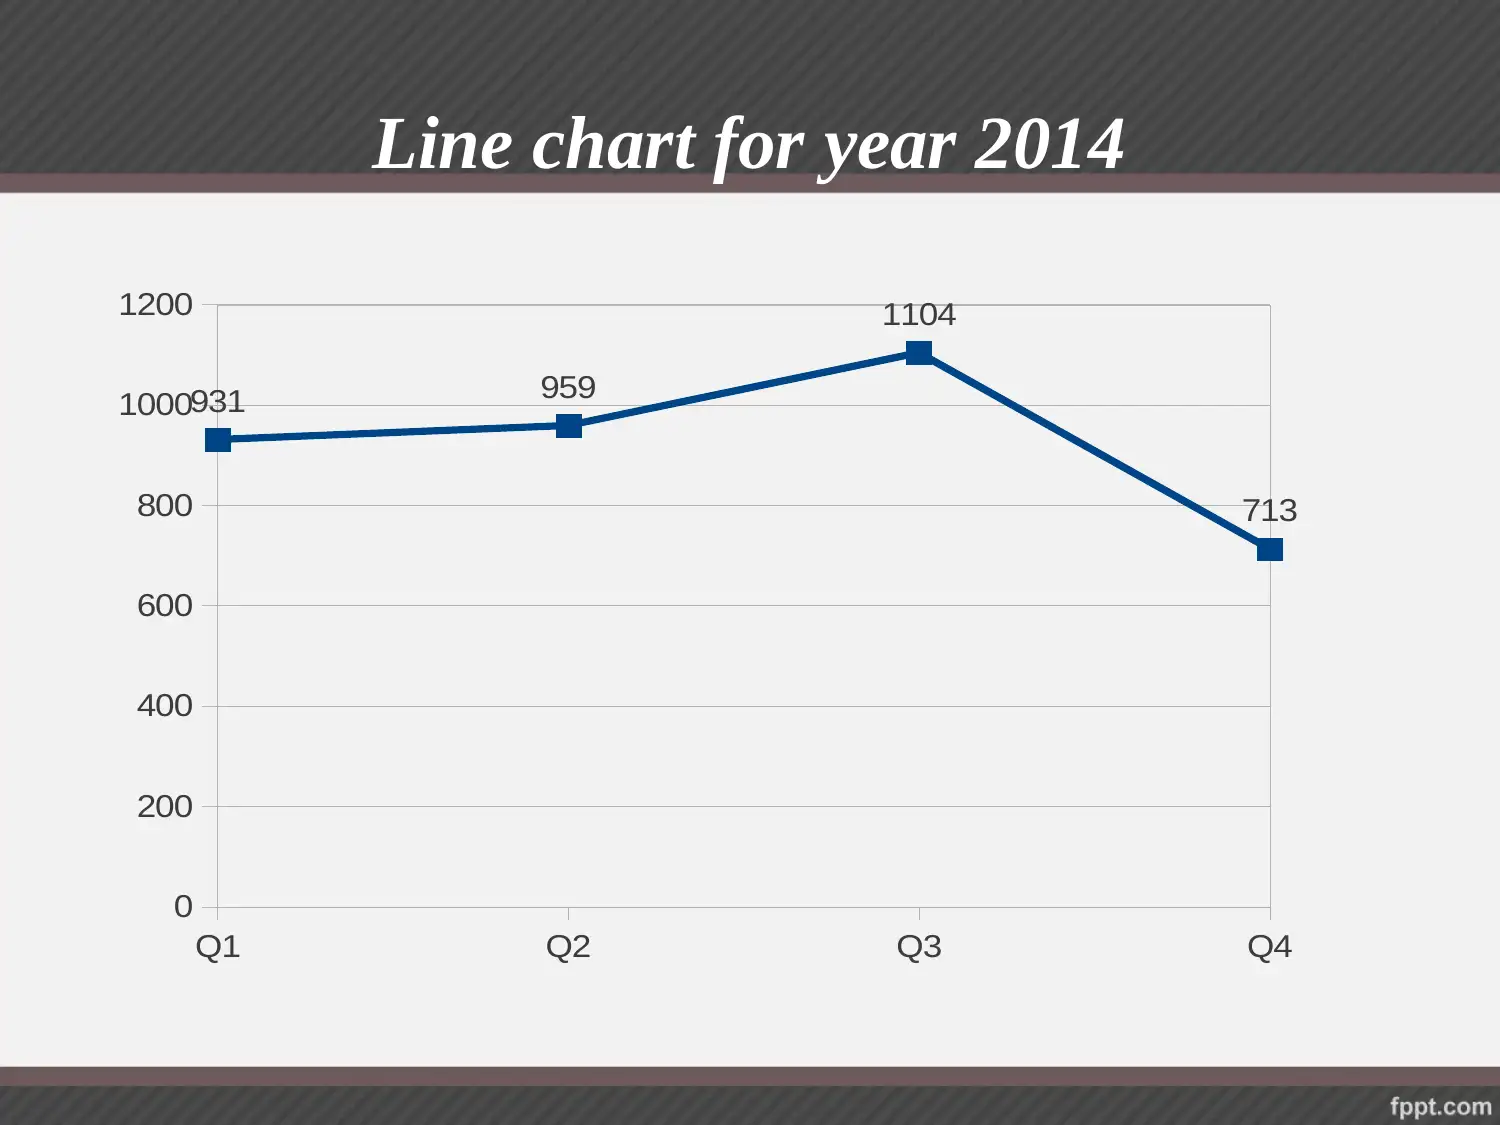
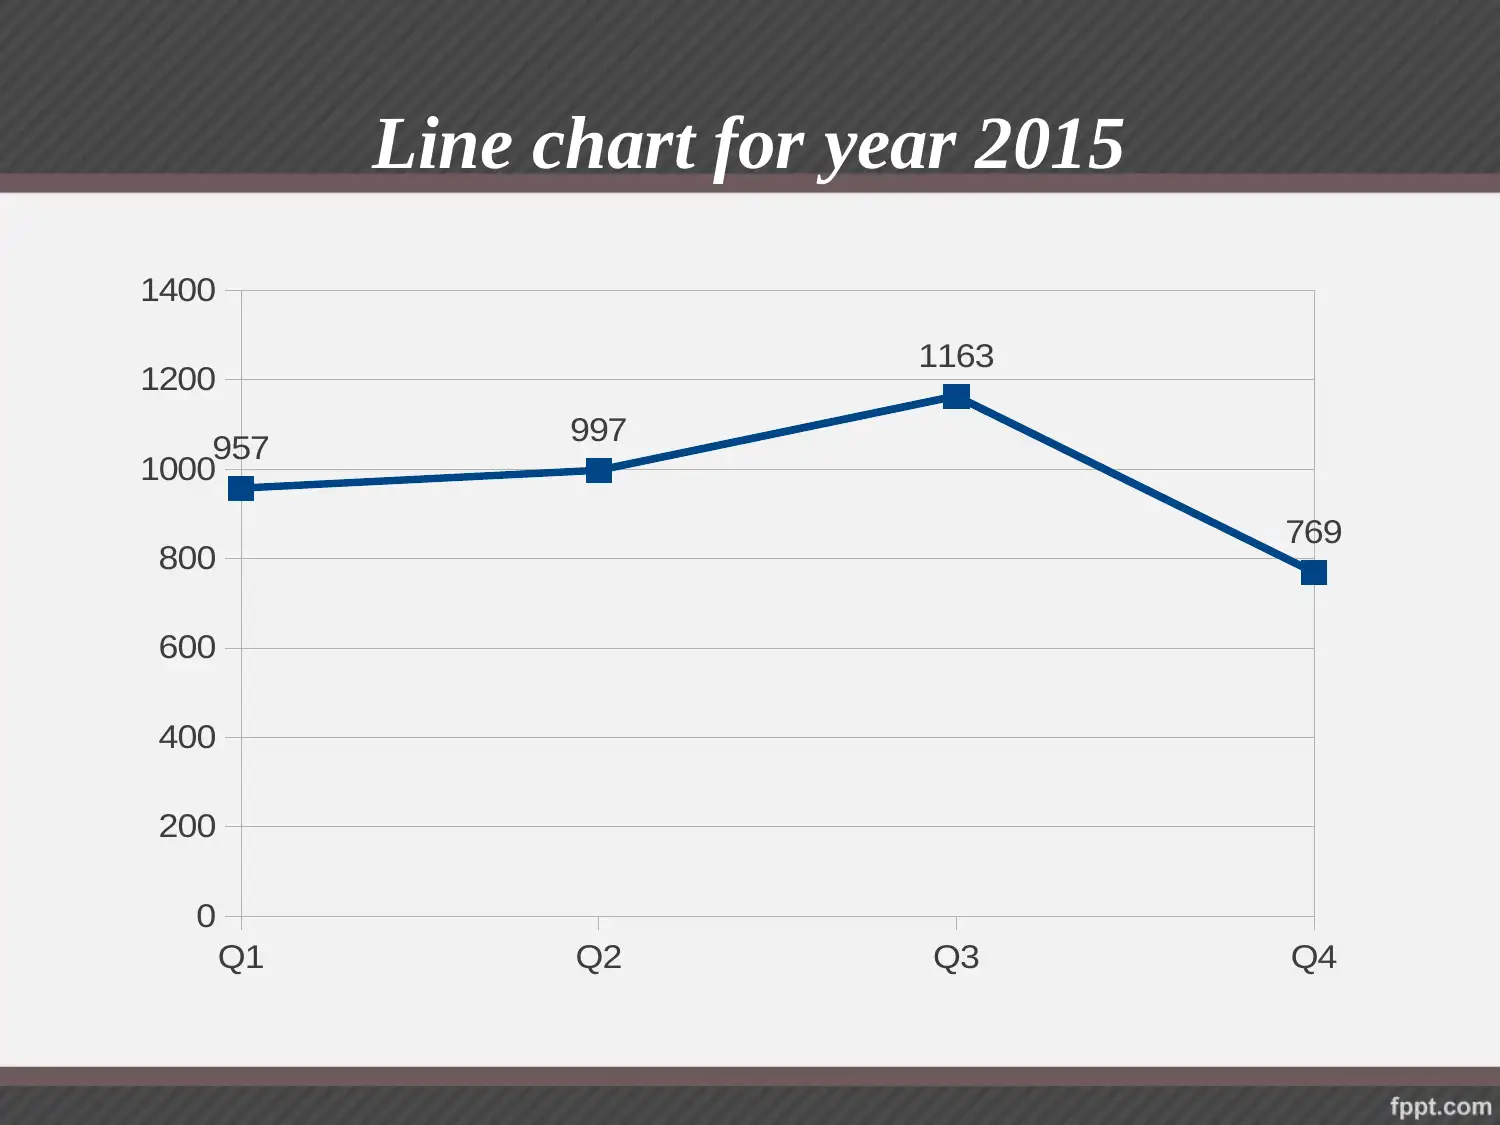
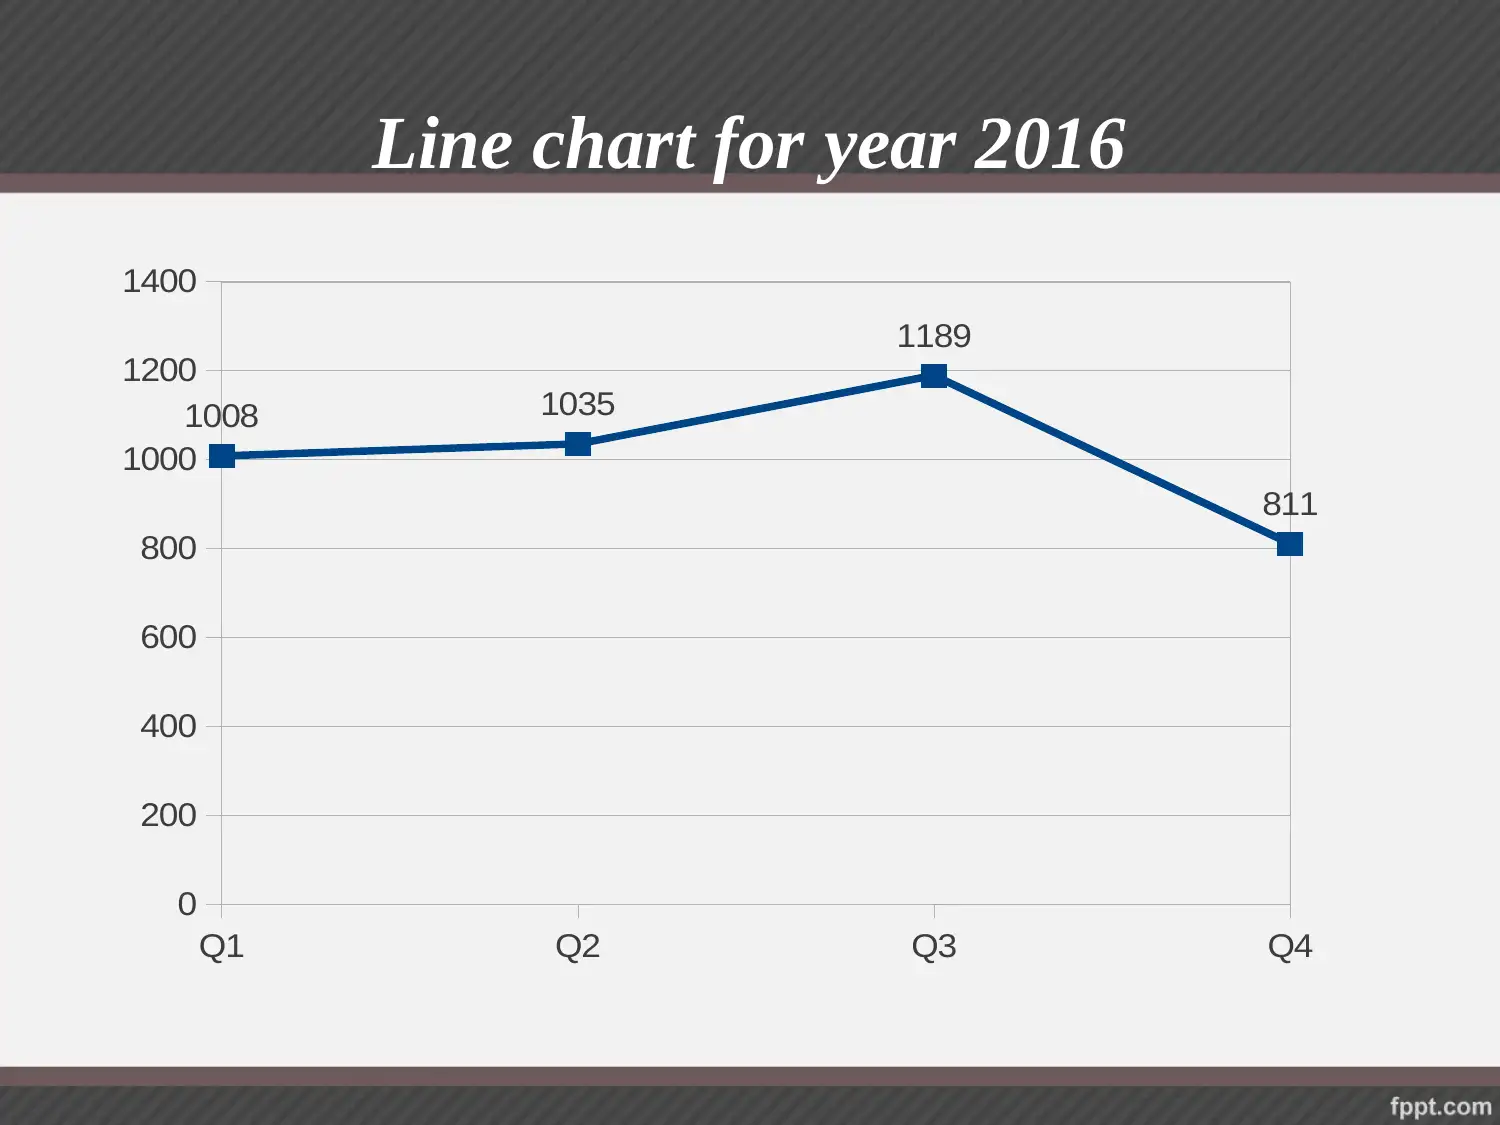
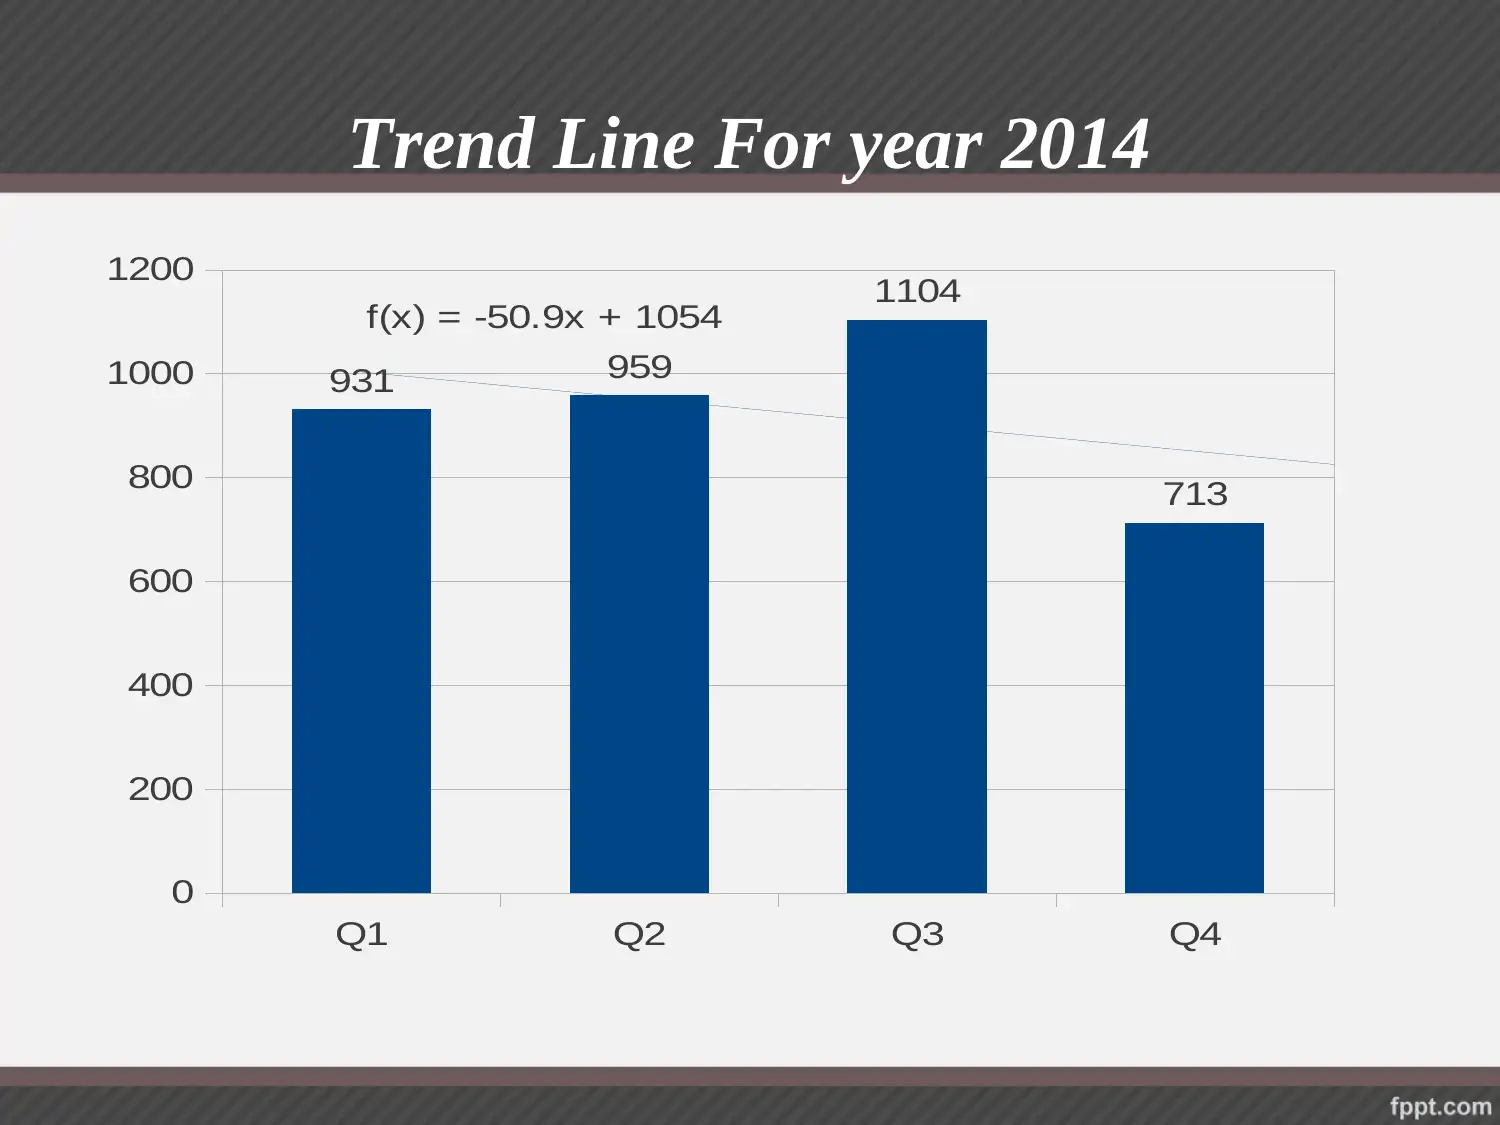
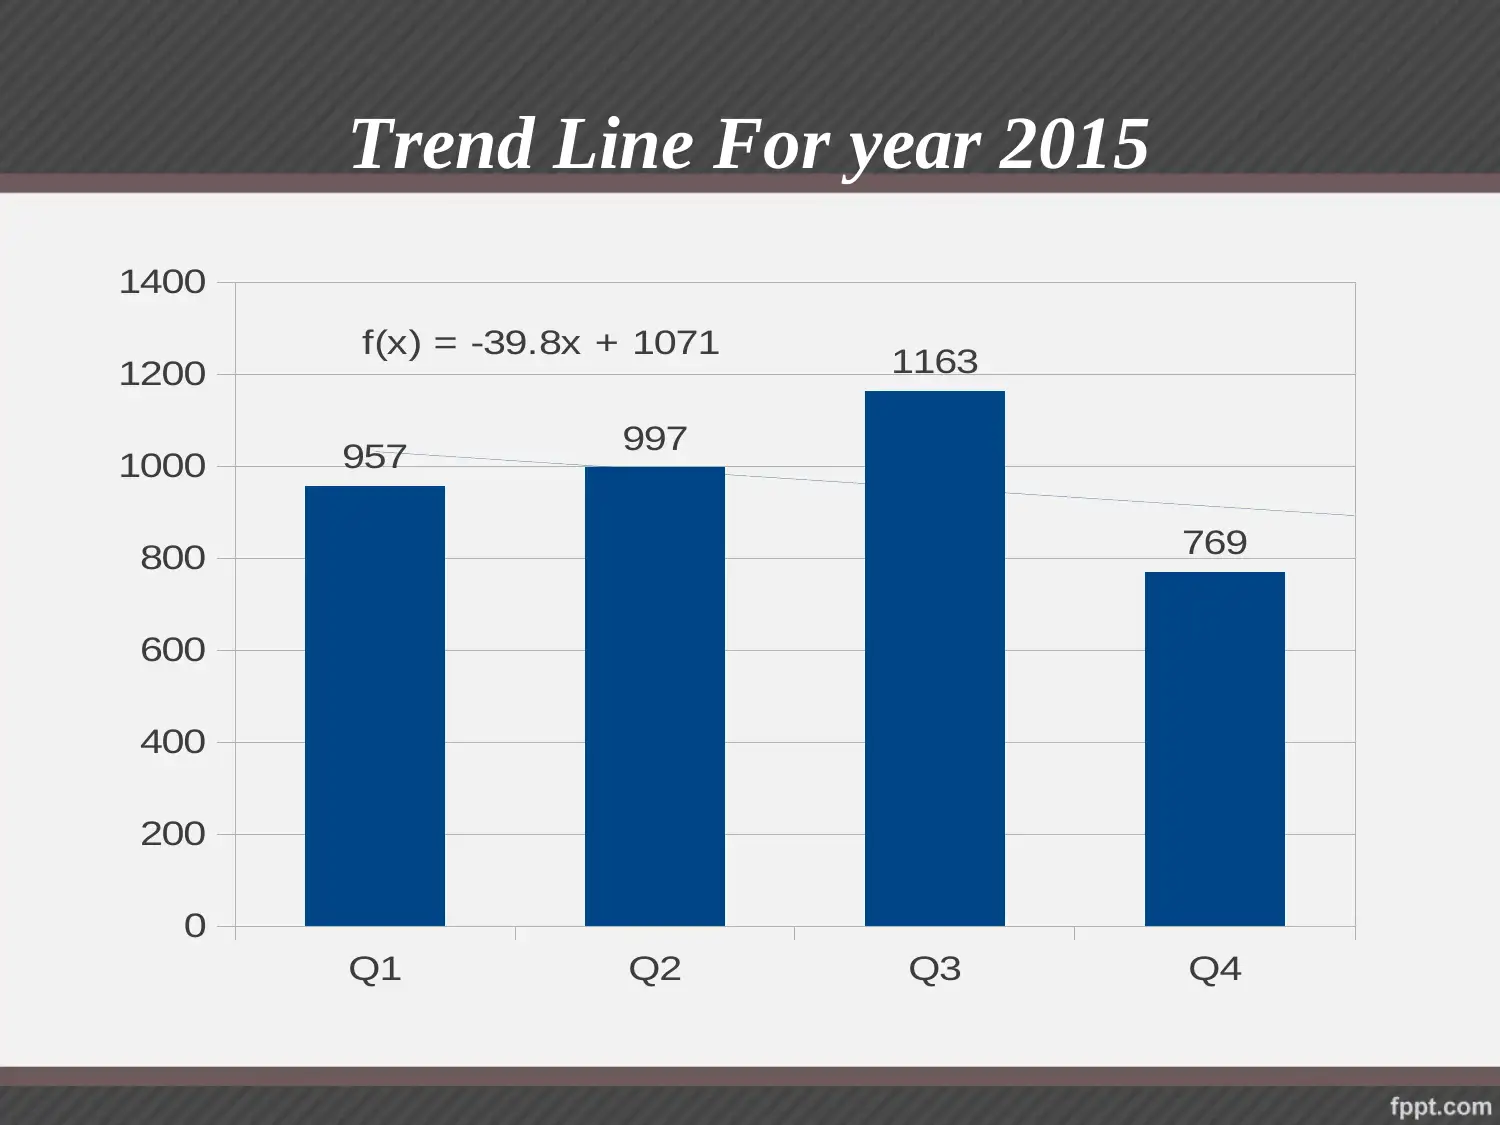
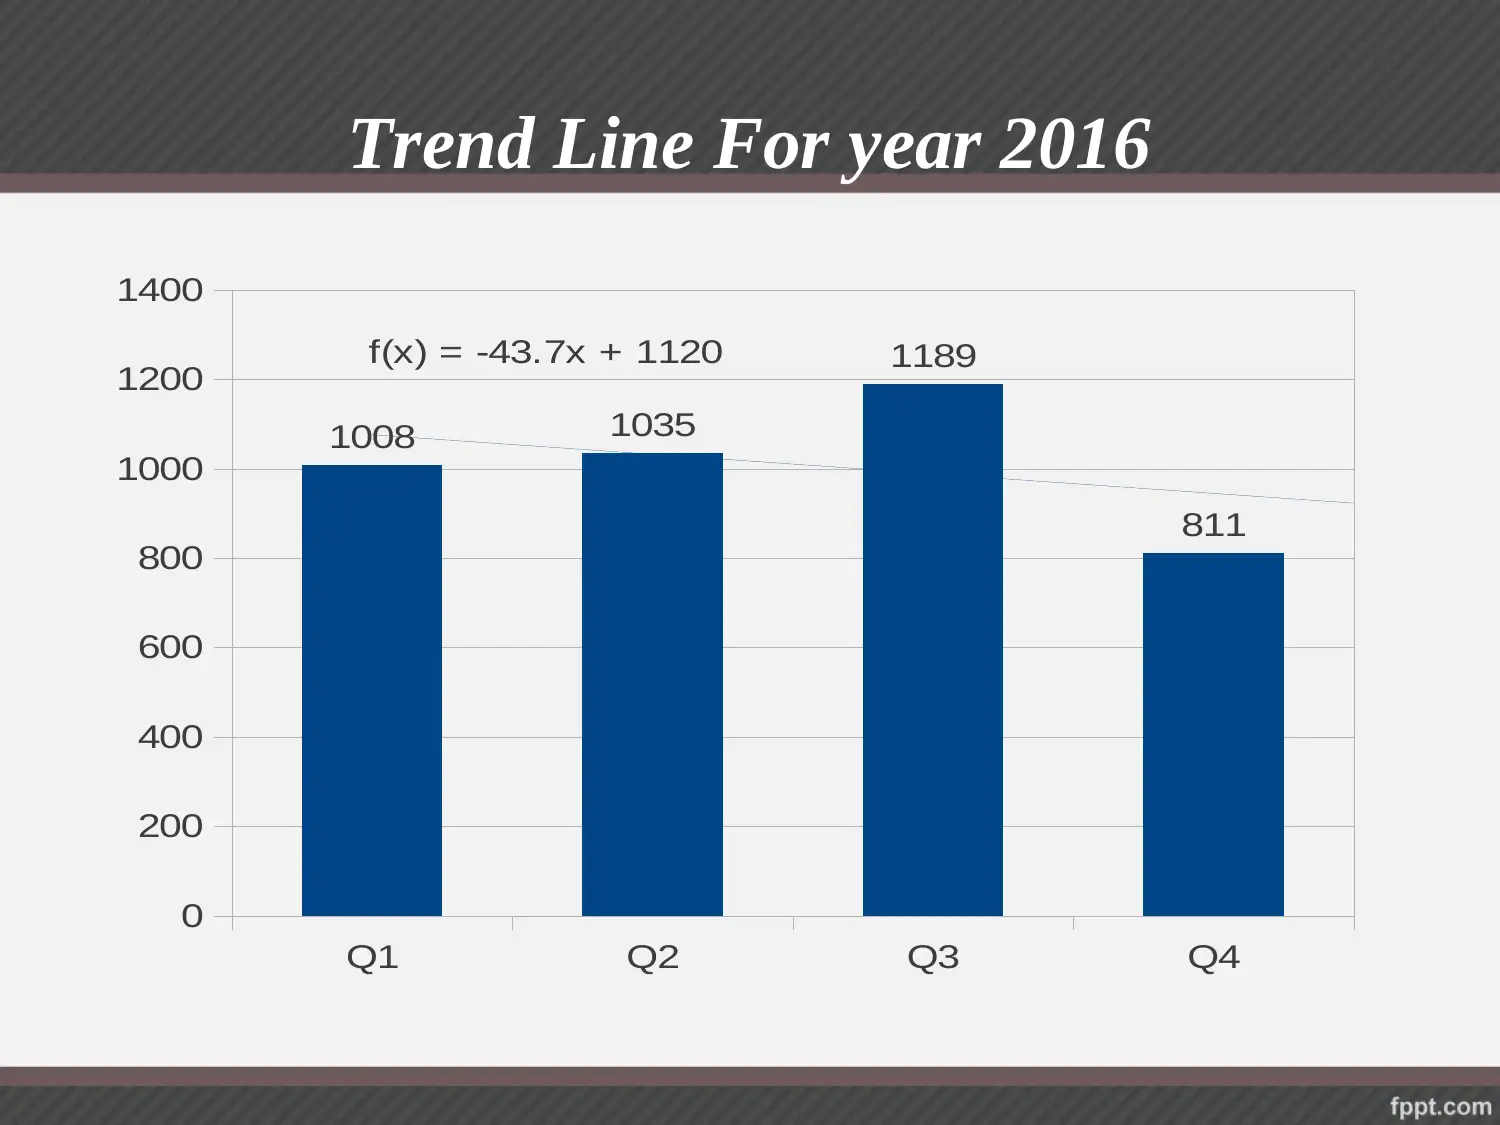
This presentation focuses on business decision making and includes various charts and trend lines for the years 2014, 2015, and 2016. It highlights the importance of pie charts, bar charts, line charts, and trend lines in presenting data and analyzing business performance. The interpretation of the charts shows an upward trend in business performance over the years.
tabler-icon-diamond-filled.svg

Contribute Materials

Your contribution can guide someone’s learning journey. Share your documents today.
Document Page
BUSINESS DECISION
MAKING
TASK 3.3
tabler-icon-diamond-filled.svg

Secure Best Marks with AI Grader

Need help grading? Try our AI Grader for instant feedback on your assignments.
Document Page
Pie Chart For Year 2014
931
959
1104
713
Q1
Q2
Q3
Q4
Document Page
Pie Chart For Year 2015
Q1
Q2
Q3
Q4
957
997
1163
769
Document Page
Pie Chart For Year 2016
Q1
Q2
Q3
Q4
1008
1035
1189
811
tabler-icon-diamond-filled.svg

Secure Best Marks with AI Grader

Need help grading? Try our AI Grader for instant feedback on your assignments.
Document Page
INTERPRETATION
Pie chart is one of the important method of presentation of
data that shows all the tour packages currently offered by an
entity in order to gain higher trust and loyalty among variety
of customers in the external market.
Document Page
Bar chart for year 2014
Q1
Q2
Q3
Q4
0 200 400 600 800 1000 1200
931
959
1104
713
Document Page
Bar chart for year 2015
Q1
Q2
Q3
Q4
0 200 400 600 800 1000 1200 1400
957
997
1163
769
tabler-icon-diamond-filled.svg

Paraphrase This Document

Need a fresh take? Get an instant paraphrase of this document with our AI Paraphraser
Document Page
Bar chart for year 2016
Q1
Q2
Q3
Q4
0 200 400 600 800 1000 1200 1400
1008
1035
1189
811
Document Page
INTERPRETATION
Bar chart is the horizontal presentation of data which shows
the relationship among various parameters and the overall
entity's performance in the best possible manner.
It shows that the performance of the business is increasing
with the passage of time.
Document Page
Line chart for year 2014
Q1 Q2 Q3 Q4
0
200
400
600
800
1000
1200
931 959
1104
713
tabler-icon-diamond-filled.svg

Secure Best Marks with AI Grader

Need help grading? Try our AI Grader for instant feedback on your assignments.
Document Page
Line chart for year 2015
Q1 Q2 Q3 Q4
0
200
400
600
800
1000
1200
1400
957 997
1163
769
Document Page
Line chart for year 2016
Q1 Q2 Q3 Q4
0
200
400
600
800
1000
1200
1400
1008 1035
1189
811
Document Page
INTERPRETATION
Line chart is one of the important tools of presentation which
helps in reflecting higher business performance to determine
the growth of an entity to design all the products or services
currently offered by an entity to its variety of customers in
the external business environment.
The above line chart shows the higher performance of an
entity by showing upward trend in three of the years such as
2014,2015 and 2016.
tabler-icon-diamond-filled.svg

Paraphrase This Document

Need a fresh take? Get an instant paraphrase of this document with our AI Paraphraser
Document Page
Trend Line For year 2014
Q1 Q2 Q3 Q4
0
200
400
600
800
1000
1200
931 959
1104
713
f(x) = -50.9x + 1054
Document Page
Trend Line For year 2015
Q1 Q2 Q3 Q4
0
200
400
600
800
1000
1200
1400
957 997
1163
769
f(x) = -39.8x + 1071
Document Page
Trend Line For year 2016
Q1 Q2 Q3 Q4
0
200
400
600
800
1000
1200
1400
1008 1035
1189
811
f(x) = -43.7x + 1120
tabler-icon-diamond-filled.svg

Secure Best Marks with AI Grader

Need help grading? Try our AI Grader for instant feedback on your assignments.
Document Page
INTERPRETATION
Trend line is an important approach used by an entity in
order to predict the future performance of the business by the
current performance of an entity in order to generate higher
outcomes in the near future.
The trend line of all the products states that in year
2014,2015 and 2016 the value of the business is increasing
over the years
Document Page
REFERENCES
Brooks, J. P., Dula, J. H. and Boone, E. L., 2013. A pure L1-
norm principal component analysis. Computational statistics
& data analysis. 61. pp.83-98.
Beltrame, F., Cappelletto, R. and Toniolo, G., 2014. Estimating
SMEs Cost of Equity Using a Value at Risk Approach: The
Capital at Risk Model. Springer.
Baum, A. E. and Crosby, N., 2014. Property investment
appraisal. John Wiley & Sons.
Document Page
THANK YOU
chevron_up_icon
1 out of 19
circle_padding
hide_on_mobile
zoom_out_icon
[object Object]

Your All-in-One AI-Powered Toolkit for Academic Success.

Available 24*7 on WhatsApp / Email

[object Object]