Biology Lab Report: Succinate Dehydrogenase Activity in Cauliflower
VerifiedAdded on 2020/05/28
|10
|1615
|115
Report
AI Summary
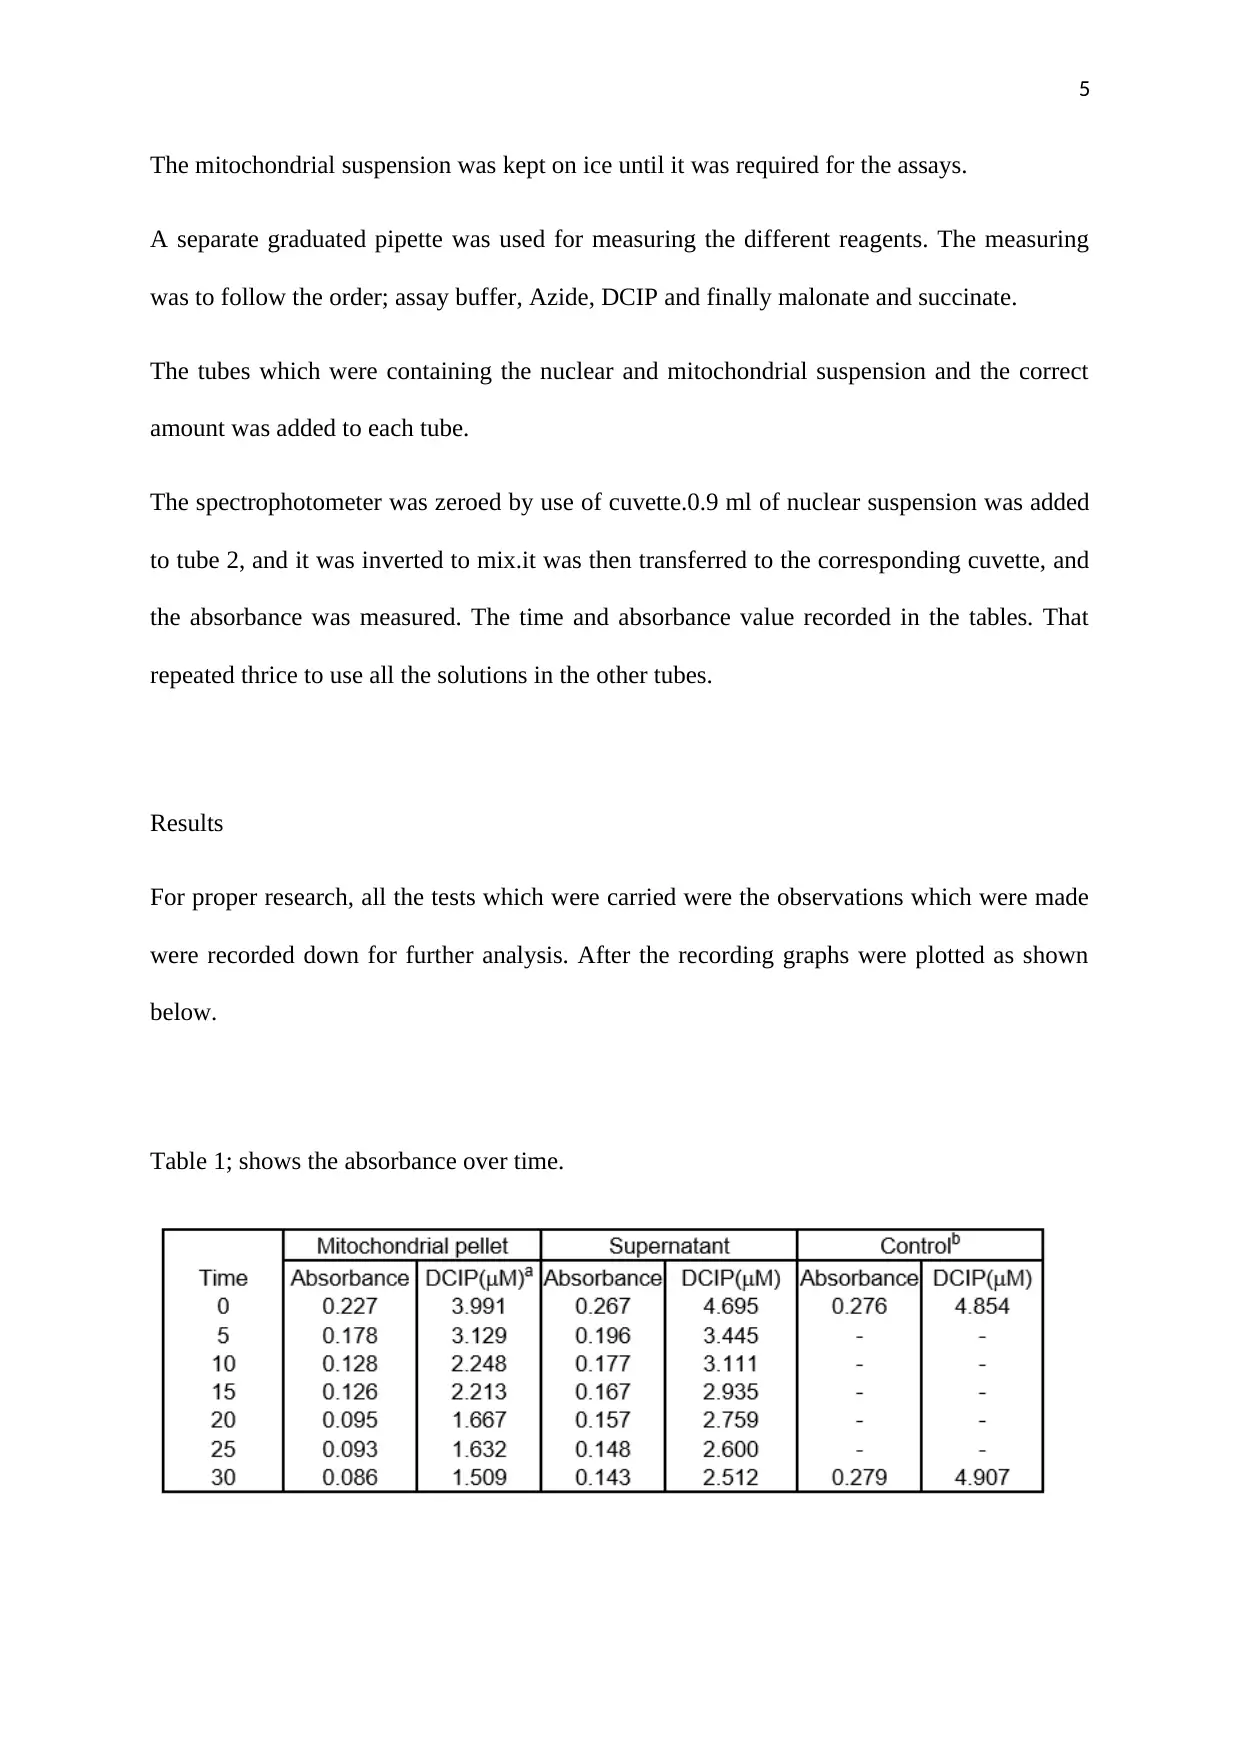
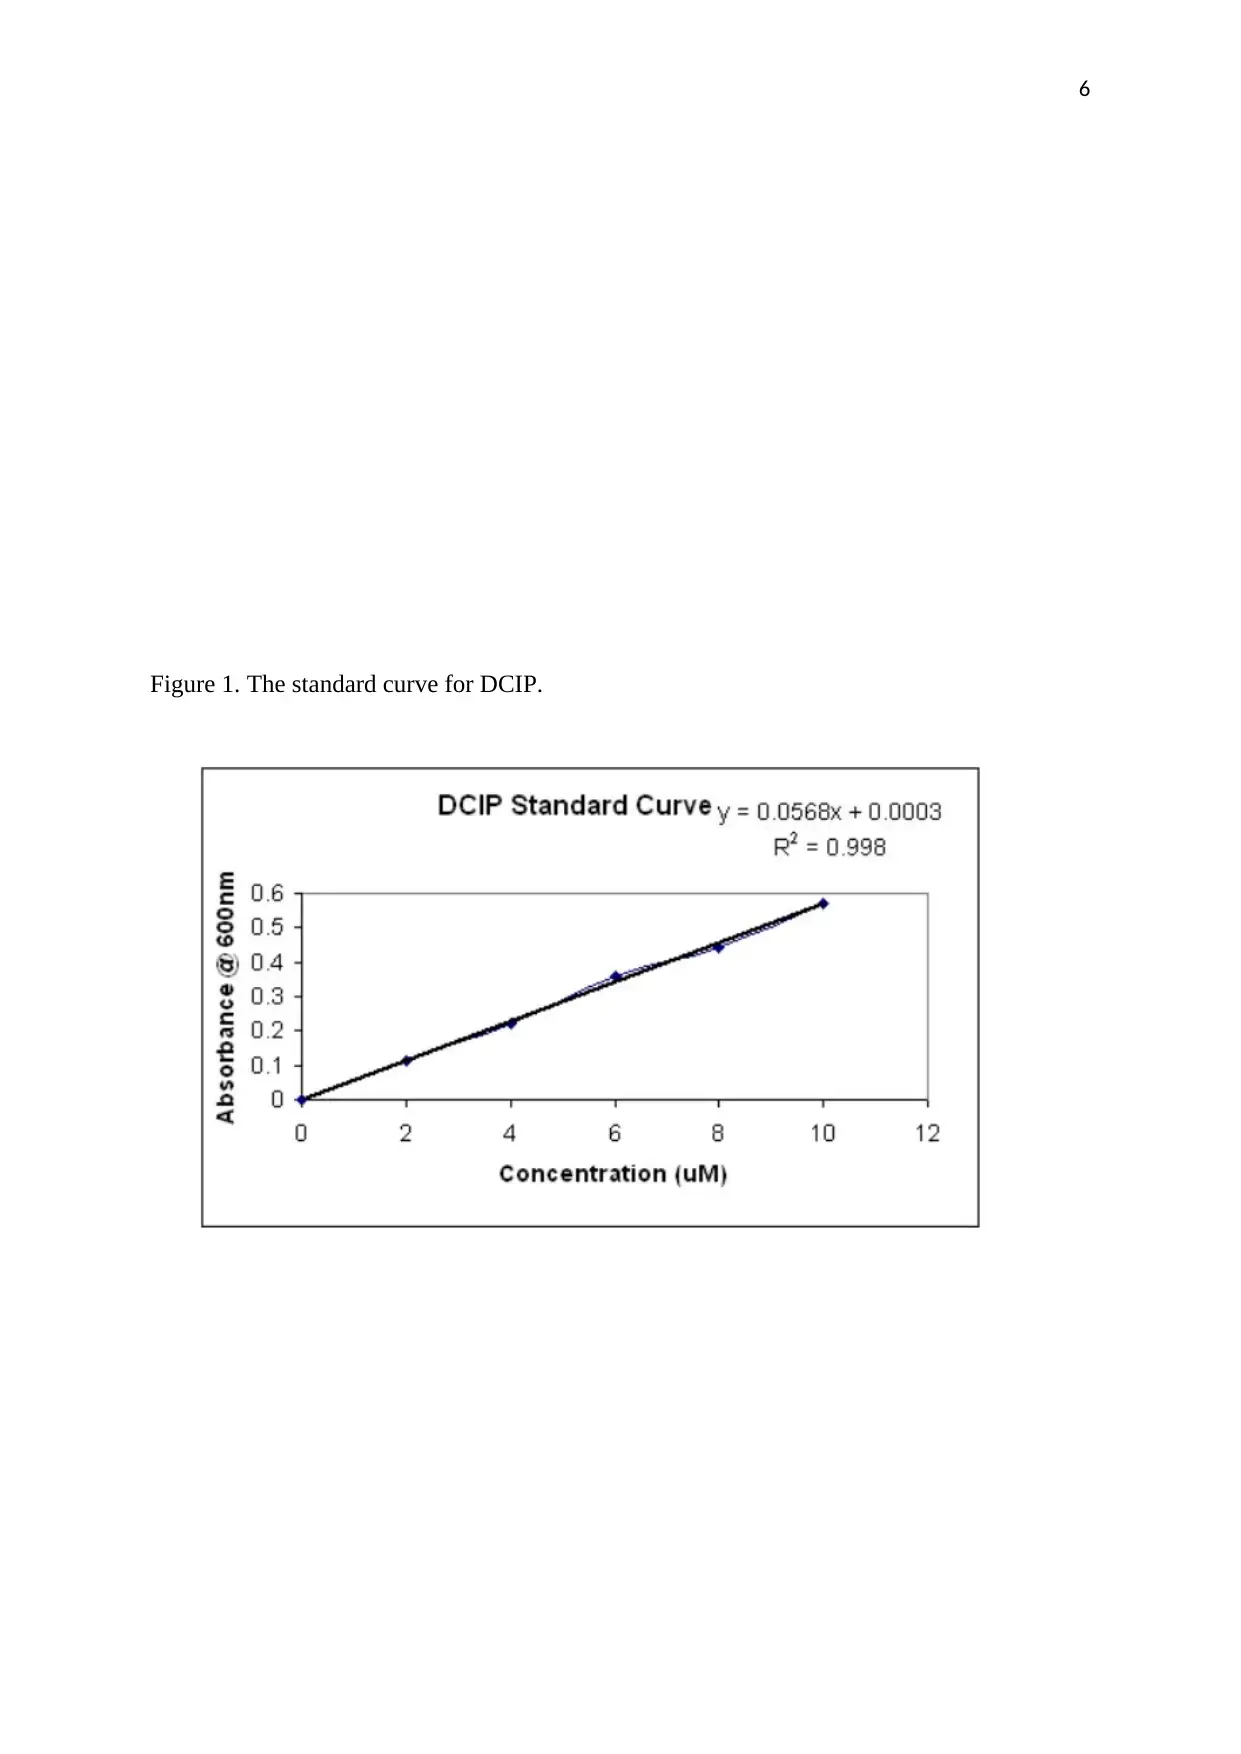
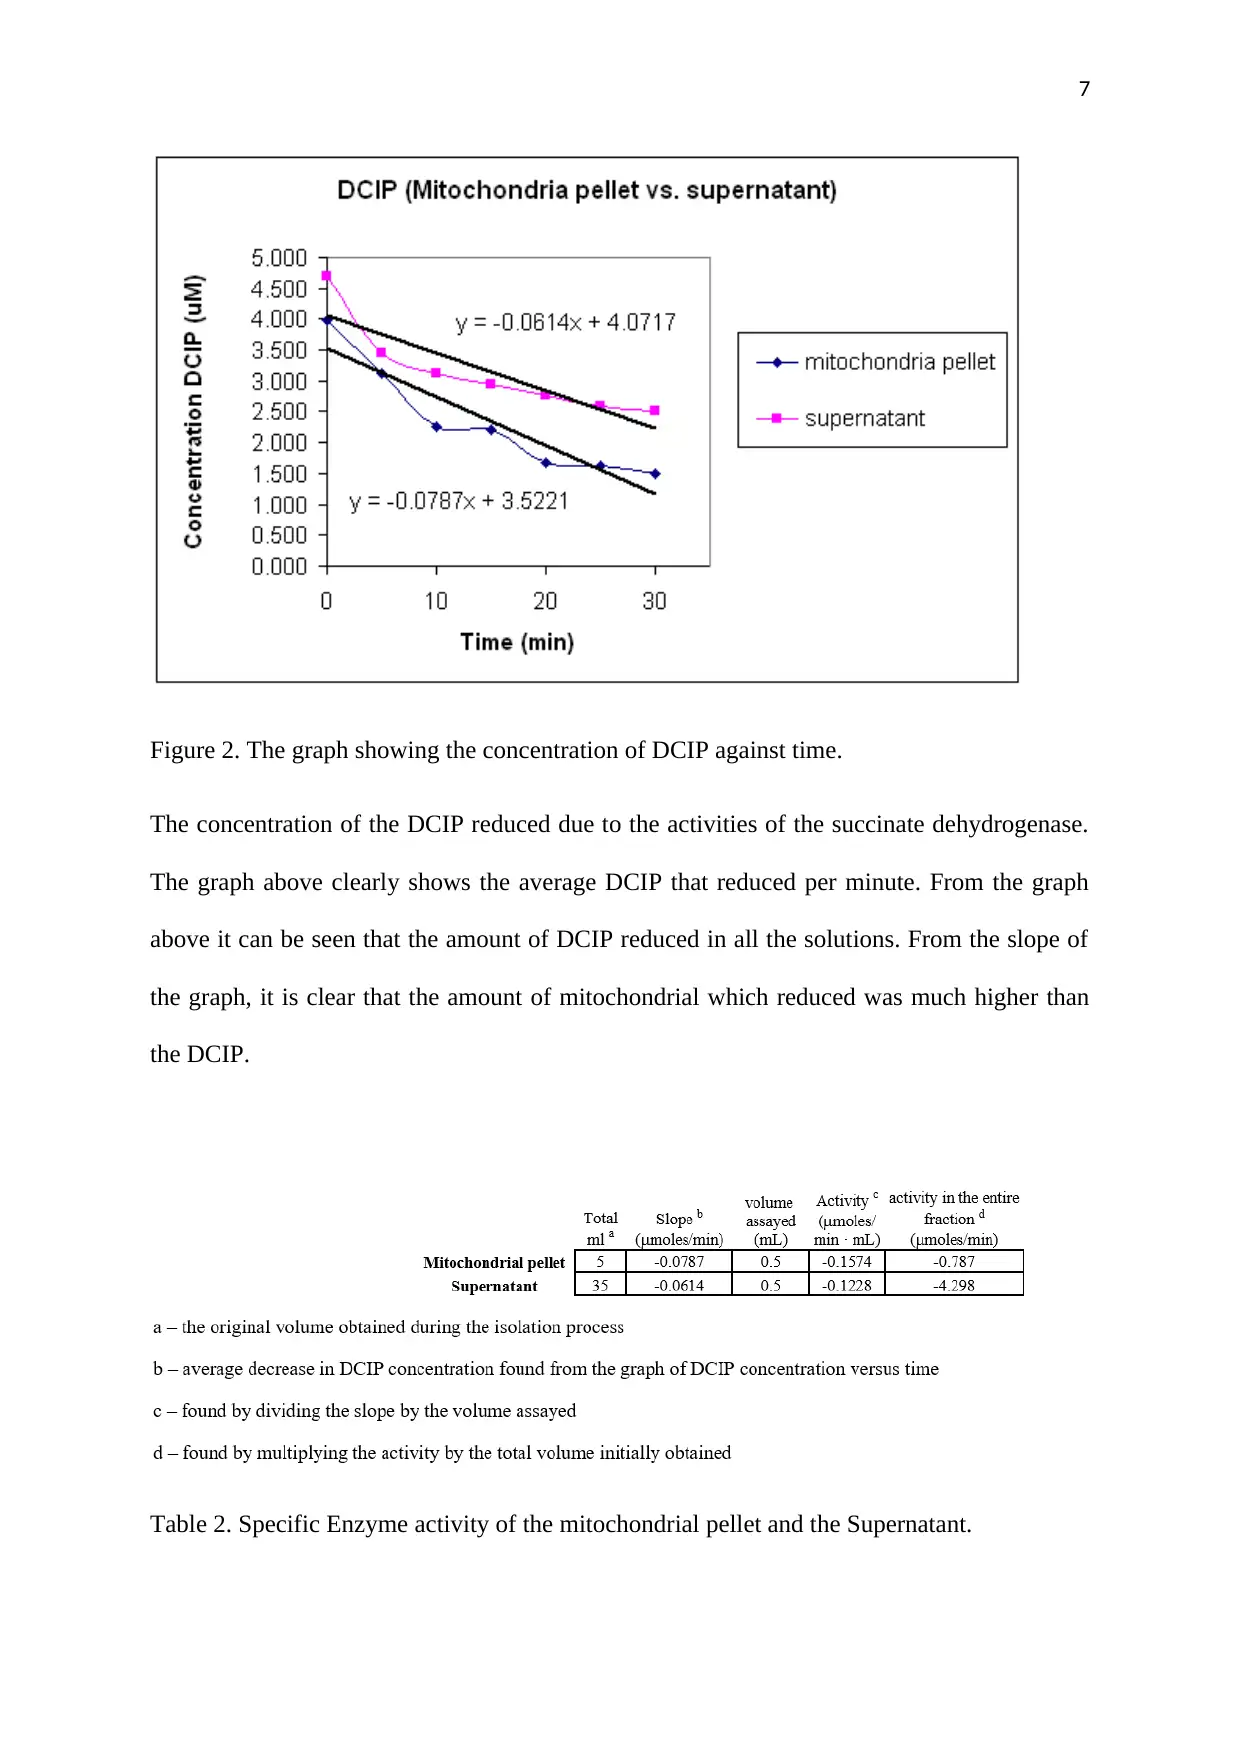
This report details a biology laboratory experiment investigating succinate dehydrogenase (SDH) activity in cauliflower. The study aimed to isolate mitochondria, measure SDH activity, assess the viability of the electron transport system, and explore the effects of competitive inhibitors. The experiment involved isolating mitochondria from cauliflower, using a grinding buffer and centrifugation techniques. SDH activity was measured using dichlorophenolindophenol (DCIP) as an artificial electron acceptor, with absorbance readings taken over time to determine the rate of DCIP reduction. The results, presented in tables and graphs, showed the rate of DCIP reduction. The discussion concludes that the concentration of DCIP was reduced, indicating the presence of SDH and functional mitochondrial tissue. The enzyme activities were calculated from graphs. References to relevant literature are included.

1
BIOSCIENCE
By Name
Course
Instructor
Institution
Location
Date
BIOSCIENCE
By Name
Course
Instructor
Institution
Location
Date
Paraphrase This Document
Need a fresh take? Get an instant paraphrase of this document with our AI Paraphraser

2
Electron transport and enzyme kinetics: succinate dehydrogenase activity in cauliflower
Introduction.
Studies have shown that in the eukaryotic organisms, there is cellular respiration process,
which takes place in the mitochondria. During that process, amino acids, carbohydrates and
fatty acids are all broken down to produce water and carbon dioxide. The energy released
during this reaction is either released as heat, transferred to molecules like the adenosine
triphosphate (ATP) or is used in the reduction of molecules such nicotinamide dinucleotide
(NAD+) and the molecule Flavin adenine dinucleotide ( FAD) (Abelson, 2016, p. 345).
Some of the mentioned reactions occur in the Krebs cycle, because of electronic transport
chain and the rest occurs in the pathway of biochemical, which feeds intermediates into the
Krebs cycle. The succinate dehydrogenase (SDH) is usually located in the innermost of the
mitochondrial membrane and most cases; it is the enzyme involved in this reaction of
catalysing redox reactions, which passes two electrons from the succinate to the Flavin
adenine dinucleotide and the FADH at the same time forming fumarate from succinate
(Bhagavan, 2012, p. 67).
Both the NADH and FADH have the capability of feeding electrons into many redox
reactions in the innermost of the mitochondrial membrane, mediated by the electron transport
chain. At the finishing point of the molecular transport chain (Cornish-Bowden, 2012, p.
345). The electrons in most cases are feed into oxygen molecules, which are combined and
reduced with two protons to produce water. In the case where the typical path of the electron
transport is blocked by uncouples elements such as the potassium cyanide or Azide, or if
oxygen molecules are removed (Brezonik, 2013, p. 432).
Artificial electron acceptors such as dichlopenolindophenol or the methylene blue applied to
indicate the activities of the electron transport. That can be attributed to their oxidised state

3
they are blue, but in the reduced state, they are colourless. This study uses this impact to
determine SDH activity in the cauliflower curds mitochondrial (Campbell, 2013, p. 345).
Aim/Objectives of the experiment
The objectives of this experiment to be carried out was to; Carry out mitochondrial isolation,
measure succinate dehydrogenase activity, examine the viability of the electron transport
system and finding out the effects which the competitive inhibitors have on the rate of
reaction.
Experiment section
Materials and equipment.
The materials used, equipment and chemicals for the practical included;
Pestle and mortar, sharp sand, spatula, scalpel or razor blade, fresh cauliflower, ignition
tubes, spectrophotometer, cuvettes, cooled ultracentrifuge, pipettes, groves, pasture pipettes,
paraffin, ice, scissors, cuvette stands and ignition tube racks.
For the reagents, the following were used; Grinding buffer (0.3 M mannitol, 0.006 M
KP2PO4, 0.014 MKHPO4 –PH 7.2) assay buffer, 0.04 M Azide, dichlorophenolindophenol
and different concentrations of sodium succinate (0.2, 0.02, 0.002 and 0.0002)
Procedure/method
The groups divided themselves into two to carry out the following procedures.
Isolation of the mitochondria
A cauliflower was taken and 25 grams of the outer surface removed.
⊘ This is a preview!⊘
Do you want full access?
Subscribe today to unlock all pages.

Trusted by 1+ million students worldwide

4
The tissue was placed in the chilled mortar, 50ml of the ice-cold grinding buffer was
measured and 5 grams of cooled sand then they were ground vigorously for two minutes
using the pestle (Matthews, 2011, p. 34).
The materials filtered through four layers of the cheesecloth and poured into a chilled
centrifuge tube. The tube was labelled ‘' nuclear fraction.''
Another clean chilled centrifuge tube was labelled ‘mitochondria fraction'', and the post
nuclear supernatant was carefully decanted into it.Its lot of care was needed to ensure that the
nuclear fraction is not re-suspended when pouring out the supernatant (Sybesma, 2016, p.
341).
The supernatant was centrifuged at 8820rpm for 30 minutes under temperatures of 0-40c.
Meanwhile, 10.0 ml of cold grinding buffers were added to the tube which was containing the
nuclear pellet, and it was resuspended by the use of glass string rod or a spatula, and then it
was agitated by use of a clean Pasteur pipette. The tube was kept on ice until it was required
for the assay (Davison, 2015, p. 128).
After the second tube having centrifuged for the required time, the mitochondrial fraction was
sedimented out and observed as a pellet at the bottom of the tube.
The post mitochondria supernatant was carefully poured off into a sink, and then 10.0 ml of
ice-cold grinding buffer was added to the tube, which was containing the mitochondrial
pallet.
The mitochondrial carefully resuspended into the buffer by scraping the pallet of the side of
the tube by use of a clean spatula. The by using a clean Pasteur pipette the suspension was
agitated. It was very important to ensure that all the pallet was completely dispersed ad that
there were no lumps that were seen floating in the liquid (Purich, 2013, p. 89).
Paraphrase This Document
Need a fresh take? Get an instant paraphrase of this document with our AI Paraphraser

5
The mitochondrial suspension was kept on ice until it was required for the assays.
A separate graduated pipette was used for measuring the different reagents. The measuring
was to follow the order; assay buffer, Azide, DCIP and finally malonate and succinate.
The tubes which were containing the nuclear and mitochondrial suspension and the correct
amount was added to each tube.
The spectrophotometer was zeroed by use of cuvette.0.9 ml of nuclear suspension was added
to tube 2, and it was inverted to mix.it was then transferred to the corresponding cuvette, and
the absorbance was measured. The time and absorbance value recorded in the tables. That
repeated thrice to use all the solutions in the other tubes.
Results
For proper research, all the tests which were carried were the observations which were made
were recorded down for further analysis. After the recording graphs were plotted as shown
below.
Table 1; shows the absorbance over time.

6
Figure 1. The standard curve for DCIP.
⊘ This is a preview!⊘
Do you want full access?
Subscribe today to unlock all pages.

Trusted by 1+ million students worldwide

7
Figure 2. The graph showing the concentration of DCIP against time.
The concentration of the DCIP reduced due to the activities of the succinate dehydrogenase.
The graph above clearly shows the average DCIP that reduced per minute. From the graph
above it can be seen that the amount of DCIP reduced in all the solutions. From the slope of
the graph, it is clear that the amount of mitochondrial which reduced was much higher than
the DCIP.
Table 2. Specific Enzyme activity of the mitochondrial pellet and the Supernatant.
Paraphrase This Document
Need a fresh take? Get an instant paraphrase of this document with our AI Paraphraser

8
Discussion & Conclusions
In conclusion, the concentration of DCIP greatly reduced as other solutions were added to it,
the results which were obtained from the mitochondrial tissue isolation were totally different
our expectations, from the observations which it was clear that both the mitochondrial pellet
and supernatant reduced at almost the same rate (Cornish-Bowden, 2012, p. 34). The
concentration of the DCIP greatly reduced due to the solutions which were added to it; there
must have been a succinate dehydrogenase, and therefore mitochondrial tissue (Cornish-
Bowden, 2012, p. 123).
The enzyme activities in all solutions were calculated from the graphs. By dividing the
volume assayed and sloped it was much easier to determine the number of the enzyme
activities which were present in the solutions which ware assayed. (Laisk, 2013, p. 567).

9
References
Abelson, J. N., 2016. Enzyme Kinetics and Mechanisms, Part E, Energetics of Enzyme
Catalysis. 2nd ed. London: Elsevier.
Bhagavan, N. V., 2012. Medical Biochemistry. 3rd ed. Berlin: Academic Press.
Brezonik, P. L., 2013. Chemical Kinetics and Process Dynamics in Aquatic Systems. 2nd ed.
Paris: CRC Press.
Campbell, C., 2013. The China Study: The Most Comprehensive Study of Nutrition Ever
Conducted And the Startling Implications for Diet, Weight Loss, And Long-term Health. 4th
ed. London: BenBella Books.
Cornish-Bowden, A., 2012. Fundamentals of Enzyme Kinetics. 3rd ed. London: Elsevier.
Davison, A., 2015. Biochemistry & Metabolism. 4th ed. London: JP Medical Ltd.
Laisk, A., 2013. Photosynthesis in silico: Understanding Complexity from Molecules to
Ecosystems. 1st ed. Texas: Springer Science & Business Media.
⊘ This is a preview!⊘
Do you want full access?
Subscribe today to unlock all pages.

Trusted by 1+ million students worldwide

10
Matthews, J. C., 2011. Fundamentals of Receptor, Enzyme, and Transport Kinetics. 2nd ed.
Chicago: CRC Press.
Purich, D. L., 2013. Enzyme Kinetics: Catalysis and Control: A Reference to Theory and
Best-Practice Methods. 1st ed. Chicago: Elsevier,
Sybesma, C., 2016. Advances in Photosynthesis Research: Proceedings of the VIth
International Congress on Photosynthesis, Brussels, Belgium. 2nd ed. Berlin: Springer.
1 out of 10
Your All-in-One AI-Powered Toolkit for Academic Success.
+13062052269
info@desklib.com
Available 24*7 on WhatsApp / Email
Unlock your academic potential
Copyright © 2020–2026 A2Z Services. All Rights Reserved. Developed and managed by ZUCOL.

