Analyzing REIT Performance and Risk
VerifiedAdded on 2020/02/24
|27
|6047
|52
AI Summary
This assignment tasks you with analyzing the performance of an A-REIT fund over a specific period. You'll calculate various financial metrics such as annual returns, tracking error, and information ratio to assess the fund's efficiency and risk. The provided data includes monthly returns for three different benchmarks: Equity Market, Bond Market, and Cash. By analyzing these metrics, you'll gain insights into the A-REIT fund's ability to generate returns while managing risk compared to other investment options.
Contribute Materials
Your contribution can guide someone’s learning journey. Share your
documents today.

Running head: PROPERTY
Property
Name of the Student:
Name of the University:
Author’s Note:
Property
Name of the Student:
Name of the University:
Author’s Note:
Secure Best Marks with AI Grader
Need help grading? Try our AI Grader for instant feedback on your assignments.
1PROPERTY
Table of Contents
Requirement 1:.................................................................................................................................2
Requirement 2:.................................................................................................................................3
Requirement 3:.................................................................................................................................3
Requirement 4:.................................................................................................................................6
Requirement 5:.................................................................................................................................7
Requirement 6:...............................................................................................................................10
Requirement 7:...............................................................................................................................10
Requirement 8:...............................................................................................................................11
Requirement 9:...............................................................................................................................11
Requirement 10:.............................................................................................................................12
Requirement 11:.............................................................................................................................14
Requirement 12:.............................................................................................................................15
Requirement 13:.............................................................................................................................15
Requirement 14:.............................................................................................................................17
Requirement 15:.............................................................................................................................19
Requirement 16:.............................................................................................................................20
Requirement 17:.............................................................................................................................22
Bibliography:.................................................................................................................................24
2PROPERTY
Requirement 1:
Jan-84
Jan-86
Jan-88
Jan-90
Jan-92
Jan-94
Jan-96
Jan-98
Jan-00
Jan-02
Jan-04
Jan-06
Jan-08
Jan-10
Jan-12
Jan-14
Jan-16
0
500
1000
1500
2000
2500
3000
Performance Trend
Shares Bonds
A-REITs Australian Composite Property
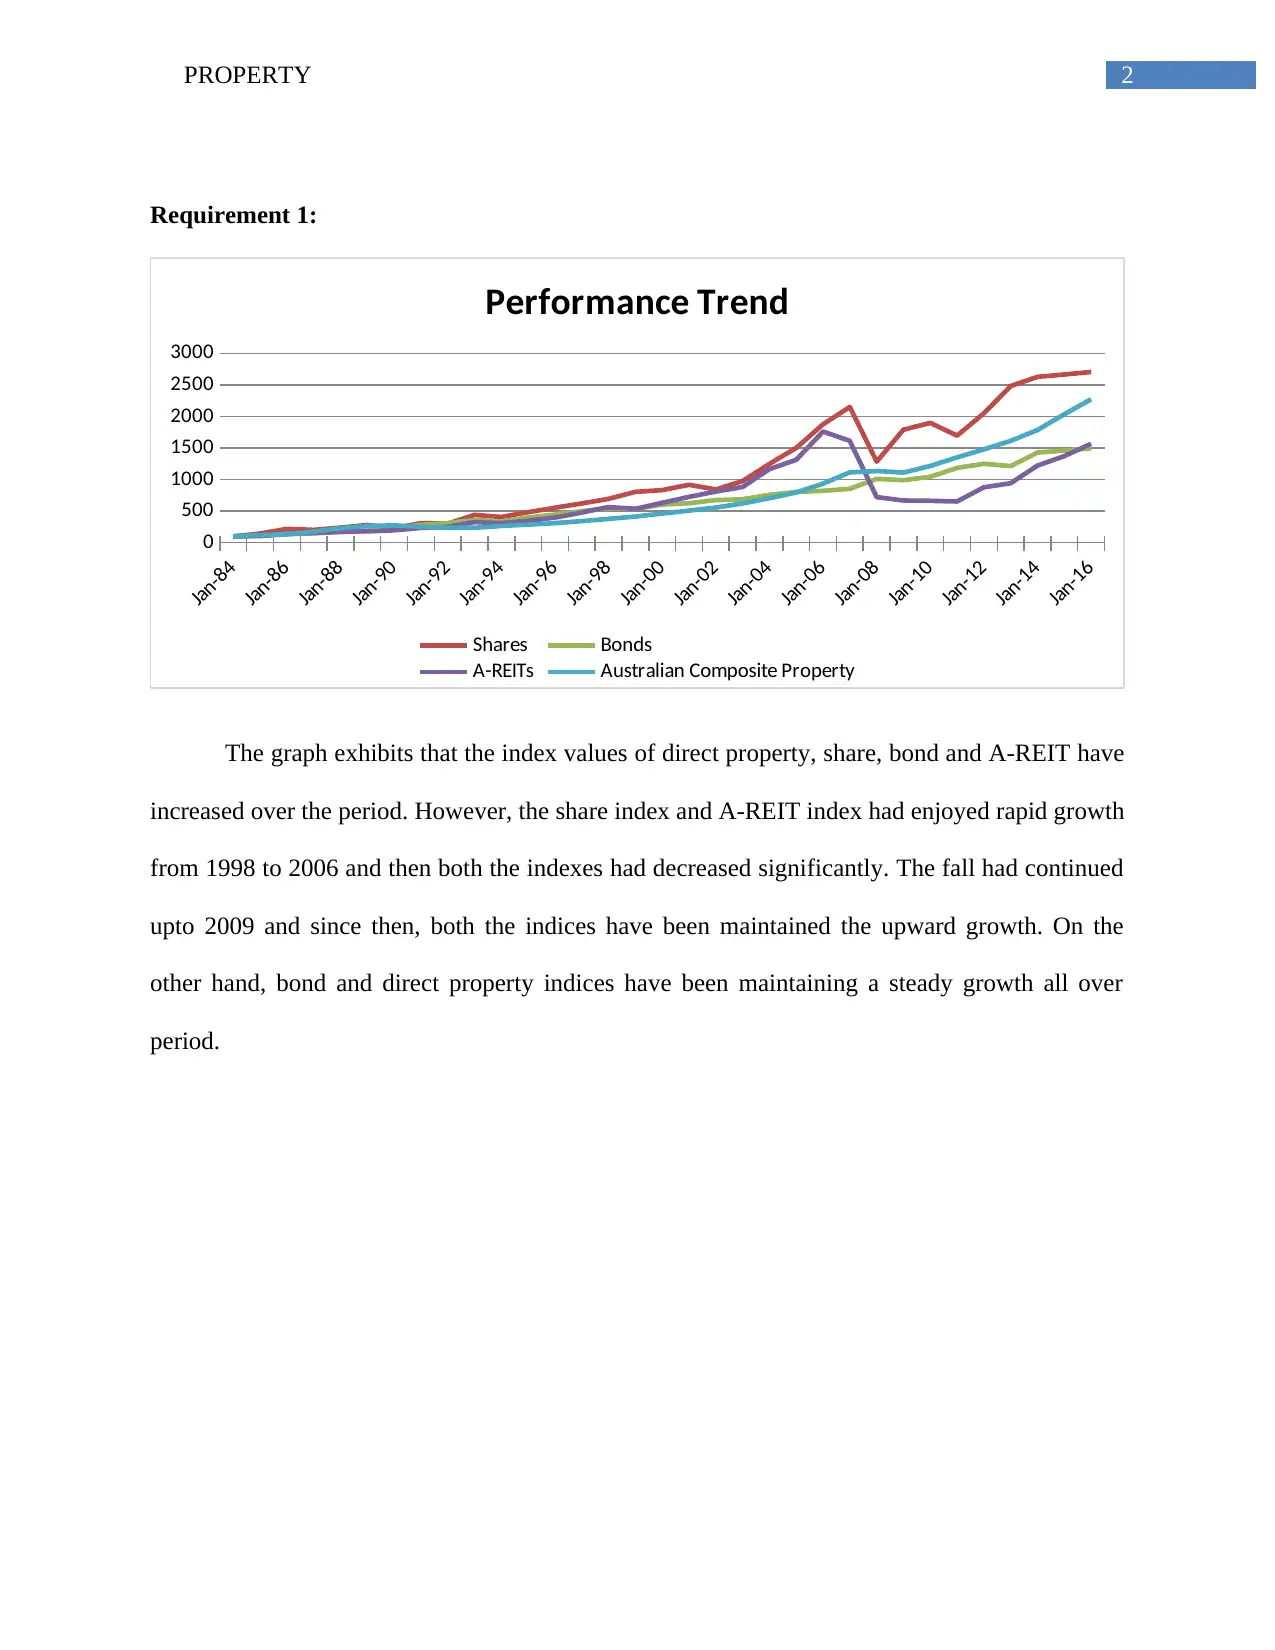
The graph exhibits that the index values of direct property, share, bond and A-REIT have
increased over the period. However, the share index and A-REIT index had enjoyed rapid growth
from 1998 to 2006 and then both the indexes had decreased significantly. The fall had continued
upto 2009 and since then, both the indices have been maintained the upward growth. On the
other hand, bond and direct property indices have been maintaining a steady growth all over
period.
Requirement 1:
Jan-84
Jan-86
Jan-88
Jan-90
Jan-92
Jan-94
Jan-96
Jan-98
Jan-00
Jan-02
Jan-04
Jan-06
Jan-08
Jan-10
Jan-12
Jan-14
Jan-16
0
500
1000
1500
2000
2500
3000
Performance Trend
Shares Bonds
A-REITs Australian Composite Property
The graph exhibits that the index values of direct property, share, bond and A-REIT have
increased over the period. However, the share index and A-REIT index had enjoyed rapid growth
from 1998 to 2006 and then both the indexes had decreased significantly. The fall had continued
upto 2009 and since then, both the indices have been maintained the upward growth. On the
other hand, bond and direct property indices have been maintaining a steady growth all over
period.
3PROPERTY
Requirement 2:
Jan-84
Jan-86
Jan-88
Jan-90
Jan-92
Jan-94
Jan-96
Jan-98
Jan-00
Jan-02
Jan-04
Jan-06
Jan-08
Jan-10
Jan-12
Jan-14
Jan-16
0
500
1000
1500
2000
2500
3000
3500
4000
4500
Performance Trend
Australian CBD Office
Australian Retail
Australian Industrial
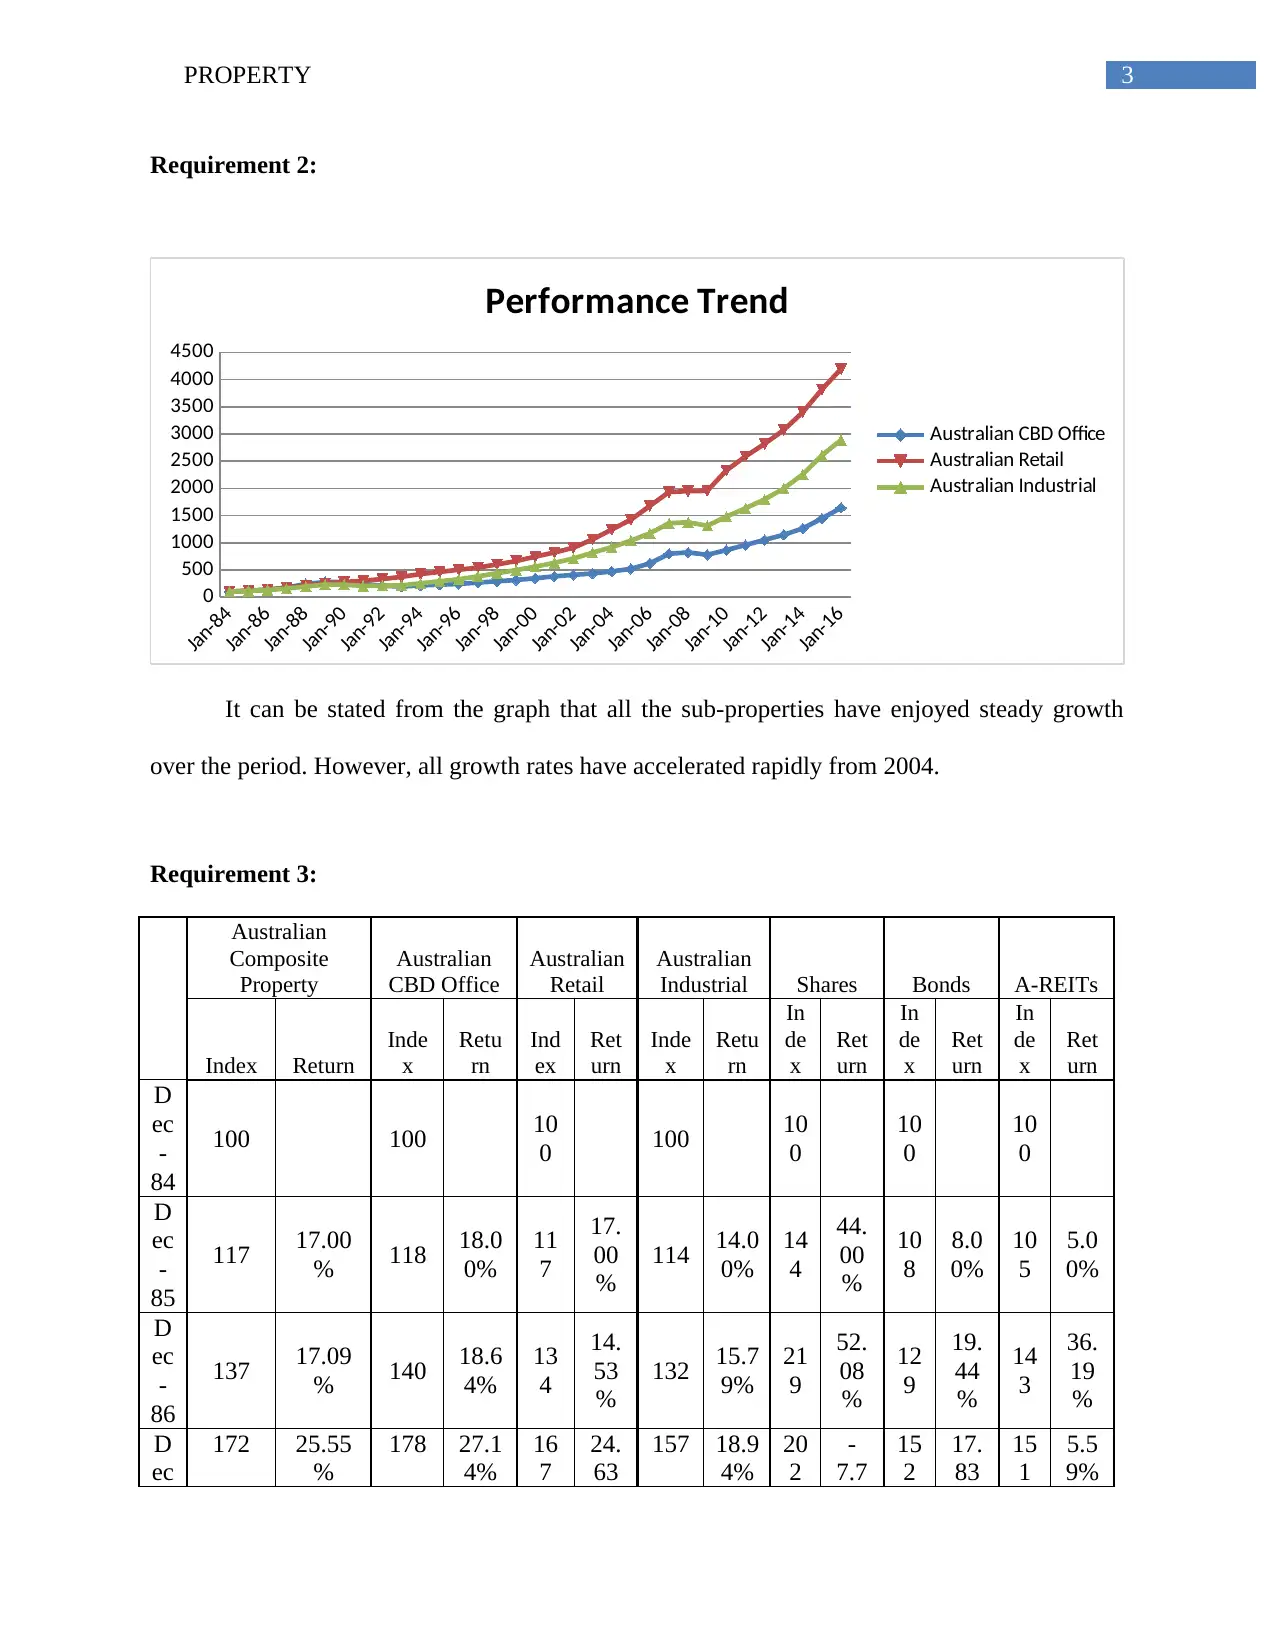
It can be stated from the graph that all the sub-properties have enjoyed steady growth
over the period. However, all growth rates have accelerated rapidly from 2004.
Requirement 3:
Australian
Composite
Property
Australian
CBD Office
Australian
Retail
Australian
Industrial Shares Bonds A-REITs
Index Return
Inde
x
Retu
rn
Ind
ex
Ret
urn
Inde
x
Retu
rn
In
de
x
Ret
urn
In
de
x
Ret
urn
In
de
x
Ret
urn
D
ec
-
84
100 100 10
0 100 10
0
10
0
10
0
D
ec
-
85
117 17.00
% 118 18.0
0%
11
7
17.
00
%
114 14.0
0%
14
4
44.
00
%
10
8
8.0
0%
10
5
5.0
0%
D
ec
-
86
137 17.09
% 140 18.6
4%
13
4
14.
53
%
132 15.7
9%
21
9
52.
08
%
12
9
19.
44
%
14
3
36.
19
%
D
ec
172 25.55
%
178 27.1
4%
16
7
24.
63
157 18.9
4%
20
2
-
7.7
15
2
17.
83
15
1
5.5
9%
Requirement 2:
Jan-84
Jan-86
Jan-88
Jan-90
Jan-92
Jan-94
Jan-96
Jan-98
Jan-00
Jan-02
Jan-04
Jan-06
Jan-08
Jan-10
Jan-12
Jan-14
Jan-16
0
500
1000
1500
2000
2500
3000
3500
4000
4500
Performance Trend
Australian CBD Office
Australian Retail
Australian Industrial
It can be stated from the graph that all the sub-properties have enjoyed steady growth
over the period. However, all growth rates have accelerated rapidly from 2004.
Requirement 3:
Australian
Composite
Property
Australian
CBD Office
Australian
Retail
Australian
Industrial Shares Bonds A-REITs
Index Return
Inde
x
Retu
rn
Ind
ex
Ret
urn
Inde
x
Retu
rn
In
de
x
Ret
urn
In
de
x
Ret
urn
In
de
x
Ret
urn
D
ec
-
84
100 100 10
0 100 10
0
10
0
10
0
D
ec
-
85
117 17.00
% 118 18.0
0%
11
7
17.
00
%
114 14.0
0%
14
4
44.
00
%
10
8
8.0
0%
10
5
5.0
0%
D
ec
-
86
137 17.09
% 140 18.6
4%
13
4
14.
53
%
132 15.7
9%
21
9
52.
08
%
12
9
19.
44
%
14
3
36.
19
%
D
ec
172 25.55
%
178 27.1
4%
16
7
24.
63
157 18.9
4%
20
2
-
7.7
15
2
17.
83
15
1
5.5
9%
Secure Best Marks with AI Grader
Need help grading? Try our AI Grader for instant feedback on your assignments.
4PROPERTY
-
87 % 6% %
D
ec
-
88
228 32.56
% 241 35.3
9%
21
5
28.
74
%
195 24.2
0%
23
8
17.
82
%
16
7
9.8
7%
17
5
15.
89
%
D
ec
-
89
264 15.79
% 279 15.7
7%
24
8
15.
35
%
231 18.4
6%
28
0
17.
65
%
19
0
13.
77
%
17
9
2.2
9%
D
ec
-
90
273 3.41% 280 0.36
%
28
0
12.
90
%
229
-
0.87
%
23
1
-
17.
50
%
22
6
18.
95
%
19
5
8.9
4%
D
ec
-
91
249 -8.79% 241
-
13.9
3%
29
9
6.7
9% 206
-
10.0
4%
31
0
34.
20
%
28
1
24.
34
%
23
4
20.
00
%
D
ec
-
92
236 -5.22% 209
-
13.2
8%
33
2
11.
04
%
212 2.91
%
30
2
-
2.5
8%
30
9
9.9
6%
25
0
6.8
4%
D
ec
-
93
235 -0.42% 194
-
7.18
%
37
3
12.
35
%
218 2.83
%
44
0
45.
70
%
36
0
16.
50
%
32
5
30.
00
%
D
ec
-
94
265 12.77
% 216 11.3
4%
42
4
13.
67
%
254 16.5
1%
40
6
-
7.7
3%
33
6
-
6.6
7%
30
7
-
5.5
4%
D
ec
-
95
287 8.30% 229 6.02
%
46
4
9.4
3% 291 14.5
7%
48
3
18.
97
%
39
8
18.
45
%
34
6
12.
70
%
D
ec
-
96
310 8.01% 243 6.11
%
50
2
8.1
9% 329 13.0
6%
55
3
14.
49
%
44
5
11.
81
%
39
7
14.
74
%
D
ec
-
97
341 10.00
% 267 9.88
%
54
5
8.5
7% 382 16.1
1%
62
1
12.
30
%
49
8
11.
91
%
47
7
20.
15
%
D
ec
-
98
376 10.26
% 291 8.99
%
59
9
9.9
1% 439 14.9
2%
69
3
11.
59
%
54
6
9.6
4%
56
3
18.
03
%
-
87 % 6% %
D
ec
-
88
228 32.56
% 241 35.3
9%
21
5
28.
74
%
195 24.2
0%
23
8
17.
82
%
16
7
9.8
7%
17
5
15.
89
%
D
ec
-
89
264 15.79
% 279 15.7
7%
24
8
15.
35
%
231 18.4
6%
28
0
17.
65
%
19
0
13.
77
%
17
9
2.2
9%
D
ec
-
90
273 3.41% 280 0.36
%
28
0
12.
90
%
229
-
0.87
%
23
1
-
17.
50
%
22
6
18.
95
%
19
5
8.9
4%
D
ec
-
91
249 -8.79% 241
-
13.9
3%
29
9
6.7
9% 206
-
10.0
4%
31
0
34.
20
%
28
1
24.
34
%
23
4
20.
00
%
D
ec
-
92
236 -5.22% 209
-
13.2
8%
33
2
11.
04
%
212 2.91
%
30
2
-
2.5
8%
30
9
9.9
6%
25
0
6.8
4%
D
ec
-
93
235 -0.42% 194
-
7.18
%
37
3
12.
35
%
218 2.83
%
44
0
45.
70
%
36
0
16.
50
%
32
5
30.
00
%
D
ec
-
94
265 12.77
% 216 11.3
4%
42
4
13.
67
%
254 16.5
1%
40
6
-
7.7
3%
33
6
-
6.6
7%
30
7
-
5.5
4%
D
ec
-
95
287 8.30% 229 6.02
%
46
4
9.4
3% 291 14.5
7%
48
3
18.
97
%
39
8
18.
45
%
34
6
12.
70
%
D
ec
-
96
310 8.01% 243 6.11
%
50
2
8.1
9% 329 13.0
6%
55
3
14.
49
%
44
5
11.
81
%
39
7
14.
74
%
D
ec
-
97
341 10.00
% 267 9.88
%
54
5
8.5
7% 382 16.1
1%
62
1
12.
30
%
49
8
11.
91
%
47
7
20.
15
%
D
ec
-
98
376 10.26
% 291 8.99
%
59
9
9.9
1% 439 14.9
2%
69
3
11.
59
%
54
6
9.6
4%
56
3
18.
03
%
5PROPERTY
D
ec
-
99
413 9.84% 314 7.90
%
66
3
10.
68
%
498 13.4
4%
80
4
16.
02
%
53
6
-
1.8
3%
53
5
-
4.9
7%
D
ec
-
00
461 11.62
% 348 10.8
3%
74
4
12.
22
%
561 12.6
5%
83
3
3.6
1%
60
3
12.
50
%
63
1
17.
94
%
D
ec
-
01
508 10.20
% 381 9.48
%
82
0
10.
22
%
631 12.4
8%
91
7
10.
08
%
62
5
3.6
5%
72
5
14.
90
%
D
ec
-
02
556 9.45% 409 7.35
%
90
9
10.
85
%
710 12.5
2%
84
3
-
8.0
7%
67
4
7.8
4%
81
0
11.
72
%
D
ec
-
03
622 11.87
% 435 6.36
%
10
62
16.
83
%
818 15.2
1%
97
7
15.
90
%
68
8
2.0
8%
88
2
8.8
9%
D
ec
-
04
705 13.34
% 472 8.51
%
12
42
16.
95
%
919 12.3
5%
12
46
27.
53
%
75
9
10.
32
%
1,
16
5
32.
09
%
D
ec
-
05
795 12.77
% 520 10.1
7%
14
25
14.
73
%
103
7
12.8
4%
15
01
20.
47
%
80
2
5.6
7%
1,
31
3
12.
70
%
D
ec
-
06
935 17.61
% 621 19.4
2%
16
78
17.
75
%
117
6
13.4
0%
18
76
24.
98
%
82
1
2.3
7%
1,
76
0
34.
04
%
D
ec
-
07
1,113 19.04
% 799 28.6
6%
19
33
15.
20
%
135
9
15.5
6%
21
51
14.
66
%
85
4
4.0
2%
1,
61
3
-
8.3
5%
D
ec
-
08
1,134 1.89% 822 2.88
%
19
49
0.8
3%
137
7
1.32
%
12
83
-
40.
35
%
1,
01
1
18.
38
%
72
1
-
55.
30
%
D
ec
-
09
1109 -2.20% 778
-
5.35
%
19
55
0.3
1%
131
2
-
4.72
%
17
91
39.
59
%
99
0
-
2.0
8%
66
8
-
7.3
5%
D
ec
1216 9.65% 866 11.3
1%
23
29
19.
13
147
9
12.7
3%
18
97
5.9
2%
10
44
5.4
5%
66
3
-
0.7
D
ec
-
99
413 9.84% 314 7.90
%
66
3
10.
68
%
498 13.4
4%
80
4
16.
02
%
53
6
-
1.8
3%
53
5
-
4.9
7%
D
ec
-
00
461 11.62
% 348 10.8
3%
74
4
12.
22
%
561 12.6
5%
83
3
3.6
1%
60
3
12.
50
%
63
1
17.
94
%
D
ec
-
01
508 10.20
% 381 9.48
%
82
0
10.
22
%
631 12.4
8%
91
7
10.
08
%
62
5
3.6
5%
72
5
14.
90
%
D
ec
-
02
556 9.45% 409 7.35
%
90
9
10.
85
%
710 12.5
2%
84
3
-
8.0
7%
67
4
7.8
4%
81
0
11.
72
%
D
ec
-
03
622 11.87
% 435 6.36
%
10
62
16.
83
%
818 15.2
1%
97
7
15.
90
%
68
8
2.0
8%
88
2
8.8
9%
D
ec
-
04
705 13.34
% 472 8.51
%
12
42
16.
95
%
919 12.3
5%
12
46
27.
53
%
75
9
10.
32
%
1,
16
5
32.
09
%
D
ec
-
05
795 12.77
% 520 10.1
7%
14
25
14.
73
%
103
7
12.8
4%
15
01
20.
47
%
80
2
5.6
7%
1,
31
3
12.
70
%
D
ec
-
06
935 17.61
% 621 19.4
2%
16
78
17.
75
%
117
6
13.4
0%
18
76
24.
98
%
82
1
2.3
7%
1,
76
0
34.
04
%
D
ec
-
07
1,113 19.04
% 799 28.6
6%
19
33
15.
20
%
135
9
15.5
6%
21
51
14.
66
%
85
4
4.0
2%
1,
61
3
-
8.3
5%
D
ec
-
08
1,134 1.89% 822 2.88
%
19
49
0.8
3%
137
7
1.32
%
12
83
-
40.
35
%
1,
01
1
18.
38
%
72
1
-
55.
30
%
D
ec
-
09
1109 -2.20% 778
-
5.35
%
19
55
0.3
1%
131
2
-
4.72
%
17
91
39.
59
%
99
0
-
2.0
8%
66
8
-
7.3
5%
D
ec
1216 9.65% 866 11.3
1%
23
29
19.
13
147
9
12.7
3%
18
97
5.9
2%
10
44
5.4
5%
66
3
-
0.7
6PROPERTY
-
10 % 5%
D
ec
-
11
1351 11.10
% 958 10.6
2%
25
89
11.
16
%
163
5
10.5
5%
16
97
-
10.
54
%
11
84
13.
41
%
65
2
-
1.6
6%
D
ec
-
12
1478 9.40% 1051 9.71
%
28
18
8.8
5%
179
7
9.91
%
20
50
20.
80
%
12
51
5.6
6%
87
8
34.
66
%
D
ec
-
13
1614 9.20% 1147 9.13
%
30
72
9.0
1%
199
8
11.1
9%
24
83
21.
12
%
12
12
-
3.1
2%
94
1
7.1
8%
D
ec
-
14
1785 10.59
% 1262 10.0
3%
34
01
10.
71
%
225
8
13.0
1%
26
27
5.8
0%
14
27
17.
74
%
12
23
29.
97
%
D
ec
-
15
2035 14.01
% 1446 14.5
8%
38
23
12.
41
%
260
8
15.5
0%
26
66
1.4
8%
14
61
2.3
8%
13
71
12.
10
%
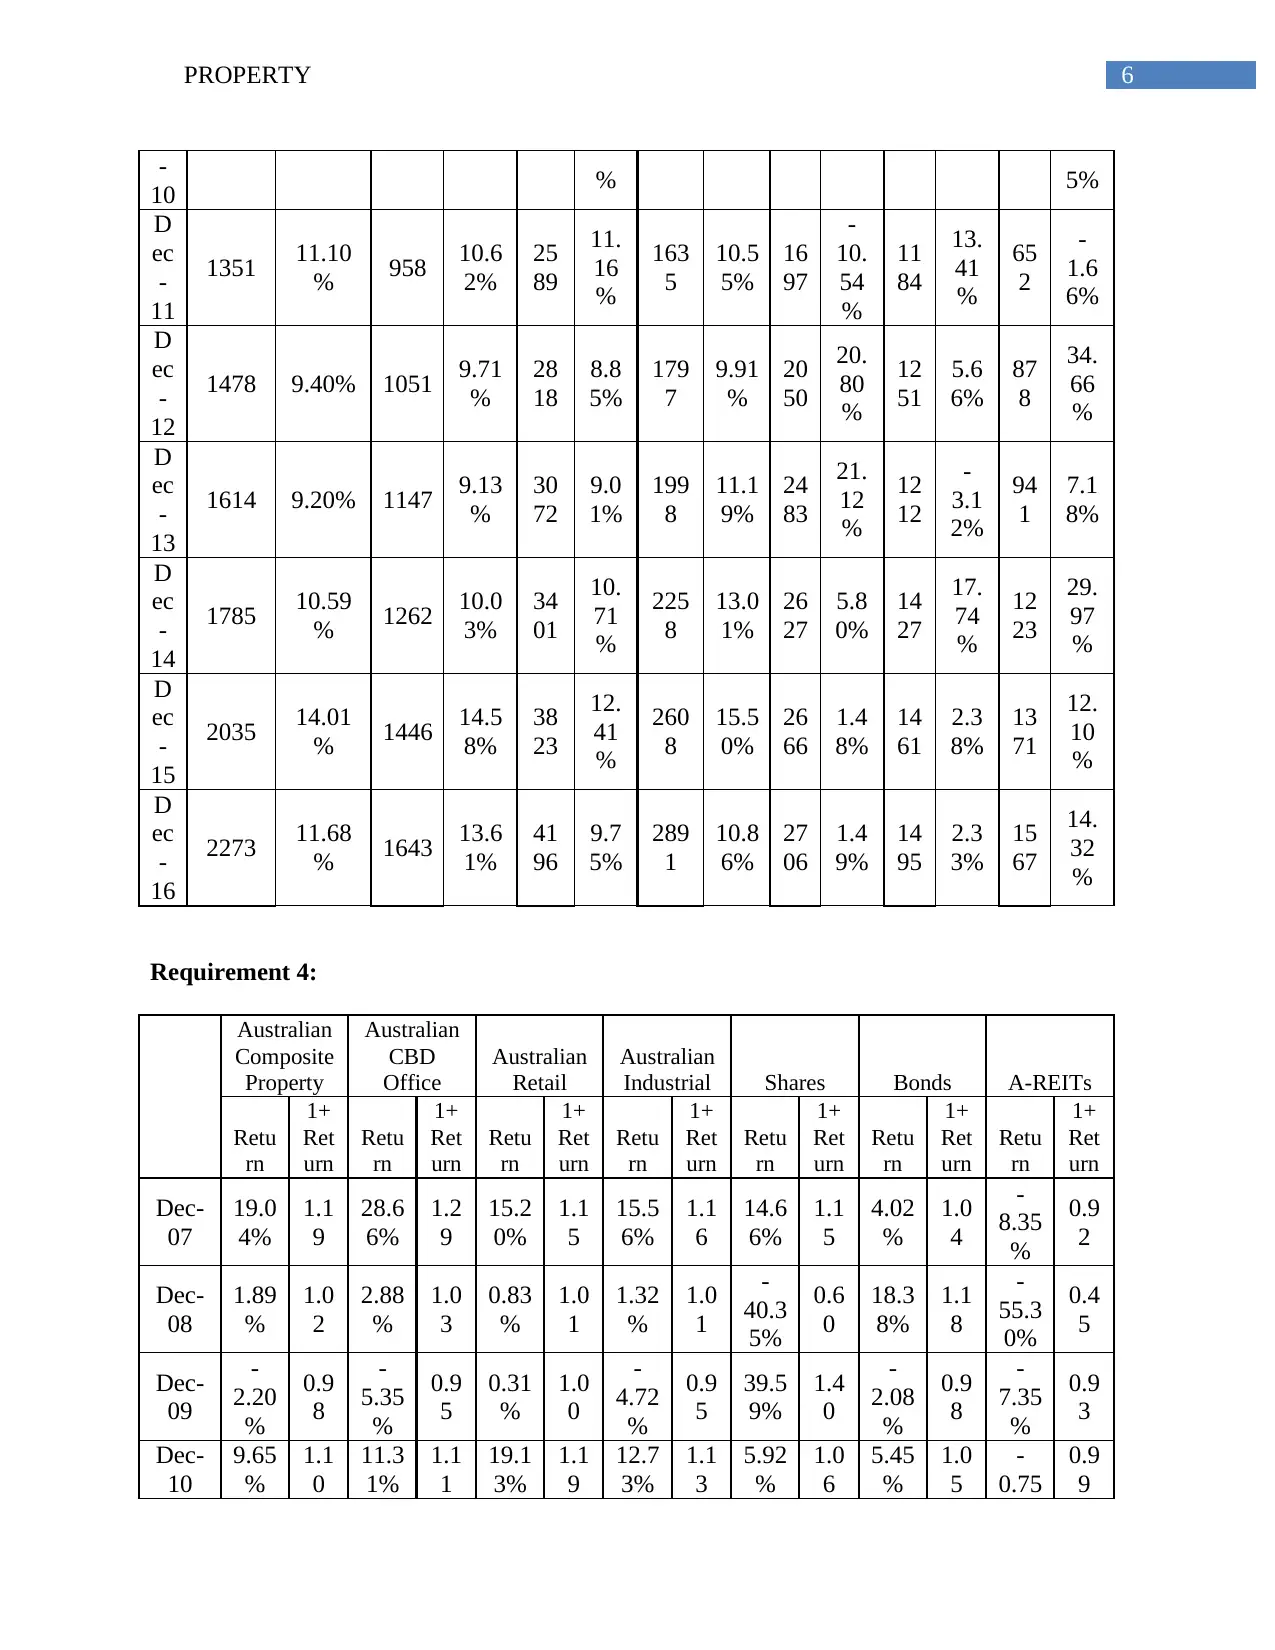
D
ec
-
16
2273 11.68
% 1643 13.6
1%
41
96
9.7
5%
289
1
10.8
6%
27
06
1.4
9%
14
95
2.3
3%
15
67
14.
32
%
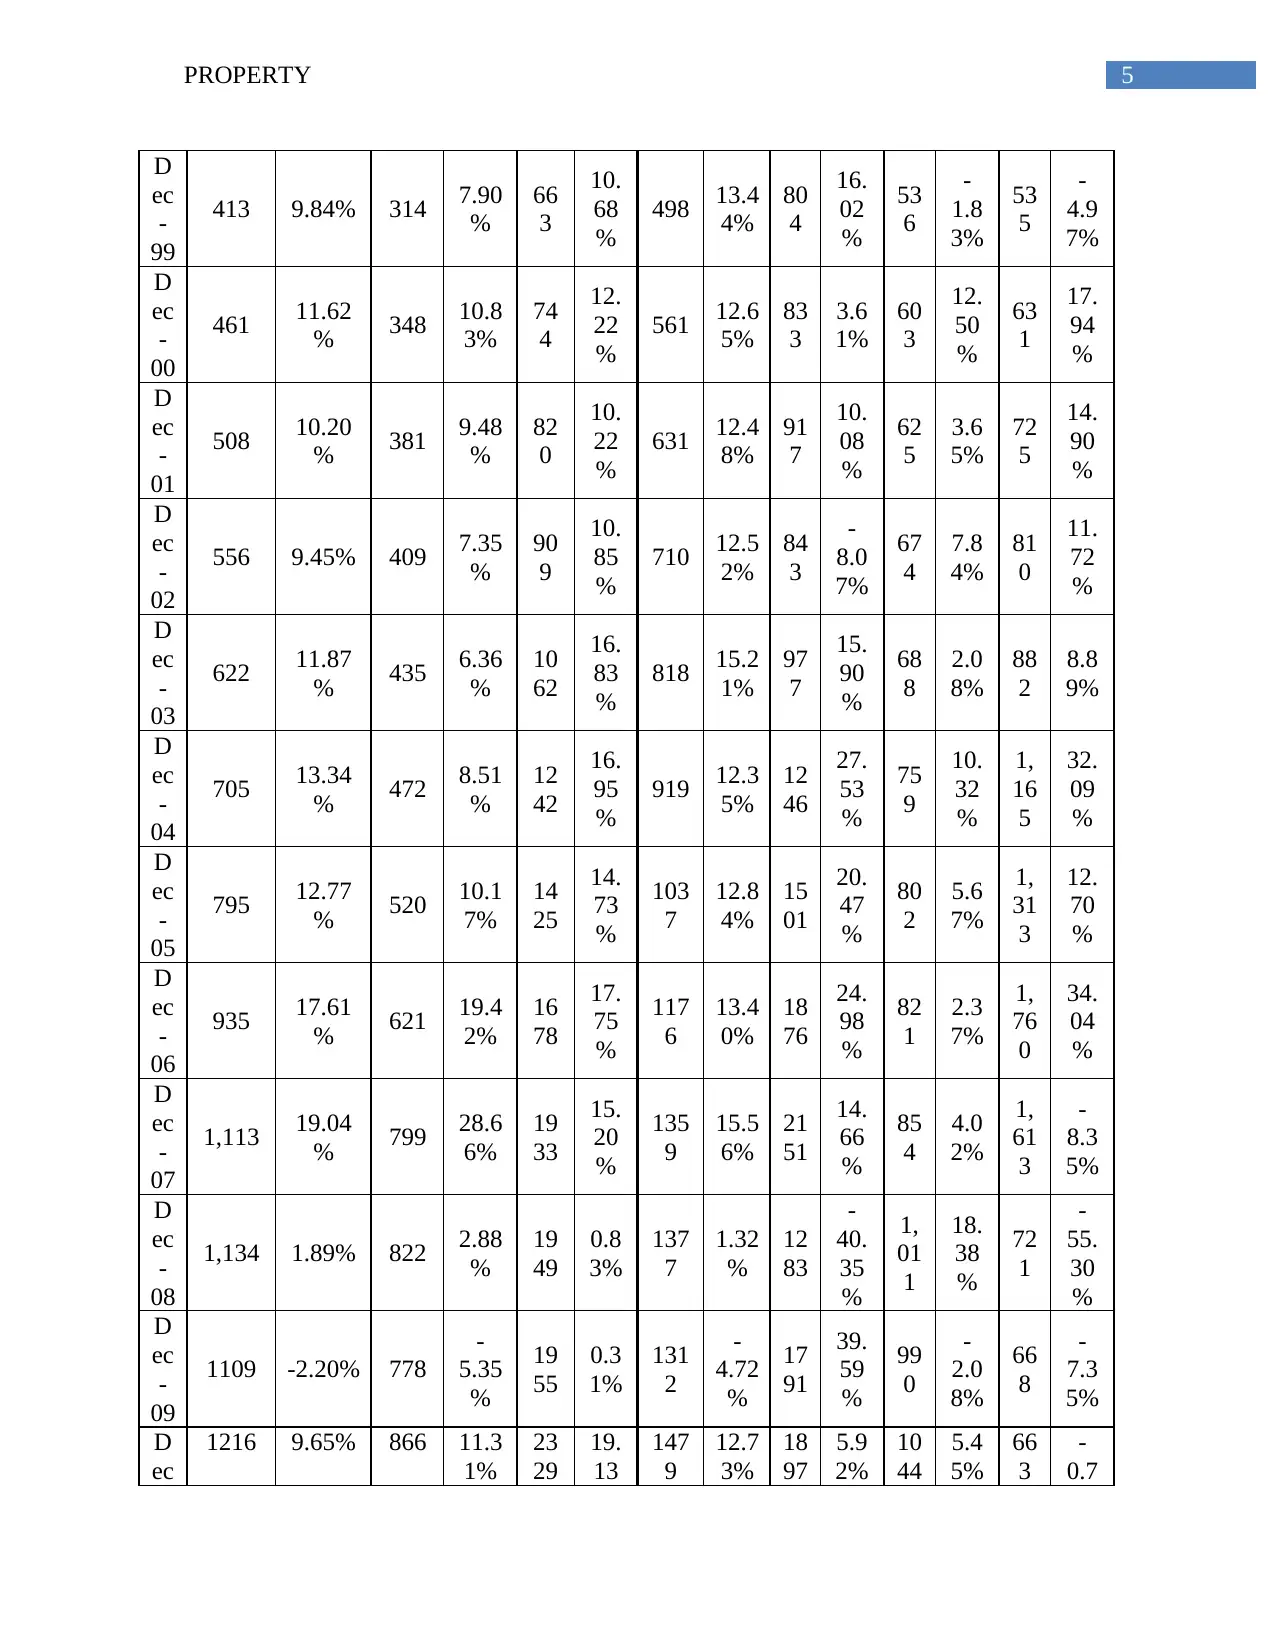
Requirement 4:
Australian
Composite
Property
Australian
CBD
Office
Australian
Retail
Australian
Industrial Shares Bonds A-REITs
Retu
rn
1+
Ret
urn
Retu
rn
1+
Ret
urn
Retu
rn
1+
Ret
urn
Retu
rn
1+
Ret
urn
Retu
rn
1+
Ret
urn
Retu
rn
1+
Ret
urn
Retu
rn
1+
Ret
urn
Dec-
07
19.0
4%
1.1
9
28.6
6%
1.2
9
15.2
0%
1.1
5
15.5
6%
1.1
6
14.6
6%
1.1
5
4.02
%
1.0
4
-
8.35
%
0.9
2
Dec-
08
1.89
%
1.0
2
2.88
%
1.0
3
0.83
%
1.0
1
1.32
%
1.0
1
-
40.3
5%
0.6
0
18.3
8%
1.1
8
-
55.3
0%
0.4
5
Dec-
09
-
2.20
%
0.9
8
-
5.35
%
0.9
5
0.31
%
1.0
0
-
4.72
%
0.9
5
39.5
9%
1.4
0
-
2.08
%
0.9
8
-
7.35
%
0.9
3
Dec-
10
9.65
%
1.1
0
11.3
1%
1.1
1
19.1
3%
1.1
9
12.7
3%
1.1
3
5.92
%
1.0
6
5.45
%
1.0
5
-
0.75
0.9
9
-
10 % 5%
D
ec
-
11
1351 11.10
% 958 10.6
2%
25
89
11.
16
%
163
5
10.5
5%
16
97
-
10.
54
%
11
84
13.
41
%
65
2
-
1.6
6%
D
ec
-
12
1478 9.40% 1051 9.71
%
28
18
8.8
5%
179
7
9.91
%
20
50
20.
80
%
12
51
5.6
6%
87
8
34.
66
%
D
ec
-
13
1614 9.20% 1147 9.13
%
30
72
9.0
1%
199
8
11.1
9%
24
83
21.
12
%
12
12
-
3.1
2%
94
1
7.1
8%
D
ec
-
14
1785 10.59
% 1262 10.0
3%
34
01
10.
71
%
225
8
13.0
1%
26
27
5.8
0%
14
27
17.
74
%
12
23
29.
97
%
D
ec
-
15
2035 14.01
% 1446 14.5
8%
38
23
12.
41
%
260
8
15.5
0%
26
66
1.4
8%
14
61
2.3
8%
13
71
12.
10
%
D
ec
-
16
2273 11.68
% 1643 13.6
1%
41
96
9.7
5%
289
1
10.8
6%
27
06
1.4
9%
14
95
2.3
3%
15
67
14.
32
%
Requirement 4:
Australian
Composite
Property
Australian
CBD
Office
Australian
Retail
Australian
Industrial Shares Bonds A-REITs
Retu
rn
1+
Ret
urn
Retu
rn
1+
Ret
urn
Retu
rn
1+
Ret
urn
Retu
rn
1+
Ret
urn
Retu
rn
1+
Ret
urn
Retu
rn
1+
Ret
urn
Retu
rn
1+
Ret
urn
Dec-
07
19.0
4%
1.1
9
28.6
6%
1.2
9
15.2
0%
1.1
5
15.5
6%
1.1
6
14.6
6%
1.1
5
4.02
%
1.0
4
-
8.35
%
0.9
2
Dec-
08
1.89
%
1.0
2
2.88
%
1.0
3
0.83
%
1.0
1
1.32
%
1.0
1
-
40.3
5%
0.6
0
18.3
8%
1.1
8
-
55.3
0%
0.4
5
Dec-
09
-
2.20
%
0.9
8
-
5.35
%
0.9
5
0.31
%
1.0
0
-
4.72
%
0.9
5
39.5
9%
1.4
0
-
2.08
%
0.9
8
-
7.35
%
0.9
3
Dec-
10
9.65
%
1.1
0
11.3
1%
1.1
1
19.1
3%
1.1
9
12.7
3%
1.1
3
5.92
%
1.0
6
5.45
%
1.0
5
-
0.75
0.9
9
Paraphrase This Document
Need a fresh take? Get an instant paraphrase of this document with our AI Paraphraser
7PROPERTY
%
Dec-
11
11.1
0%
1.1
1
10.6
2%
1.1
1
11.1
6%
1.1
1
10.5
5%
1.1
1
-
10.5
4%
0.8
9
13.4
1%
1.1
3
-
1.66
%
0.9
8
Dec-
12
9.40
%
1.0
9
9.71
%
1.1
0
8.85
%
1.0
9
9.91
%
1.1
0
20.8
0%
1.2
1
5.66
%
1.0
6
34.6
6%
1.3
5
Dec-
13
9.20
%
1.0
9
9.13
%
1.0
9
9.01
%
1.0
9
11.1
9%
1.1
1
21.1
2%
1.2
1
-
3.12
%
0.9
7
7.18
%
1.0
7
Dec-
14
10.5
9%
1.1
1
10.0
3%
1.1
0
10.7
1%
1.1
1
13.0
1%
1.1
3
5.80
%
1.0
6
17.7
4%
1.1
8
29.9
7%
1.3
0
Dec-
15
14.0
1%
1.1
4
14.5
8%
1.1
5
12.4
1%
1.1
2
15.5
0%
1.1
6
1.48
%
1.0
1
2.38
%
1.0
2
12.1
0%
1.1
2
Dec-
16
11.6
8%
1.1
2
13.6
1%
1.1
4
9.75
%
1.1
0
10.8
6%
1.1
1
1.49
%
1.0
1
2.33
%
1.0
2
14.3
2%
1.1
4
Avera
ge
Annu
al
Retur
ns:
a.
2016
11.6
8%
13.6
1%
9.75
%
10.8
6%
1.49
%
2.33
%
14.3
2%
b.
2014-
16
12.0
8%
12.7
2%
10.9
5%
13.1
1%
2.90
%
7.25
%
18.5
4%
c.
2012-
16
10.9
6%
11.3
9%
10.1
4%
12.0
8%
9.78
%
4.78
%
19.1
7%
d.
2007-
16
9.29
%
10.2
2%
9.60
%
9.41
%
3.73
%
6.18
%
-
1.15
%
Requirement 5:
Australian
Composite
Property
Australian
CBD
Office
Australian
Retail
Australian
Industrial Shares Bonds A-REITs
Retu
rn
1+
Ret
urn
Retu
rn
1+
Ret
urn
Retu
rn
1+
Ret
urn
Retu
rn
1+
Ret
urn
Retu
rn
1+
Ret
urn
Retu
rn
1+
Ret
urn
Retu
rn
1+
Ret
urn
%
Dec-
11
11.1
0%
1.1
1
10.6
2%
1.1
1
11.1
6%
1.1
1
10.5
5%
1.1
1
-
10.5
4%
0.8
9
13.4
1%
1.1
3
-
1.66
%
0.9
8
Dec-
12
9.40
%
1.0
9
9.71
%
1.1
0
8.85
%
1.0
9
9.91
%
1.1
0
20.8
0%
1.2
1
5.66
%
1.0
6
34.6
6%
1.3
5
Dec-
13
9.20
%
1.0
9
9.13
%
1.0
9
9.01
%
1.0
9
11.1
9%
1.1
1
21.1
2%
1.2
1
-
3.12
%
0.9
7
7.18
%
1.0
7
Dec-
14
10.5
9%
1.1
1
10.0
3%
1.1
0
10.7
1%
1.1
1
13.0
1%
1.1
3
5.80
%
1.0
6
17.7
4%
1.1
8
29.9
7%
1.3
0
Dec-
15
14.0
1%
1.1
4
14.5
8%
1.1
5
12.4
1%
1.1
2
15.5
0%
1.1
6
1.48
%
1.0
1
2.38
%
1.0
2
12.1
0%
1.1
2
Dec-
16
11.6
8%
1.1
2
13.6
1%
1.1
4
9.75
%
1.1
0
10.8
6%
1.1
1
1.49
%
1.0
1
2.33
%
1.0
2
14.3
2%
1.1
4
Avera
ge
Annu
al
Retur
ns:
a.
2016
11.6
8%
13.6
1%
9.75
%
10.8
6%
1.49
%
2.33
%
14.3
2%
b.
2014-
16
12.0
8%
12.7
2%
10.9
5%
13.1
1%
2.90
%
7.25
%
18.5
4%
c.
2012-
16
10.9
6%
11.3
9%
10.1
4%
12.0
8%
9.78
%
4.78
%
19.1
7%
d.
2007-
16
9.29
%
10.2
2%
9.60
%
9.41
%
3.73
%
6.18
%
-
1.15
%
Requirement 5:
Australian
Composite
Property
Australian
CBD
Office
Australian
Retail
Australian
Industrial Shares Bonds A-REITs
Retu
rn
1+
Ret
urn
Retu
rn
1+
Ret
urn
Retu
rn
1+
Ret
urn
Retu
rn
1+
Ret
urn
Retu
rn
1+
Ret
urn
Retu
rn
1+
Ret
urn
Retu
rn
1+
Ret
urn
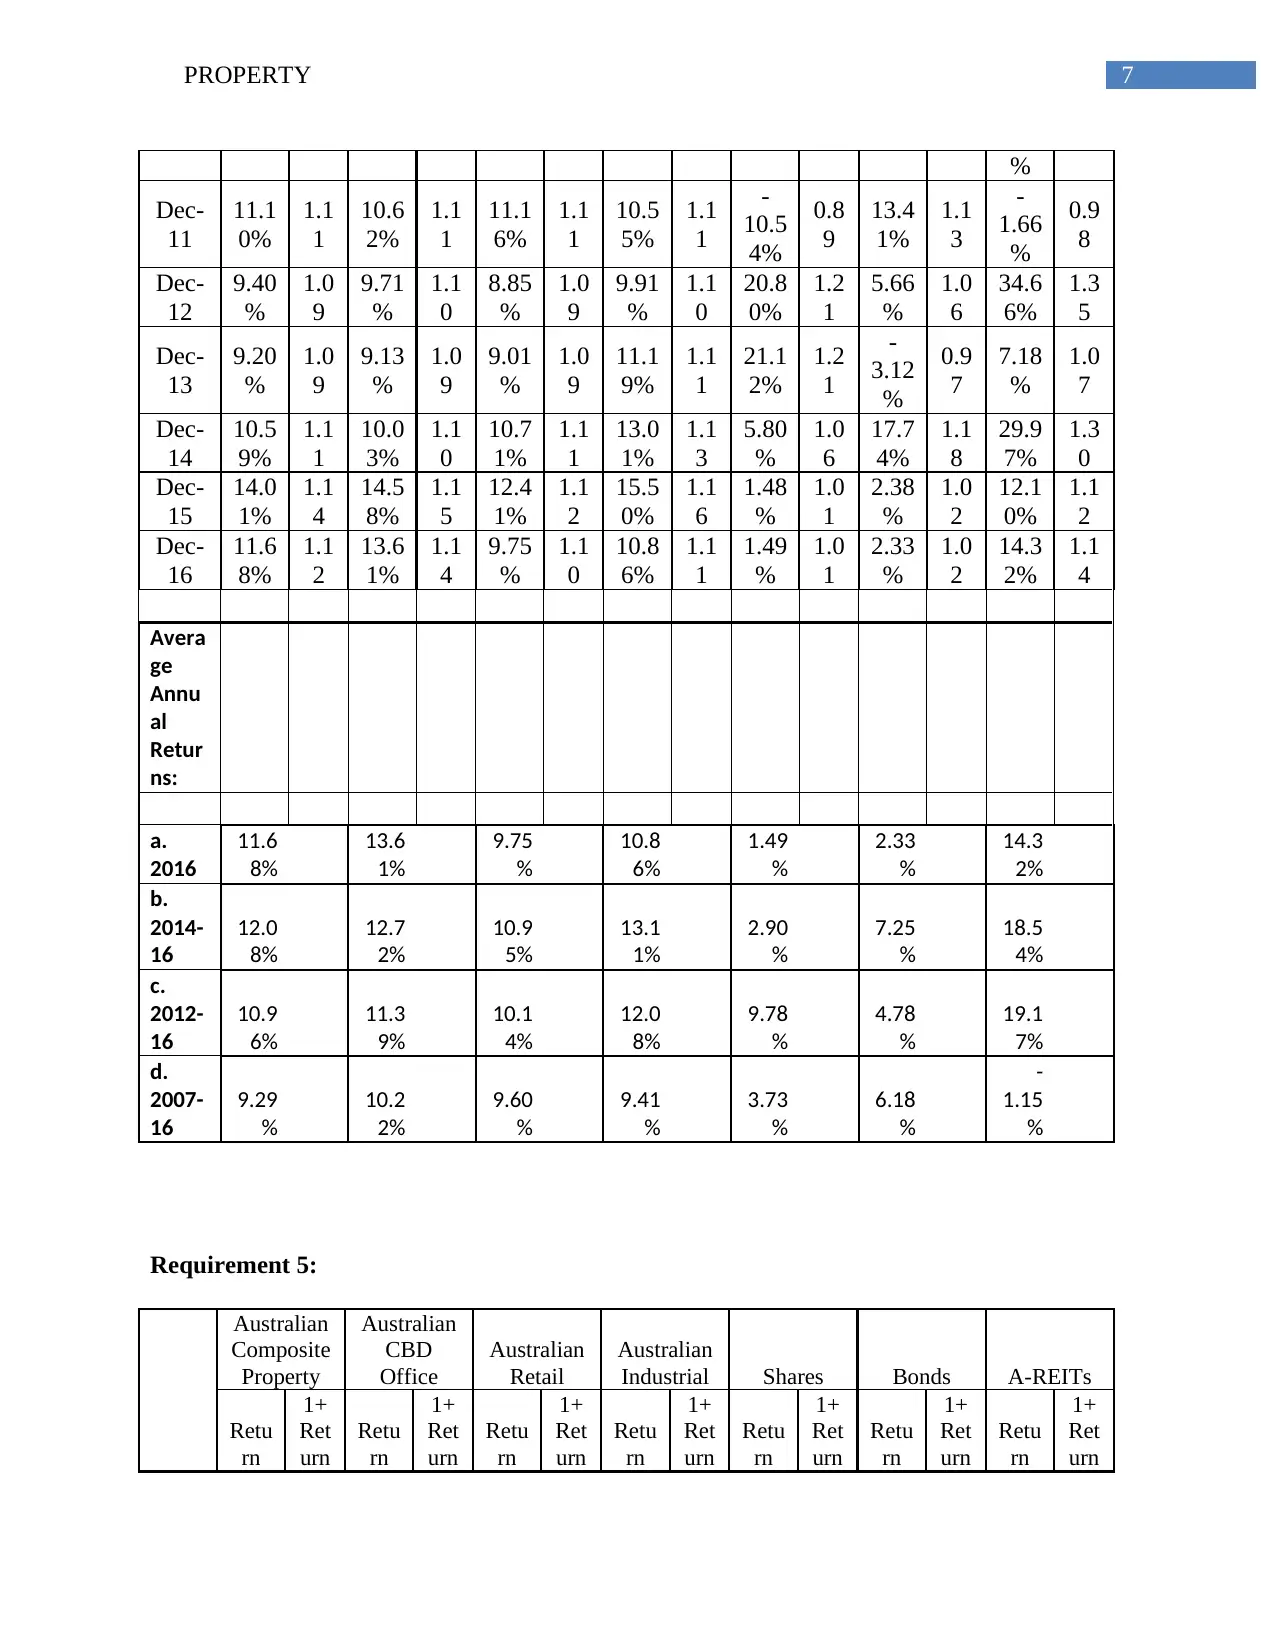
8PROPERTY
Dec-
84
Dec-
85
17.0
0%
1.1
7
18.0
0%
1.1
8
17.0
0%
1.1
7
14.0
0%
1.1
4
44.0
0%
1.4
4
8.00
%
1.0
8
5.00
%
1.0
5
Dec-
86
17.0
9%
1.1
7
18.6
4%
1.1
9
14.5
3%
1.1
5
15.7
9%
1.1
6
52.0
8%
1.5
2
19.4
4%
1.1
9
36.1
9%
1.3
6
Dec-
87
25.5
5%
1.2
6
27.1
4%
1.2
7
24.6
3%
1.2
5
18.9
4%
1.1
9
-
7.76
%
0.9
2
17.8
3%
1.1
8
5.59
%
1.0
6
Dec-
88
32.5
6%
1.3
3
35.3
9%
1.3
5
28.7
4%
1.2
9
24.2
0%
1.2
4
17.8
2%
1.1
8
9.87
%
1.1
0
15.8
9%
1.1
6
Dec-
89
15.7
9%
1.1
6
15.7
7%
1.1
6
15.3
5%
1.1
5
18.4
6%
1.1
8
17.6
5%
1.1
8
13.7
7%
1.1
4
2.29
%
1.0
2
Dec-
90
3.41
%
1.0
3
0.36
%
1.0
0
12.9
0%
1.1
3
-
0.87
%
0.9
9
-
17.5
0%
0.8
3
18.9
5%
1.1
9
8.94
%
1.0
9
Dec-
91
-
8.79
%
0.9
1
-
13.9
3%
0.8
6
6.79
%
1.0
7
-
10.0
4%
0.9
0
34.2
0%
1.3
4
24.3
4%
1.2
4
20.0
0%
1.2
0
Dec-
92
-
5.22
%
0.9
5
-
13.2
8%
0.8
7
11.0
4%
1.1
1
2.91
%
1.0
3
-
2.58
%
0.9
7
9.96
%
1.1
0
6.84
%
1.0
7
Dec-
93
-
0.42
%
1.0
0
-
7.18
%
0.9
3
12.3
5%
1.1
2
2.83
%
1.0
3
45.7
0%
1.4
6
16.5
0%
1.1
7
30.0
0%
1.3
0
Dec-
94
12.7
7%
1.1
3
11.3
4%
1.1
1
13.6
7%
1.1
4
16.5
1%
1.1
7
-
7.73
%
0.9
2
-
6.67
%
0.9
3
-
5.54
%
0.9
4
Dec-
95
8.30
%
1.0
8
6.02
%
1.0
6
9.43
%
1.0
9
14.5
7%
1.1
5
18.9
7%
1.1
9
18.4
5%
1.1
8
12.7
0%
1.1
3
Dec-
96
8.01
%
1.0
8
6.11
%
1.0
6
8.19
%
1.0
8
13.0
6%
1.1
3
14.4
9%
1.1
4
11.8
1%
1.1
2
14.7
4%
1.1
5
Dec-
97
10.0
0%
1.1
0
9.88
%
1.1
0
8.57
%
1.0
9
16.1
1%
1.1
6
12.3
0%
1.1
2
11.9
1%
1.1
2
20.1
5%
1.2
0
Dec-
98
10.2
6%
1.1
0
8.99
%
1.0
9
9.91
%
1.1
0
14.9
2%
1.1
5
11.5
9%
1.1
2
9.64
%
1.1
0
18.0
3%
1.1
8
Dec-
99
9.84
%
1.1
0
7.90
%
1.0
8
10.6
8%
1.1
1
13.4
4%
1.1
3
16.0
2%
1.1
6
-
1.83
%
0.9
8
-
4.97
%
0.9
5
Dec-
00
11.6
2%
1.1
2
10.8
3%
1.1
1
12.2
2%
1.1
2
12.6
5%
1.1
3
3.61
%
1.0
4
12.5
0%
1.1
3
17.9
4%
1.1
8
Dec-
01
10.2
0%
1.1
0
9.48
%
1.0
9
10.2
2%
1.1
0
12.4
8%
1.1
2
10.0
8%
1.1
0
3.65
%
1.0
4
14.9
0%
1.1
5
Dec-
02
9.45
%
1.0
9
7.35
%
1.0
7
10.8
5%
1.1
1
12.5
2%
1.1
3
-
8.07
%
0.9
2
7.84
%
1.0
8
11.7
2%
1.1
2
Dec-
84
Dec-
85
17.0
0%
1.1
7
18.0
0%
1.1
8
17.0
0%
1.1
7
14.0
0%
1.1
4
44.0
0%
1.4
4
8.00
%
1.0
8
5.00
%
1.0
5
Dec-
86
17.0
9%
1.1
7
18.6
4%
1.1
9
14.5
3%
1.1
5
15.7
9%
1.1
6
52.0
8%
1.5
2
19.4
4%
1.1
9
36.1
9%
1.3
6
Dec-
87
25.5
5%
1.2
6
27.1
4%
1.2
7
24.6
3%
1.2
5
18.9
4%
1.1
9
-
7.76
%
0.9
2
17.8
3%
1.1
8
5.59
%
1.0
6
Dec-
88
32.5
6%
1.3
3
35.3
9%
1.3
5
28.7
4%
1.2
9
24.2
0%
1.2
4
17.8
2%
1.1
8
9.87
%
1.1
0
15.8
9%
1.1
6
Dec-
89
15.7
9%
1.1
6
15.7
7%
1.1
6
15.3
5%
1.1
5
18.4
6%
1.1
8
17.6
5%
1.1
8
13.7
7%
1.1
4
2.29
%
1.0
2
Dec-
90
3.41
%
1.0
3
0.36
%
1.0
0
12.9
0%
1.1
3
-
0.87
%
0.9
9
-
17.5
0%
0.8
3
18.9
5%
1.1
9
8.94
%
1.0
9
Dec-
91
-
8.79
%
0.9
1
-
13.9
3%
0.8
6
6.79
%
1.0
7
-
10.0
4%
0.9
0
34.2
0%
1.3
4
24.3
4%
1.2
4
20.0
0%
1.2
0
Dec-
92
-
5.22
%
0.9
5
-
13.2
8%
0.8
7
11.0
4%
1.1
1
2.91
%
1.0
3
-
2.58
%
0.9
7
9.96
%
1.1
0
6.84
%
1.0
7
Dec-
93
-
0.42
%
1.0
0
-
7.18
%
0.9
3
12.3
5%
1.1
2
2.83
%
1.0
3
45.7
0%
1.4
6
16.5
0%
1.1
7
30.0
0%
1.3
0
Dec-
94
12.7
7%
1.1
3
11.3
4%
1.1
1
13.6
7%
1.1
4
16.5
1%
1.1
7
-
7.73
%
0.9
2
-
6.67
%
0.9
3
-
5.54
%
0.9
4
Dec-
95
8.30
%
1.0
8
6.02
%
1.0
6
9.43
%
1.0
9
14.5
7%
1.1
5
18.9
7%
1.1
9
18.4
5%
1.1
8
12.7
0%
1.1
3
Dec-
96
8.01
%
1.0
8
6.11
%
1.0
6
8.19
%
1.0
8
13.0
6%
1.1
3
14.4
9%
1.1
4
11.8
1%
1.1
2
14.7
4%
1.1
5
Dec-
97
10.0
0%
1.1
0
9.88
%
1.1
0
8.57
%
1.0
9
16.1
1%
1.1
6
12.3
0%
1.1
2
11.9
1%
1.1
2
20.1
5%
1.2
0
Dec-
98
10.2
6%
1.1
0
8.99
%
1.0
9
9.91
%
1.1
0
14.9
2%
1.1
5
11.5
9%
1.1
2
9.64
%
1.1
0
18.0
3%
1.1
8
Dec-
99
9.84
%
1.1
0
7.90
%
1.0
8
10.6
8%
1.1
1
13.4
4%
1.1
3
16.0
2%
1.1
6
-
1.83
%
0.9
8
-
4.97
%
0.9
5
Dec-
00
11.6
2%
1.1
2
10.8
3%
1.1
1
12.2
2%
1.1
2
12.6
5%
1.1
3
3.61
%
1.0
4
12.5
0%
1.1
3
17.9
4%
1.1
8
Dec-
01
10.2
0%
1.1
0
9.48
%
1.0
9
10.2
2%
1.1
0
12.4
8%
1.1
2
10.0
8%
1.1
0
3.65
%
1.0
4
14.9
0%
1.1
5
Dec-
02
9.45
%
1.0
9
7.35
%
1.0
7
10.8
5%
1.1
1
12.5
2%
1.1
3
-
8.07
%
0.9
2
7.84
%
1.0
8
11.7
2%
1.1
2
9PROPERTY
Dec-
03
11.8
7%
1.1
2
6.36
%
1.0
6
16.8
3%
1.1
7
15.2
1%
1.1
5
15.9
0%
1.1
6
2.08
%
1.0
2
8.89
%
1.0
9
Dec-
04
13.3
4%
1.1
3
8.51
%
1.0
9
16.9
5%
1.1
7
12.3
5%
1.1
2
27.5
3%
1.2
8
10.3
2%
1.1
0
32.0
9%
1.3
2
Dec-
05
12.7
7%
1.1
3
10.1
7%
1.1
0
14.7
3%
1.1
5
12.8
4%
1.1
3
20.4
7%
1.2
0
5.67
%
1.0
6
12.7
0%
1.1
3
Dec-
06
17.6
1%
1.1
8
19.4
2%
1.1
9
17.7
5%
1.1
8
13.4
0%
1.1
3
24.9
8%
1.2
5
2.37
%
1.0
2
34.0
4%
1.3
4
Dec-
07
19.0
4%
1.1
9
28.6
6%
1.2
9
15.2
0%
1.1
5
15.5
6%
1.1
6
14.6
6%
1.1
5
4.02
%
1.0
4
-
8.35
%
0.9
2
Dec-
08
1.89
%
1.0
2
2.88
%
1.0
3
0.83
%
1.0
1
1.32
%
1.0
1
-
40.3
5%
0.6
0
18.3
8%
1.1
8
-
55.3
0%
0.4
5
Dec-
09
-
2.20
%
0.9
8
-
5.35
%
0.9
5
0.31
%
1.0
0
-
4.72
%
0.9
5
39.5
9%
1.4
0
-
2.08
%
0.9
8
-
7.35
%
0.9
3
Dec-
10
9.65
%
1.1
0
11.3
1%
1.1
1
19.1
3%
1.1
9
12.7
3%
1.1
3
5.92
%
1.0
6
5.45
%
1.0
5
-
0.75
%
0.9
9
Dec-
11
11.1
0%
1.1
1
10.6
2%
1.1
1
11.1
6%
1.1
1
10.5
5%
1.1
1
-
10.5
4%
0.8
9
13.4
1%
1.1
3
-
1.66
%
0.9
8
Dec-
12
9.40
%
1.0
9
9.71
%
1.1
0
8.85
%
1.0
9
9.91
%
1.1
0
20.8
0%
1.2
1
5.66
%
1.0
6
34.6
6%
1.3
5
Dec-
13
9.20
%
1.0
9
9.13
%
1.0
9
9.01
%
1.0
9
11.1
9%
1.1
1
21.1
2%
1.2
1
-
3.12
%
0.9
7
7.18
%
1.0
7
Dec-
14
10.5
9%
1.1
1
10.0
3%
1.1
0
10.7
1%
1.1
1
13.0
1%
1.1
3
5.80
%
1.0
6
17.7
4%
1.1
8
29.9
7%
1.3
0
Dec-
15
14.0
1%
1.1
4
14.5
8%
1.1
5
12.4
1%
1.1
2
15.5
0%
1.1
6
1.48
%
1.0
1
2.38
%
1.0
2
12.1
0%
1.1
2
Dec-
16
11.6
8%
1.1
2
13.6
1%
1.1
4
9.75
%
1.1
0
10.8
6%
1.1
1
1.49
%
1.0
1
2.33
%
1.0
2
14.3
2%
1.1
4
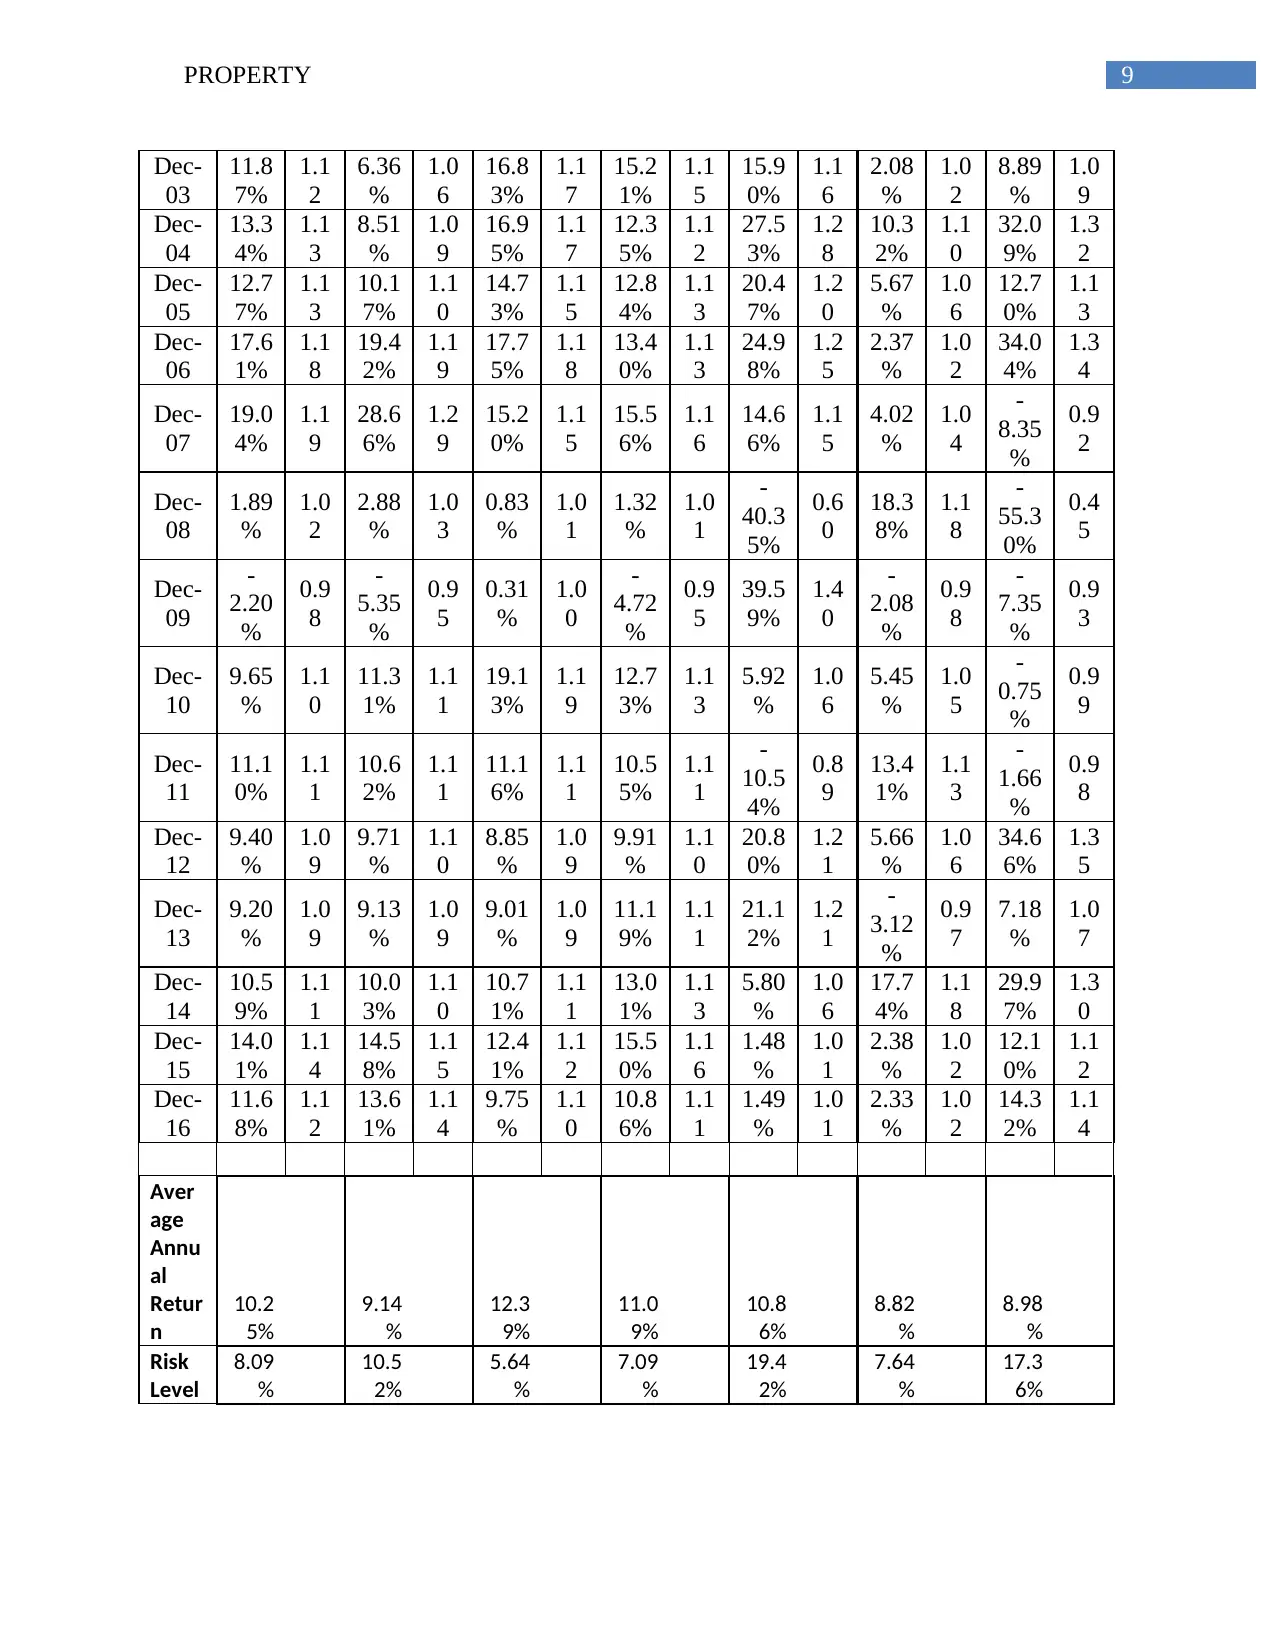
Aver
age
Annu
al
Retur
n
10.2
5%
9.14
%
12.3
9%
11.0
9%
10.8
6%
8.82
%
8.98
%
Risk
Level
8.09
%
10.5
2%
5.64
%
7.09
%
19.4
2%
7.64
%
17.3
6%
Dec-
03
11.8
7%
1.1
2
6.36
%
1.0
6
16.8
3%
1.1
7
15.2
1%
1.1
5
15.9
0%
1.1
6
2.08
%
1.0
2
8.89
%
1.0
9
Dec-
04
13.3
4%
1.1
3
8.51
%
1.0
9
16.9
5%
1.1
7
12.3
5%
1.1
2
27.5
3%
1.2
8
10.3
2%
1.1
0
32.0
9%
1.3
2
Dec-
05
12.7
7%
1.1
3
10.1
7%
1.1
0
14.7
3%
1.1
5
12.8
4%
1.1
3
20.4
7%
1.2
0
5.67
%
1.0
6
12.7
0%
1.1
3
Dec-
06
17.6
1%
1.1
8
19.4
2%
1.1
9
17.7
5%
1.1
8
13.4
0%
1.1
3
24.9
8%
1.2
5
2.37
%
1.0
2
34.0
4%
1.3
4
Dec-
07
19.0
4%
1.1
9
28.6
6%
1.2
9
15.2
0%
1.1
5
15.5
6%
1.1
6
14.6
6%
1.1
5
4.02
%
1.0
4
-
8.35
%
0.9
2
Dec-
08
1.89
%
1.0
2
2.88
%
1.0
3
0.83
%
1.0
1
1.32
%
1.0
1
-
40.3
5%
0.6
0
18.3
8%
1.1
8
-
55.3
0%
0.4
5
Dec-
09
-
2.20
%
0.9
8
-
5.35
%
0.9
5
0.31
%
1.0
0
-
4.72
%
0.9
5
39.5
9%
1.4
0
-
2.08
%
0.9
8
-
7.35
%
0.9
3
Dec-
10
9.65
%
1.1
0
11.3
1%
1.1
1
19.1
3%
1.1
9
12.7
3%
1.1
3
5.92
%
1.0
6
5.45
%
1.0
5
-
0.75
%
0.9
9
Dec-
11
11.1
0%
1.1
1
10.6
2%
1.1
1
11.1
6%
1.1
1
10.5
5%
1.1
1
-
10.5
4%
0.8
9
13.4
1%
1.1
3
-
1.66
%
0.9
8
Dec-
12
9.40
%
1.0
9
9.71
%
1.1
0
8.85
%
1.0
9
9.91
%
1.1
0
20.8
0%
1.2
1
5.66
%
1.0
6
34.6
6%
1.3
5
Dec-
13
9.20
%
1.0
9
9.13
%
1.0
9
9.01
%
1.0
9
11.1
9%
1.1
1
21.1
2%
1.2
1
-
3.12
%
0.9
7
7.18
%
1.0
7
Dec-
14
10.5
9%
1.1
1
10.0
3%
1.1
0
10.7
1%
1.1
1
13.0
1%
1.1
3
5.80
%
1.0
6
17.7
4%
1.1
8
29.9
7%
1.3
0
Dec-
15
14.0
1%
1.1
4
14.5
8%
1.1
5
12.4
1%
1.1
2
15.5
0%
1.1
6
1.48
%
1.0
1
2.38
%
1.0
2
12.1
0%
1.1
2
Dec-
16
11.6
8%
1.1
2
13.6
1%
1.1
4
9.75
%
1.1
0
10.8
6%
1.1
1
1.49
%
1.0
1
2.33
%
1.0
2
14.3
2%
1.1
4
Aver
age
Annu
al
Retur
n
10.2
5%
9.14
%
12.3
9%
11.0
9%
10.8
6%
8.82
%
8.98
%
Risk
Level
8.09
%
10.5
2%
5.64
%
7.09
%
19.4
2%
7.64
%
17.3
6%
Secure Best Marks with AI Grader
Need help grading? Try our AI Grader for instant feedback on your assignments.
10PROPERTY
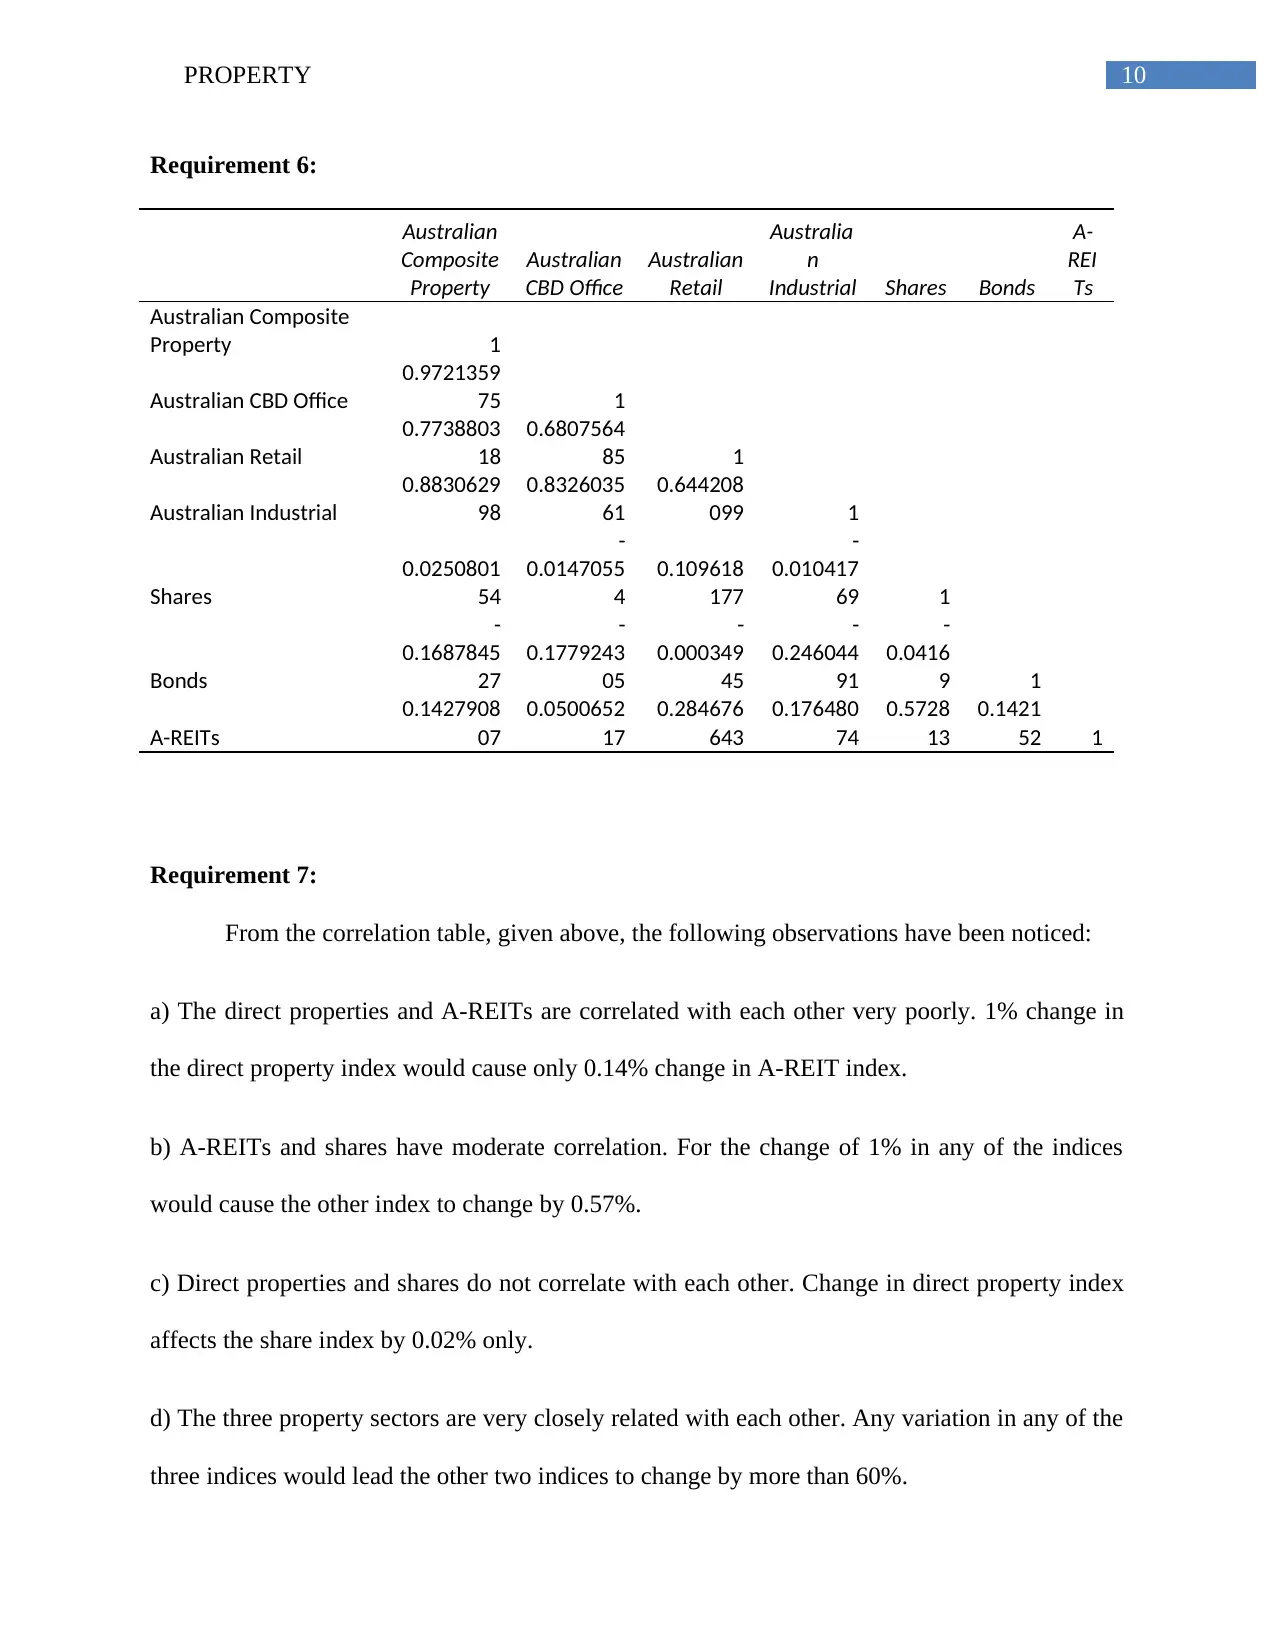
Requirement 6:
Australian
Composite
Property
Australian
CBD Office
Australian
Retail
Australia
n
Industrial Shares Bonds
A-
REI
Ts
Australian Composite
Property 1
Australian CBD Office
0.9721359
75 1
Australian Retail
0.7738803
18
0.6807564
85 1
Australian Industrial
0.8830629
98
0.8326035
61
0.644208
099 1
Shares
0.0250801
54
-
0.0147055
4
0.109618
177
-
0.010417
69 1
Bonds
-
0.1687845
27
-
0.1779243
05
-
0.000349
45
-
0.246044
91
-
0.0416
9 1
A-REITs
0.1427908
07
0.0500652
17
0.284676
643
0.176480
74
0.5728
13
0.1421
52 1
Requirement 7:
From the correlation table, given above, the following observations have been noticed:
a) The direct properties and A-REITs are correlated with each other very poorly. 1% change in
the direct property index would cause only 0.14% change in A-REIT index.
b) A-REITs and shares have moderate correlation. For the change of 1% in any of the indices
would cause the other index to change by 0.57%.
c) Direct properties and shares do not correlate with each other. Change in direct property index
affects the share index by 0.02% only.
d) The three property sectors are very closely related with each other. Any variation in any of the
three indices would lead the other two indices to change by more than 60%.
11PROPERTY
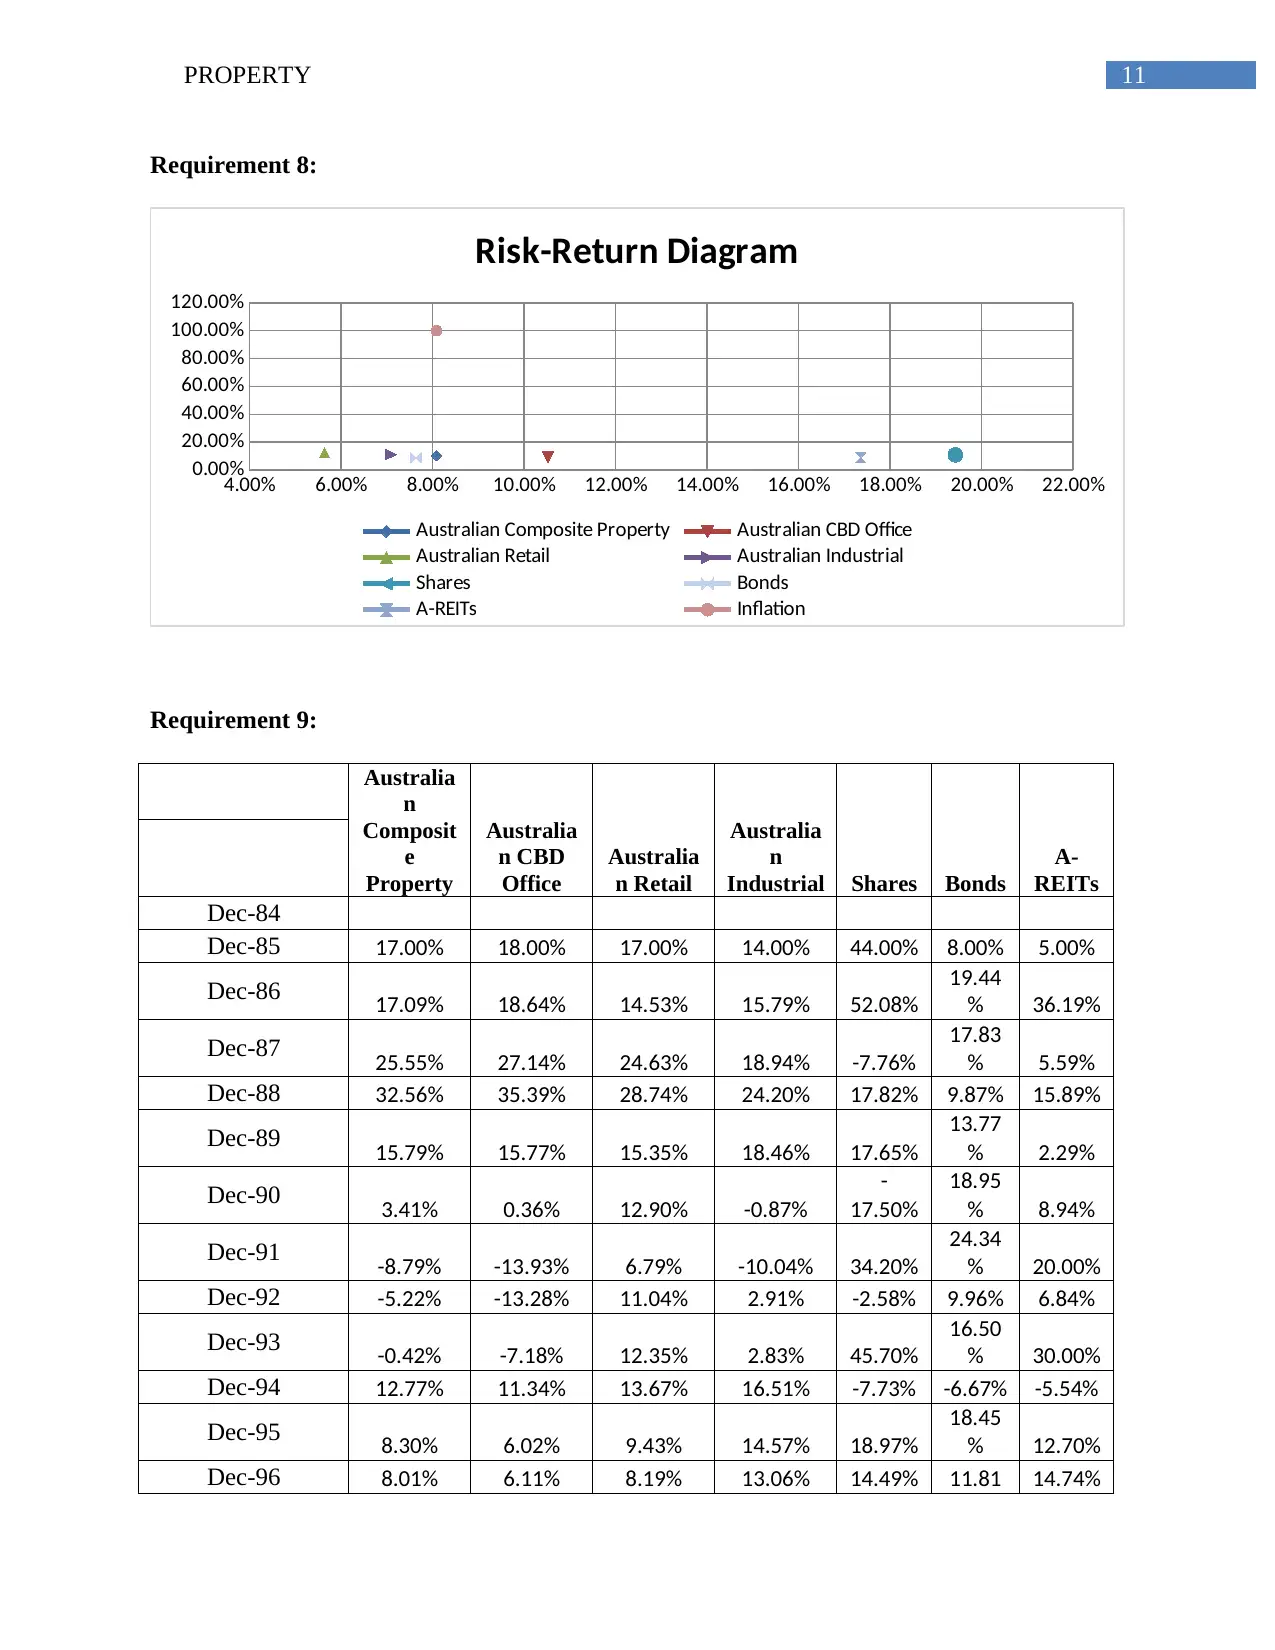
Requirement 8:
4.00% 6.00% 8.00% 10.00% 12.00% 14.00% 16.00% 18.00% 20.00% 22.00%
0.00%
20.00%
40.00%
60.00%
80.00%
100.00%
120.00%
Risk-Return Diagram
Australian Composite Property Australian CBD Office
Australian Retail Australian Industrial
Shares Bonds
A-REITs Inflation
Requirement 9:
Australia
n
Composit
e
Property
Australia
n CBD
Office
Australia
n Retail
Australia
n
Industrial Shares Bonds
A-
REITs
Dec-84
Dec-85 17.00% 18.00% 17.00% 14.00% 44.00% 8.00% 5.00%
Dec-86 17.09% 18.64% 14.53% 15.79% 52.08%
19.44
% 36.19%
Dec-87 25.55% 27.14% 24.63% 18.94% -7.76%
17.83
% 5.59%
Dec-88 32.56% 35.39% 28.74% 24.20% 17.82% 9.87% 15.89%
Dec-89 15.79% 15.77% 15.35% 18.46% 17.65%
13.77
% 2.29%
Dec-90 3.41% 0.36% 12.90% -0.87%
-
17.50%
18.95
% 8.94%
Dec-91 -8.79% -13.93% 6.79% -10.04% 34.20%
24.34
% 20.00%
Dec-92 -5.22% -13.28% 11.04% 2.91% -2.58% 9.96% 6.84%
Dec-93 -0.42% -7.18% 12.35% 2.83% 45.70%
16.50
% 30.00%
Dec-94 12.77% 11.34% 13.67% 16.51% -7.73% -6.67% -5.54%
Dec-95 8.30% 6.02% 9.43% 14.57% 18.97%
18.45
% 12.70%
Dec-96 8.01% 6.11% 8.19% 13.06% 14.49% 11.81 14.74%
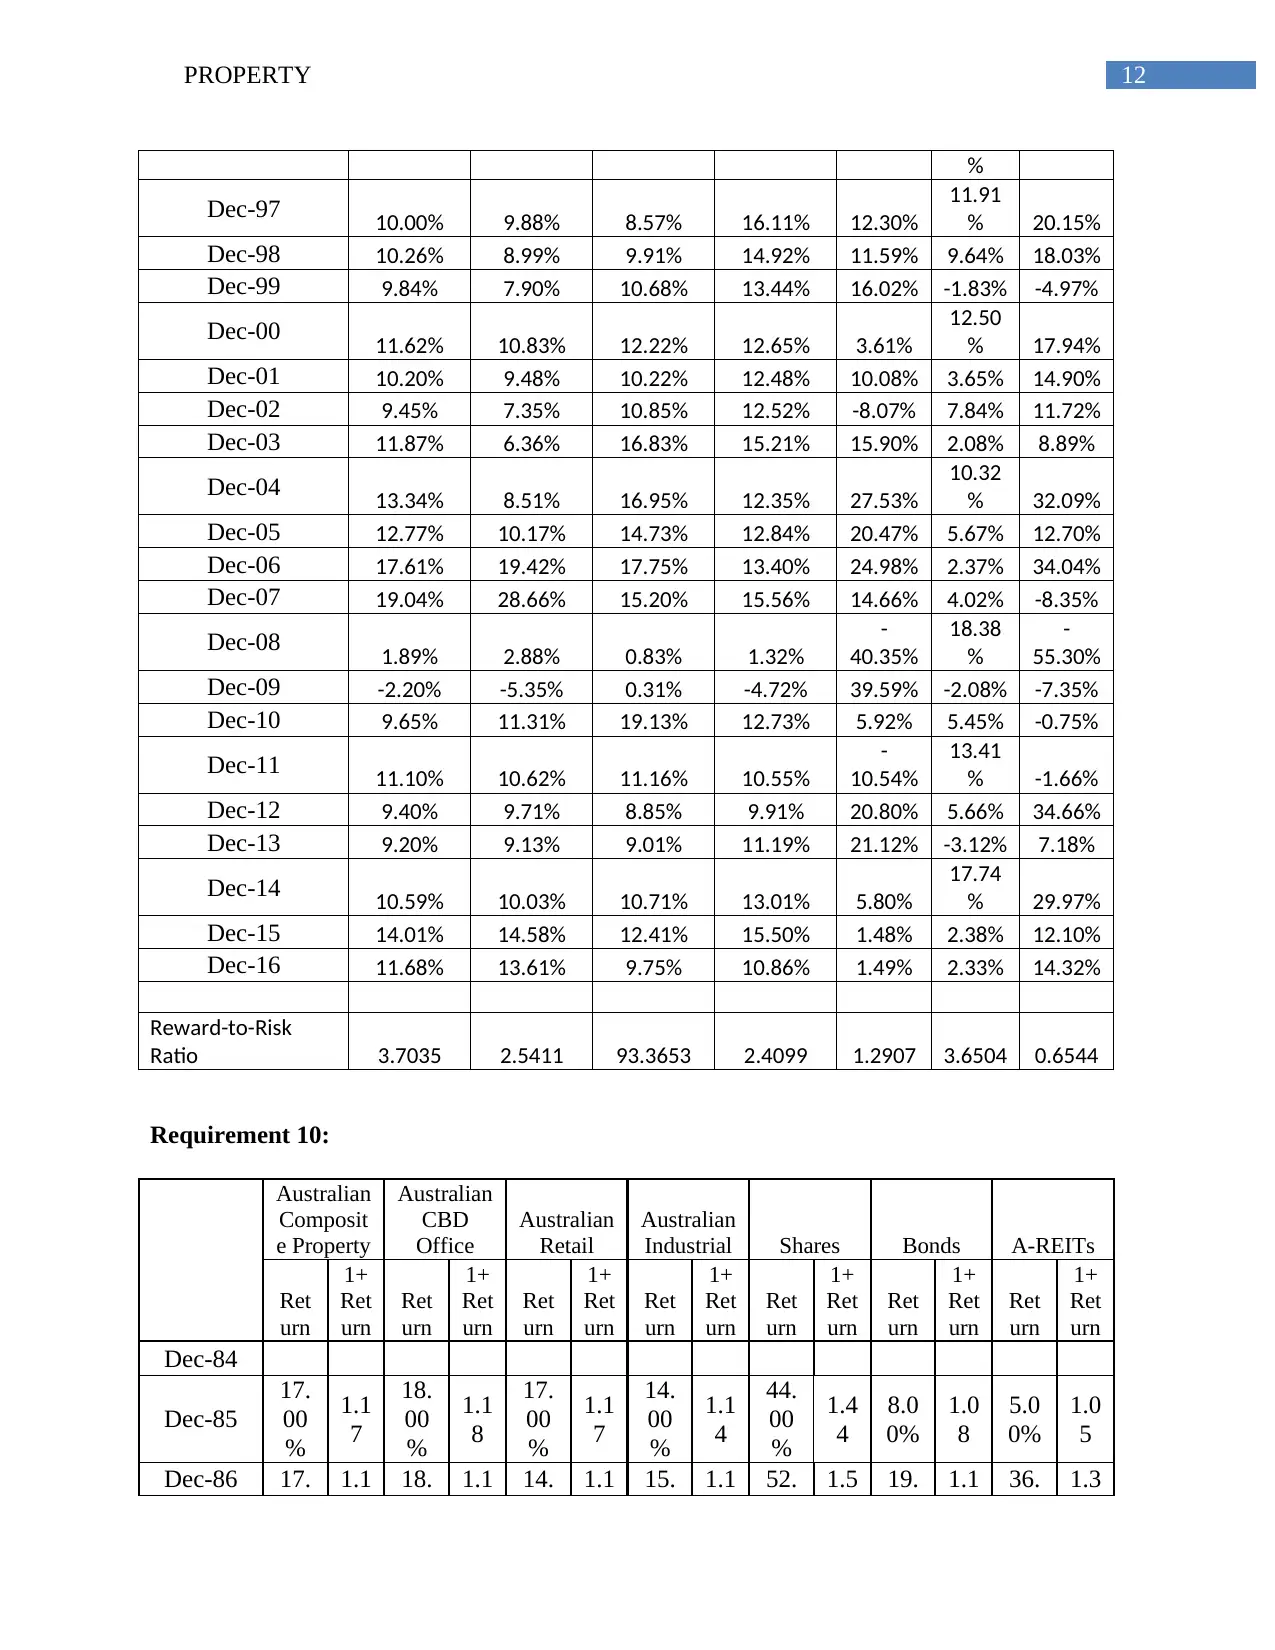
12PROPERTY
%
Dec-97 10.00% 9.88% 8.57% 16.11% 12.30%
11.91
% 20.15%
Dec-98 10.26% 8.99% 9.91% 14.92% 11.59% 9.64% 18.03%
Dec-99 9.84% 7.90% 10.68% 13.44% 16.02% -1.83% -4.97%
Dec-00 11.62% 10.83% 12.22% 12.65% 3.61%
12.50
% 17.94%
Dec-01 10.20% 9.48% 10.22% 12.48% 10.08% 3.65% 14.90%
Dec-02 9.45% 7.35% 10.85% 12.52% -8.07% 7.84% 11.72%
Dec-03 11.87% 6.36% 16.83% 15.21% 15.90% 2.08% 8.89%
Dec-04 13.34% 8.51% 16.95% 12.35% 27.53%
10.32
% 32.09%
Dec-05 12.77% 10.17% 14.73% 12.84% 20.47% 5.67% 12.70%
Dec-06 17.61% 19.42% 17.75% 13.40% 24.98% 2.37% 34.04%
Dec-07 19.04% 28.66% 15.20% 15.56% 14.66% 4.02% -8.35%
Dec-08 1.89% 2.88% 0.83% 1.32%
-
40.35%
18.38
%
-
55.30%
Dec-09 -2.20% -5.35% 0.31% -4.72% 39.59% -2.08% -7.35%
Dec-10 9.65% 11.31% 19.13% 12.73% 5.92% 5.45% -0.75%
Dec-11 11.10% 10.62% 11.16% 10.55%
-
10.54%
13.41
% -1.66%
Dec-12 9.40% 9.71% 8.85% 9.91% 20.80% 5.66% 34.66%
Dec-13 9.20% 9.13% 9.01% 11.19% 21.12% -3.12% 7.18%
Dec-14 10.59% 10.03% 10.71% 13.01% 5.80%
17.74
% 29.97%
Dec-15 14.01% 14.58% 12.41% 15.50% 1.48% 2.38% 12.10%
Dec-16 11.68% 13.61% 9.75% 10.86% 1.49% 2.33% 14.32%
Reward-to-Risk
Ratio 3.7035 2.5411 93.3653 2.4099 1.2907 3.6504 0.6544
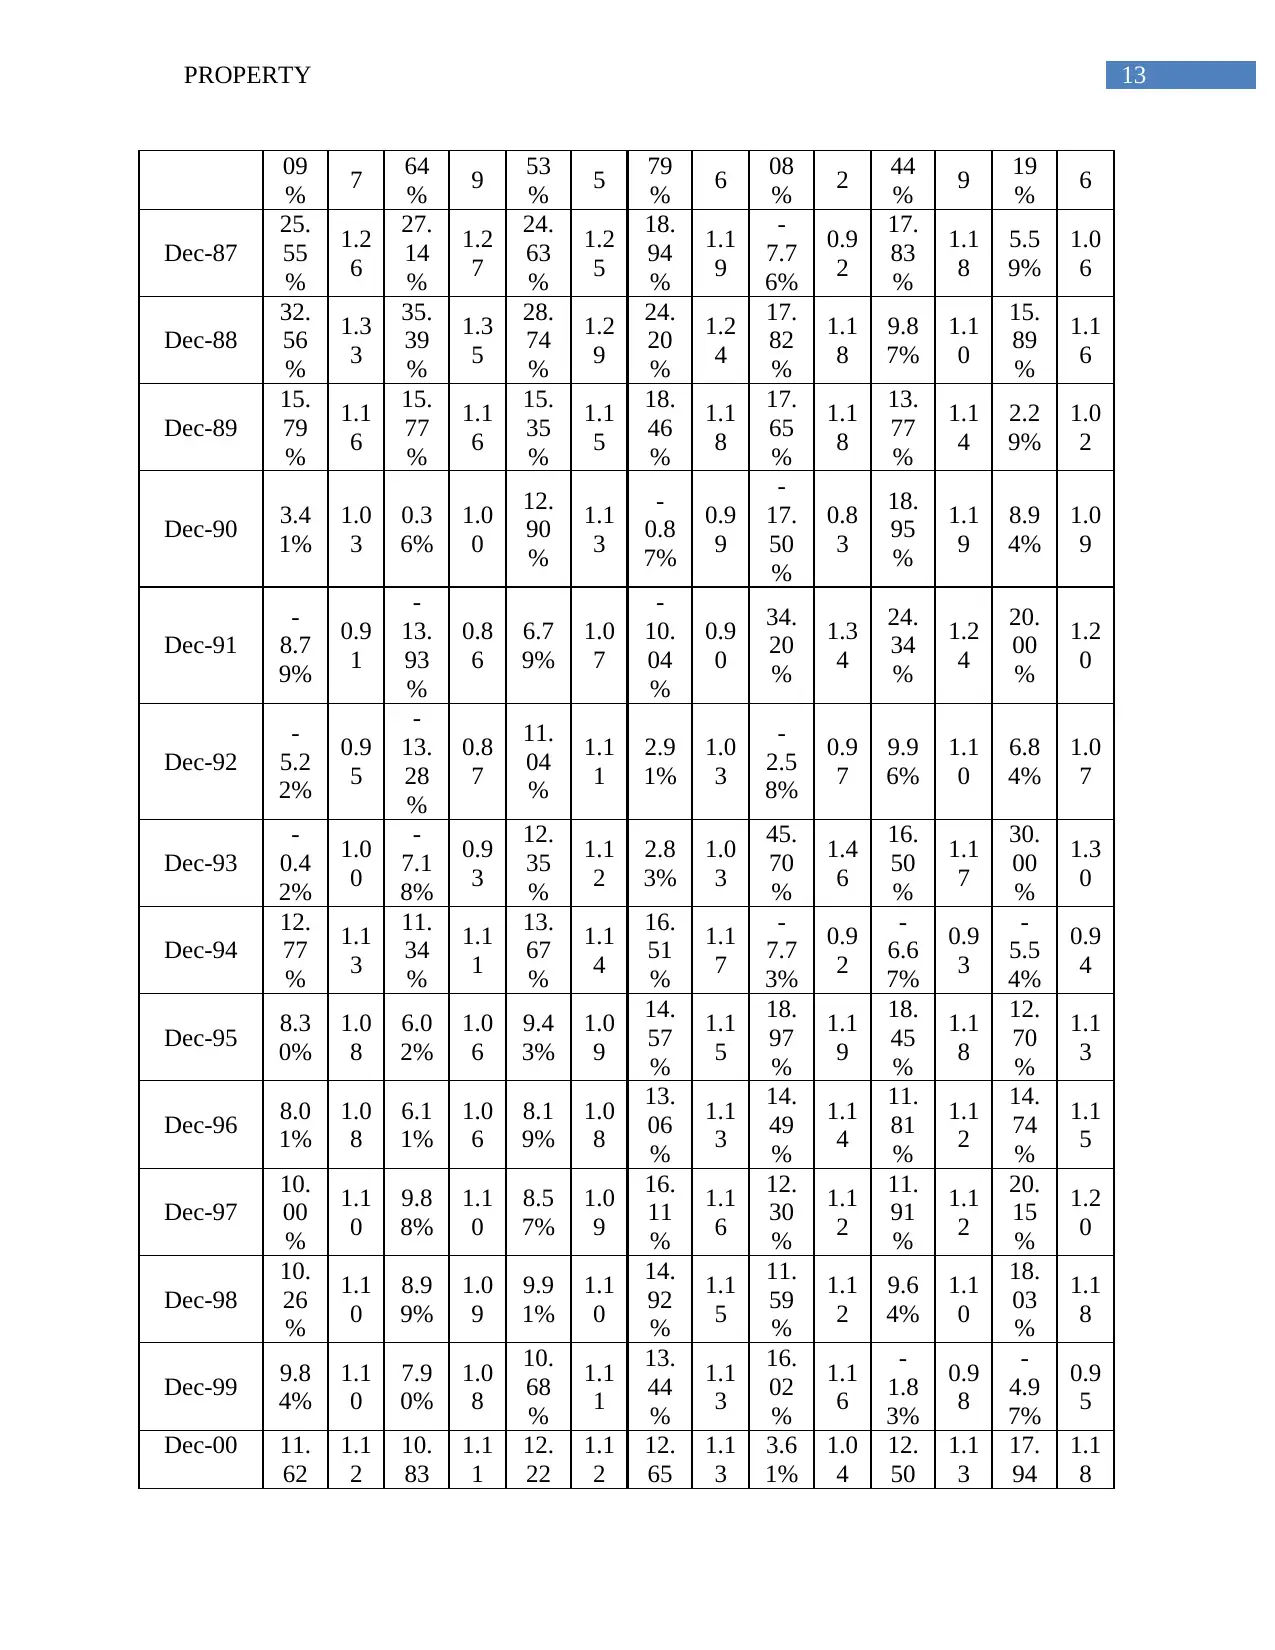
Requirement 10:
Australian
Composit
e Property
Australian
CBD
Office
Australian
Retail
Australian
Industrial Shares Bonds A-REITs
Ret
urn
1+
Ret
urn
Ret
urn
1+
Ret
urn
Ret
urn
1+
Ret
urn
Ret
urn
1+
Ret
urn
Ret
urn
1+
Ret
urn
Ret
urn
1+
Ret
urn
Ret
urn
1+
Ret
urn
Dec-84
Dec-85
17.
00
%
1.1
7
18.
00
%
1.1
8
17.
00
%
1.1
7
14.
00
%
1.1
4
44.
00
%
1.4
4
8.0
0%
1.0
8
5.0
0%
1.0
5
Dec-86 17. 1.1 18. 1.1 14. 1.1 15. 1.1 52. 1.5 19. 1.1 36. 1.3
%
Dec-97 10.00% 9.88% 8.57% 16.11% 12.30%
11.91
% 20.15%
Dec-98 10.26% 8.99% 9.91% 14.92% 11.59% 9.64% 18.03%
Dec-99 9.84% 7.90% 10.68% 13.44% 16.02% -1.83% -4.97%
Dec-00 11.62% 10.83% 12.22% 12.65% 3.61%
12.50
% 17.94%
Dec-01 10.20% 9.48% 10.22% 12.48% 10.08% 3.65% 14.90%
Dec-02 9.45% 7.35% 10.85% 12.52% -8.07% 7.84% 11.72%
Dec-03 11.87% 6.36% 16.83% 15.21% 15.90% 2.08% 8.89%
Dec-04 13.34% 8.51% 16.95% 12.35% 27.53%
10.32
% 32.09%
Dec-05 12.77% 10.17% 14.73% 12.84% 20.47% 5.67% 12.70%
Dec-06 17.61% 19.42% 17.75% 13.40% 24.98% 2.37% 34.04%
Dec-07 19.04% 28.66% 15.20% 15.56% 14.66% 4.02% -8.35%
Dec-08 1.89% 2.88% 0.83% 1.32%
-
40.35%
18.38
%
-
55.30%
Dec-09 -2.20% -5.35% 0.31% -4.72% 39.59% -2.08% -7.35%
Dec-10 9.65% 11.31% 19.13% 12.73% 5.92% 5.45% -0.75%
Dec-11 11.10% 10.62% 11.16% 10.55%
-
10.54%
13.41
% -1.66%
Dec-12 9.40% 9.71% 8.85% 9.91% 20.80% 5.66% 34.66%
Dec-13 9.20% 9.13% 9.01% 11.19% 21.12% -3.12% 7.18%
Dec-14 10.59% 10.03% 10.71% 13.01% 5.80%
17.74
% 29.97%
Dec-15 14.01% 14.58% 12.41% 15.50% 1.48% 2.38% 12.10%
Dec-16 11.68% 13.61% 9.75% 10.86% 1.49% 2.33% 14.32%
Reward-to-Risk
Ratio 3.7035 2.5411 93.3653 2.4099 1.2907 3.6504 0.6544
Requirement 10:
Australian
Composit
e Property
Australian
CBD
Office
Australian
Retail
Australian
Industrial Shares Bonds A-REITs
Ret
urn
1+
Ret
urn
Ret
urn
1+
Ret
urn
Ret
urn
1+
Ret
urn
Ret
urn
1+
Ret
urn
Ret
urn
1+
Ret
urn
Ret
urn
1+
Ret
urn
Ret
urn
1+
Ret
urn
Dec-84
Dec-85
17.
00
%
1.1
7
18.
00
%
1.1
8
17.
00
%
1.1
7
14.
00
%
1.1
4
44.
00
%
1.4
4
8.0
0%
1.0
8
5.0
0%
1.0
5
Dec-86 17. 1.1 18. 1.1 14. 1.1 15. 1.1 52. 1.5 19. 1.1 36. 1.3
Paraphrase This Document
Need a fresh take? Get an instant paraphrase of this document with our AI Paraphraser
13PROPERTY
09
% 7 64
% 9 53
% 5 79
% 6 08
% 2 44
% 9 19
% 6
Dec-87
25.
55
%
1.2
6
27.
14
%
1.2
7
24.
63
%
1.2
5
18.
94
%
1.1
9
-
7.7
6%
0.9
2
17.
83
%
1.1
8
5.5
9%
1.0
6
Dec-88
32.
56
%
1.3
3
35.
39
%
1.3
5
28.
74
%
1.2
9
24.
20
%
1.2
4
17.
82
%
1.1
8
9.8
7%
1.1
0
15.
89
%
1.1
6
Dec-89
15.
79
%
1.1
6
15.
77
%
1.1
6
15.
35
%
1.1
5
18.
46
%
1.1
8
17.
65
%
1.1
8
13.
77
%
1.1
4
2.2
9%
1.0
2
Dec-90 3.4
1%
1.0
3
0.3
6%
1.0
0
12.
90
%
1.1
3
-
0.8
7%
0.9
9
-
17.
50
%
0.8
3
18.
95
%
1.1
9
8.9
4%
1.0
9
Dec-91
-
8.7
9%
0.9
1
-
13.
93
%
0.8
6
6.7
9%
1.0
7
-
10.
04
%
0.9
0
34.
20
%
1.3
4
24.
34
%
1.2
4
20.
00
%
1.2
0
Dec-92
-
5.2
2%
0.9
5
-
13.
28
%
0.8
7
11.
04
%
1.1
1
2.9
1%
1.0
3
-
2.5
8%
0.9
7
9.9
6%
1.1
0
6.8
4%
1.0
7
Dec-93
-
0.4
2%
1.0
0
-
7.1
8%
0.9
3
12.
35
%
1.1
2
2.8
3%
1.0
3
45.
70
%
1.4
6
16.
50
%
1.1
7
30.
00
%
1.3
0
Dec-94
12.
77
%
1.1
3
11.
34
%
1.1
1
13.
67
%
1.1
4
16.
51
%
1.1
7
-
7.7
3%
0.9
2
-
6.6
7%
0.9
3
-
5.5
4%
0.9
4
Dec-95 8.3
0%
1.0
8
6.0
2%
1.0
6
9.4
3%
1.0
9
14.
57
%
1.1
5
18.
97
%
1.1
9
18.
45
%
1.1
8
12.
70
%
1.1
3
Dec-96 8.0
1%
1.0
8
6.1
1%
1.0
6
8.1
9%
1.0
8
13.
06
%
1.1
3
14.
49
%
1.1
4
11.
81
%
1.1
2
14.
74
%
1.1
5
Dec-97
10.
00
%
1.1
0
9.8
8%
1.1
0
8.5
7%
1.0
9
16.
11
%
1.1
6
12.
30
%
1.1
2
11.
91
%
1.1
2
20.
15
%
1.2
0
Dec-98
10.
26
%
1.1
0
8.9
9%
1.0
9
9.9
1%
1.1
0
14.
92
%
1.1
5
11.
59
%
1.1
2
9.6
4%
1.1
0
18.
03
%
1.1
8
Dec-99 9.8
4%
1.1
0
7.9
0%
1.0
8
10.
68
%
1.1
1
13.
44
%
1.1
3
16.
02
%
1.1
6
-
1.8
3%
0.9
8
-
4.9
7%
0.9
5
Dec-00 11.
62
1.1
2
10.
83
1.1
1
12.
22
1.1
2
12.
65
1.1
3
3.6
1%
1.0
4
12.
50
1.1
3
17.
94
1.1
8

14PROPERTY
% % % % % %
Dec-01
10.
20
%
1.1
0
9.4
8%
1.0
9
10.
22
%
1.1
0
12.
48
%
1.1
2
10.
08
%
1.1
0
3.6
5%
1.0
4
14.
90
%
1.1
5
Dec-02 9.4
5%
1.0
9
7.3
5%
1.0
7
10.
85
%
1.1
1
12.
52
%
1.1
3
-
8.0
7%
0.9
2
7.8
4%
1.0
8
11.
72
%
1.1
2
Dec-03
11.
87
%
1.1
2
6.3
6%
1.0
6
16.
83
%
1.1
7
15.
21
%
1.1
5
15.
90
%
1.1
6
2.0
8%
1.0
2
8.8
9%
1.0
9
Dec-04
13.
34
%
1.1
3
8.5
1%
1.0
9
16.
95
%
1.1
7
12.
35
%
1.1
2
27.
53
%
1.2
8
10.
32
%
1.1
0
32.
09
%
1.3
2
Dec-05
12.
77
%
1.1
3
10.
17
%
1.1
0
14.
73
%
1.1
5
12.
84
%
1.1
3
20.
47
%
1.2
0
5.6
7%
1.0
6
12.
70
%
1.1
3
Dec-06
17.
61
%
1.1
8
19.
42
%
1.1
9
17.
75
%
1.1
8
13.
40
%
1.1
3
24.
98
%
1.2
5
2.3
7%
1.0
2
34.
04
%
1.3
4
Dec-07
19.
04
%
1.1
9
28.
66
%
1.2
9
15.
20
%
1.1
5
15.
56
%
1.1
6
14.
66
%
1.1
5
4.0
2%
1.0
4
-
8.3
5%
0.9
2
Dec-08 1.8
9%
1.0
2
2.8
8%
1.0
3
0.8
3%
1.0
1
1.3
2%
1.0
1
-
40.
35
%
0.6
0
18.
38
%
1.1
8
-
55.
30
%
0.4
5
Dec-09
-
2.2
0%
0.9
8
-
5.3
5%
0.9
5
0.3
1%
1.0
0
-
4.7
2%
0.9
5
39.
59
%
1.4
0
-
2.0
8%
0.9
8
-
7.3
5%
0.9
3
Dec-10 9.6
5%
1.1
0
11.
31
%
1.1
1
19.
13
%
1.1
9
12.
73
%
1.1
3
5.9
2%
1.0
6
5.4
5%
1.0
5
-
0.7
5%
0.9
9
Dec-11
11.
10
%
1.1
1
10.
62
%
1.1
1
11.
16
%
1.1
1
10.
55
%
1.1
1
-
10.
54
%
0.8
9
13.
41
%
1.1
3
-
1.6
6%
0.9
8
Dec-12 9.4
0%
1.0
9
9.7
1%
1.1
0
8.8
5%
1.0
9
9.9
1%
1.1
0
20.
80
%
1.2
1
5.6
6%
1.0
6
34.
66
%
1.3
5
Dec-13 9.2
0%
1.0
9
9.1
3%
1.0
9
9.0
1%
1.0
9
11.
19
%
1.1
1
21.
12
%
1.2
1
-
3.1
2%
0.9
7
7.1
8%
1.0
7
Dec-14
10.
59
%
1.1
1
10.
03
%
1.1
0
10.
71
%
1.1
1
13.
01
%
1.1
3
5.8
0%
1.0
6
17.
74
%
1.1
8
29.
97
%
1.3
0
Dec-15 14. 1.1 14. 1.1 12. 1.1 15. 1.1 1.4 1.0 2.3 1.0 12. 1.1
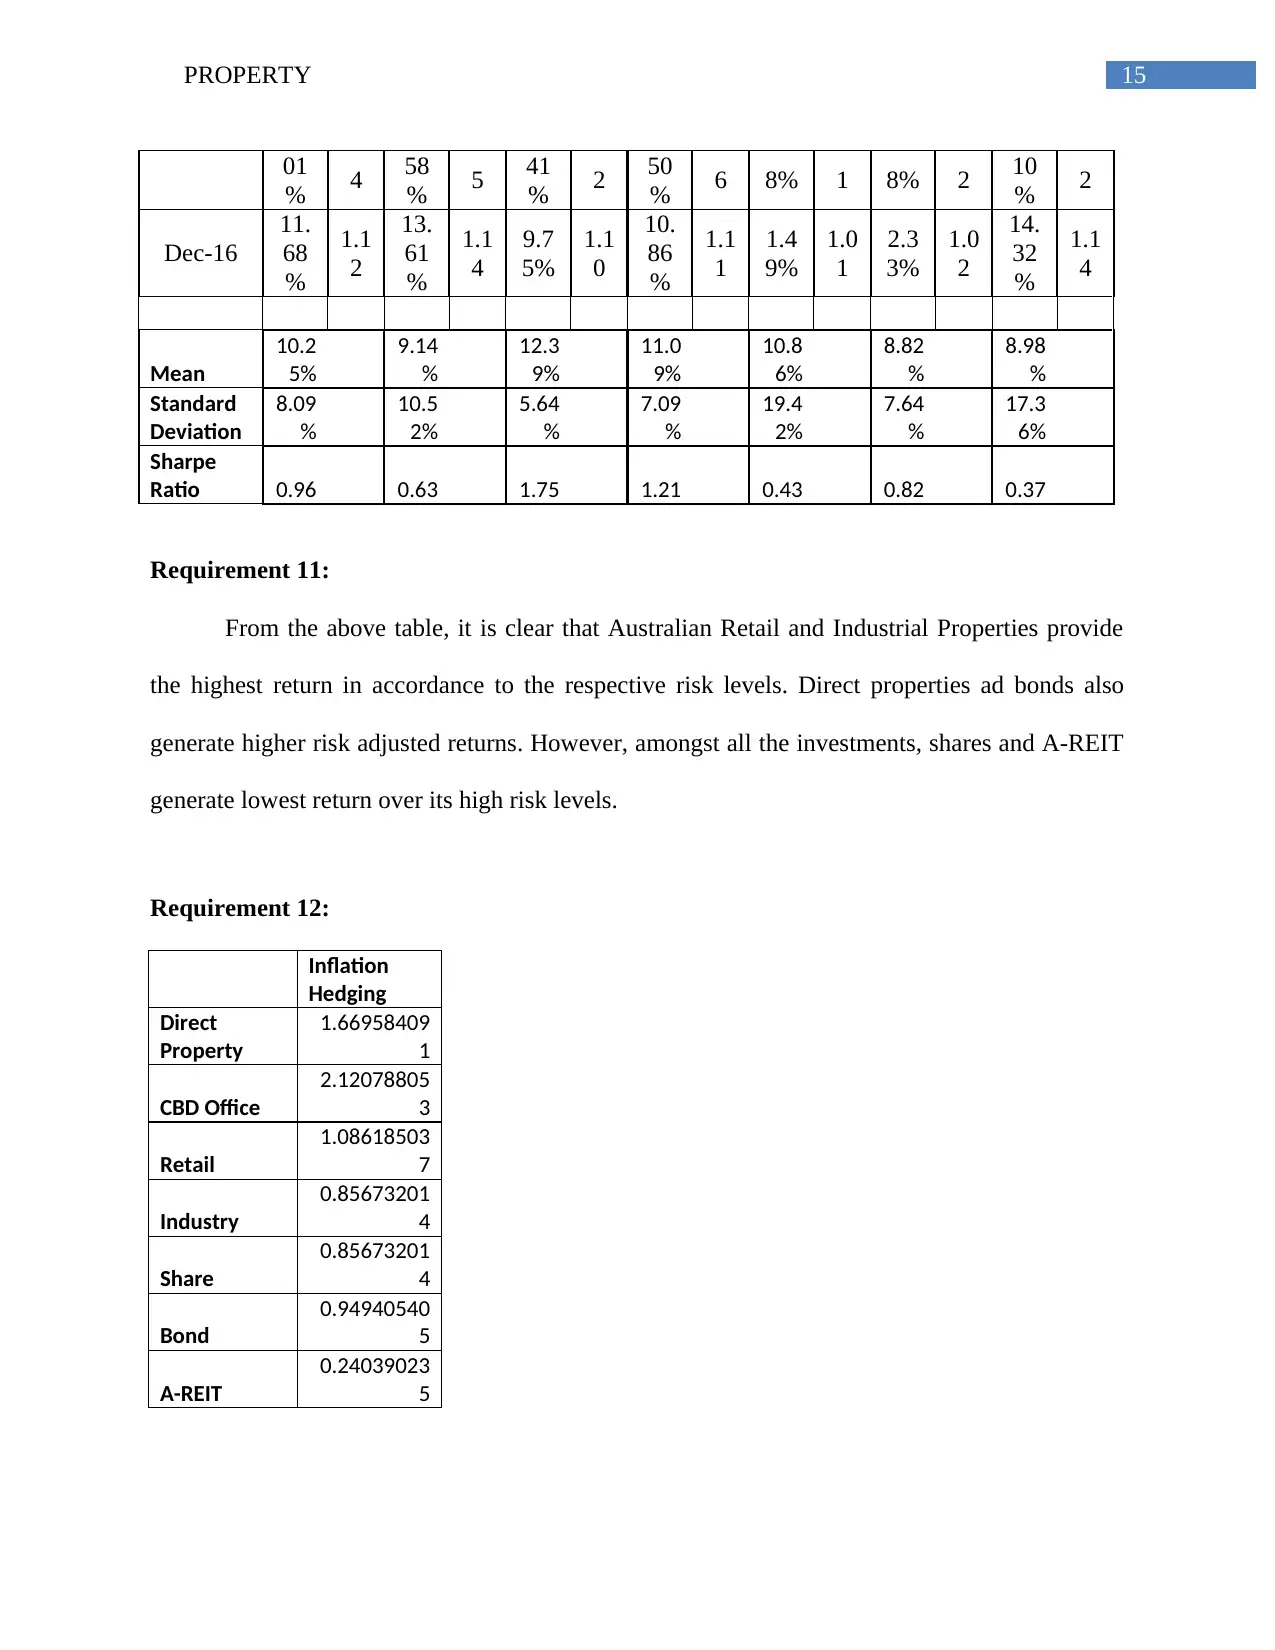
15PROPERTY
01
% 4 58
% 5 41
% 2 50
% 6 8% 1 8% 2 10
% 2
Dec-16
11.
68
%
1.1
2
13.
61
%
1.1
4
9.7
5%
1.1
0
10.
86
%
1.1
1
1.4
9%
1.0
1
2.3
3%
1.0
2
14.
32
%
1.1
4
Mean
10.2
5%
9.14
%
12.3
9%
11.0
9%
10.8
6%
8.82
%
8.98
%
Standard
Deviation
8.09
%
10.5
2%
5.64
%
7.09
%
19.4
2%
7.64
%
17.3
6%
Sharpe
Ratio 0.96 0.63 1.75 1.21 0.43 0.82 0.37
Requirement 11:
From the above table, it is clear that Australian Retail and Industrial Properties provide
the highest return in accordance to the respective risk levels. Direct properties ad bonds also
generate higher risk adjusted returns. However, amongst all the investments, shares and A-REIT
generate lowest return over its high risk levels.
Requirement 12:
Inflation
Hedging
Direct
Property
1.66958409
1
CBD Office
2.12078805
3
Retail
1.08618503
7
Industry
0.85673201
4
Share
0.85673201
4
Bond
0.94940540
5
A-REIT
0.24039023
5
Secure Best Marks with AI Grader
Need help grading? Try our AI Grader for instant feedback on your assignments.
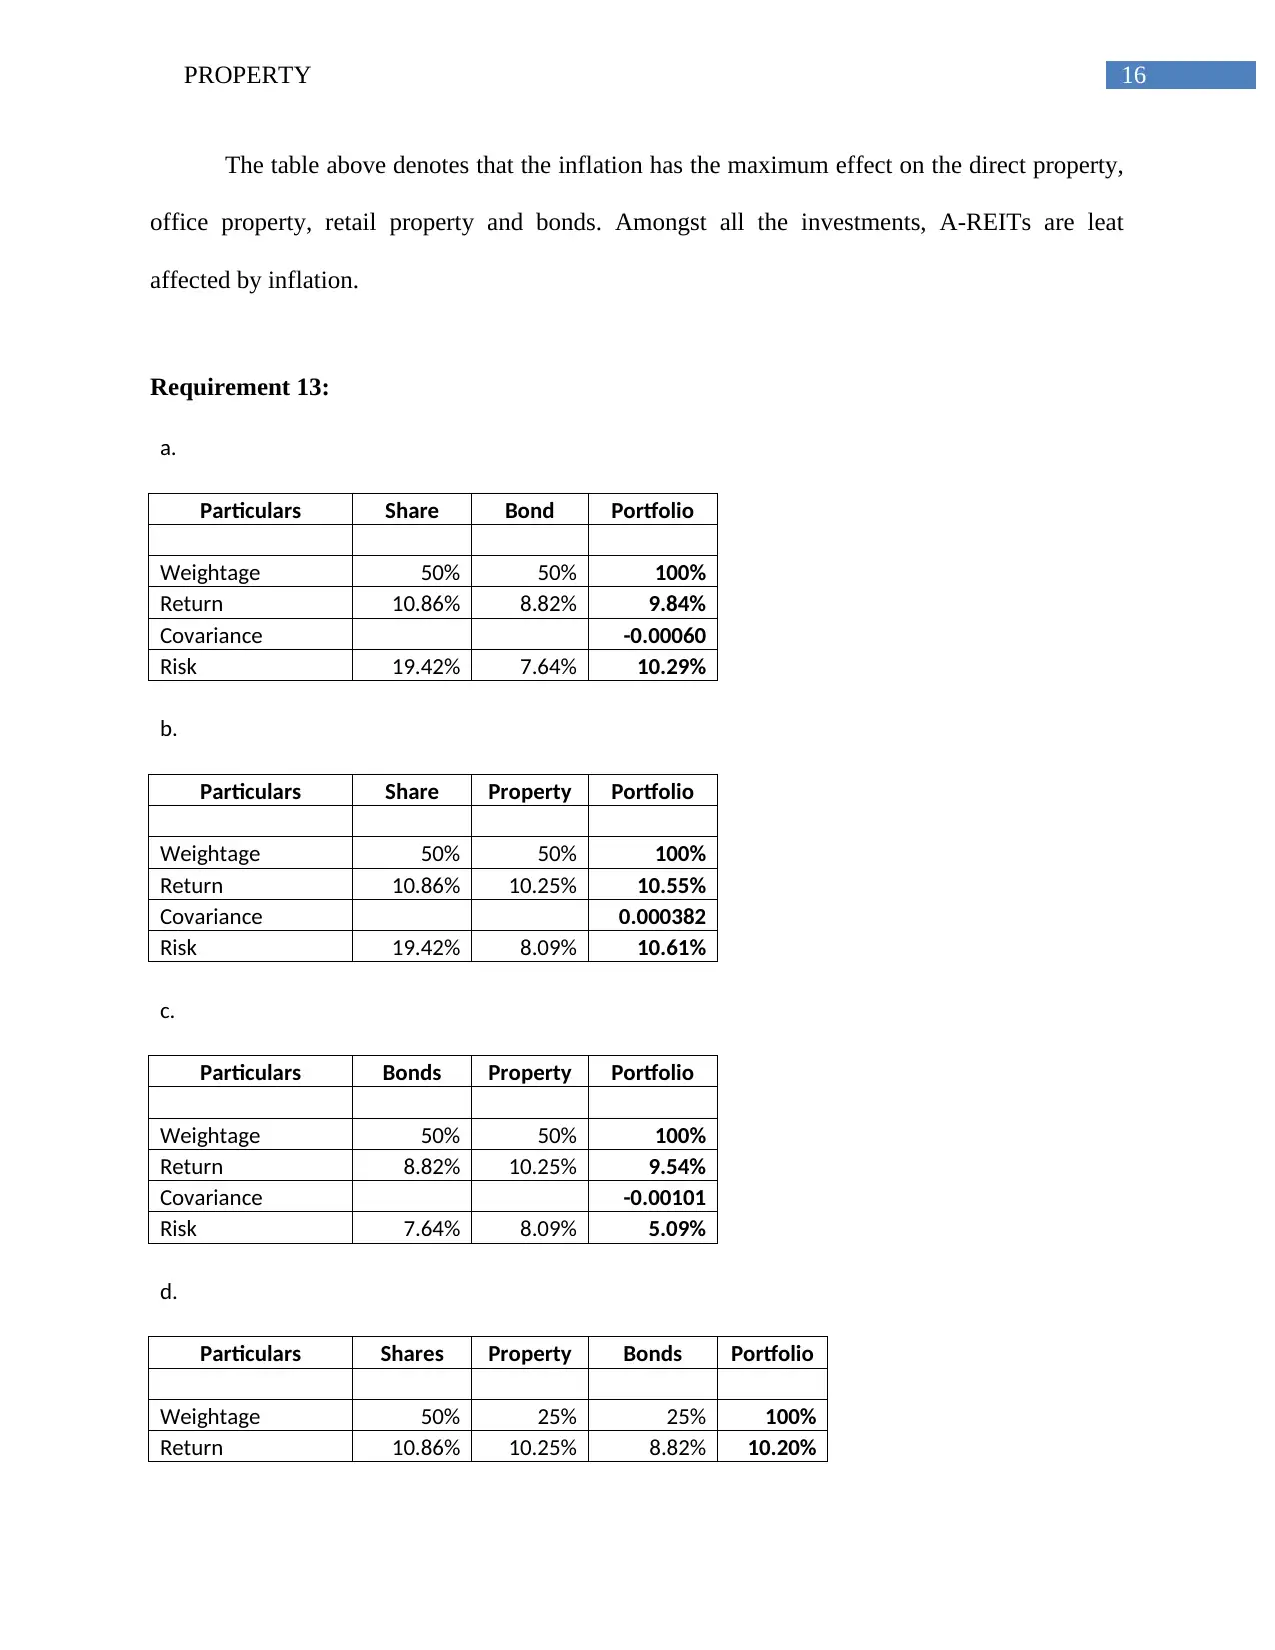
16PROPERTY
The table above denotes that the inflation has the maximum effect on the direct property,
office property, retail property and bonds. Amongst all the investments, A-REITs are leat
affected by inflation.
Requirement 13:
a.
Particulars Share Bond Portfolio
Weightage 50% 50% 100%
Return 10.86% 8.82% 9.84%
Covariance -0.00060
Risk 19.42% 7.64% 10.29%
b.
Particulars Share Property Portfolio
Weightage 50% 50% 100%
Return 10.86% 10.25% 10.55%
Covariance 0.000382
Risk 19.42% 8.09% 10.61%
c.
Particulars Bonds Property Portfolio
Weightage 50% 50% 100%
Return 8.82% 10.25% 9.54%
Covariance -0.00101
Risk 7.64% 8.09% 5.09%
d.
Particulars Shares Property Bonds Portfolio
Weightage 50% 25% 25% 100%
Return 10.86% 10.25% 8.82% 10.20%
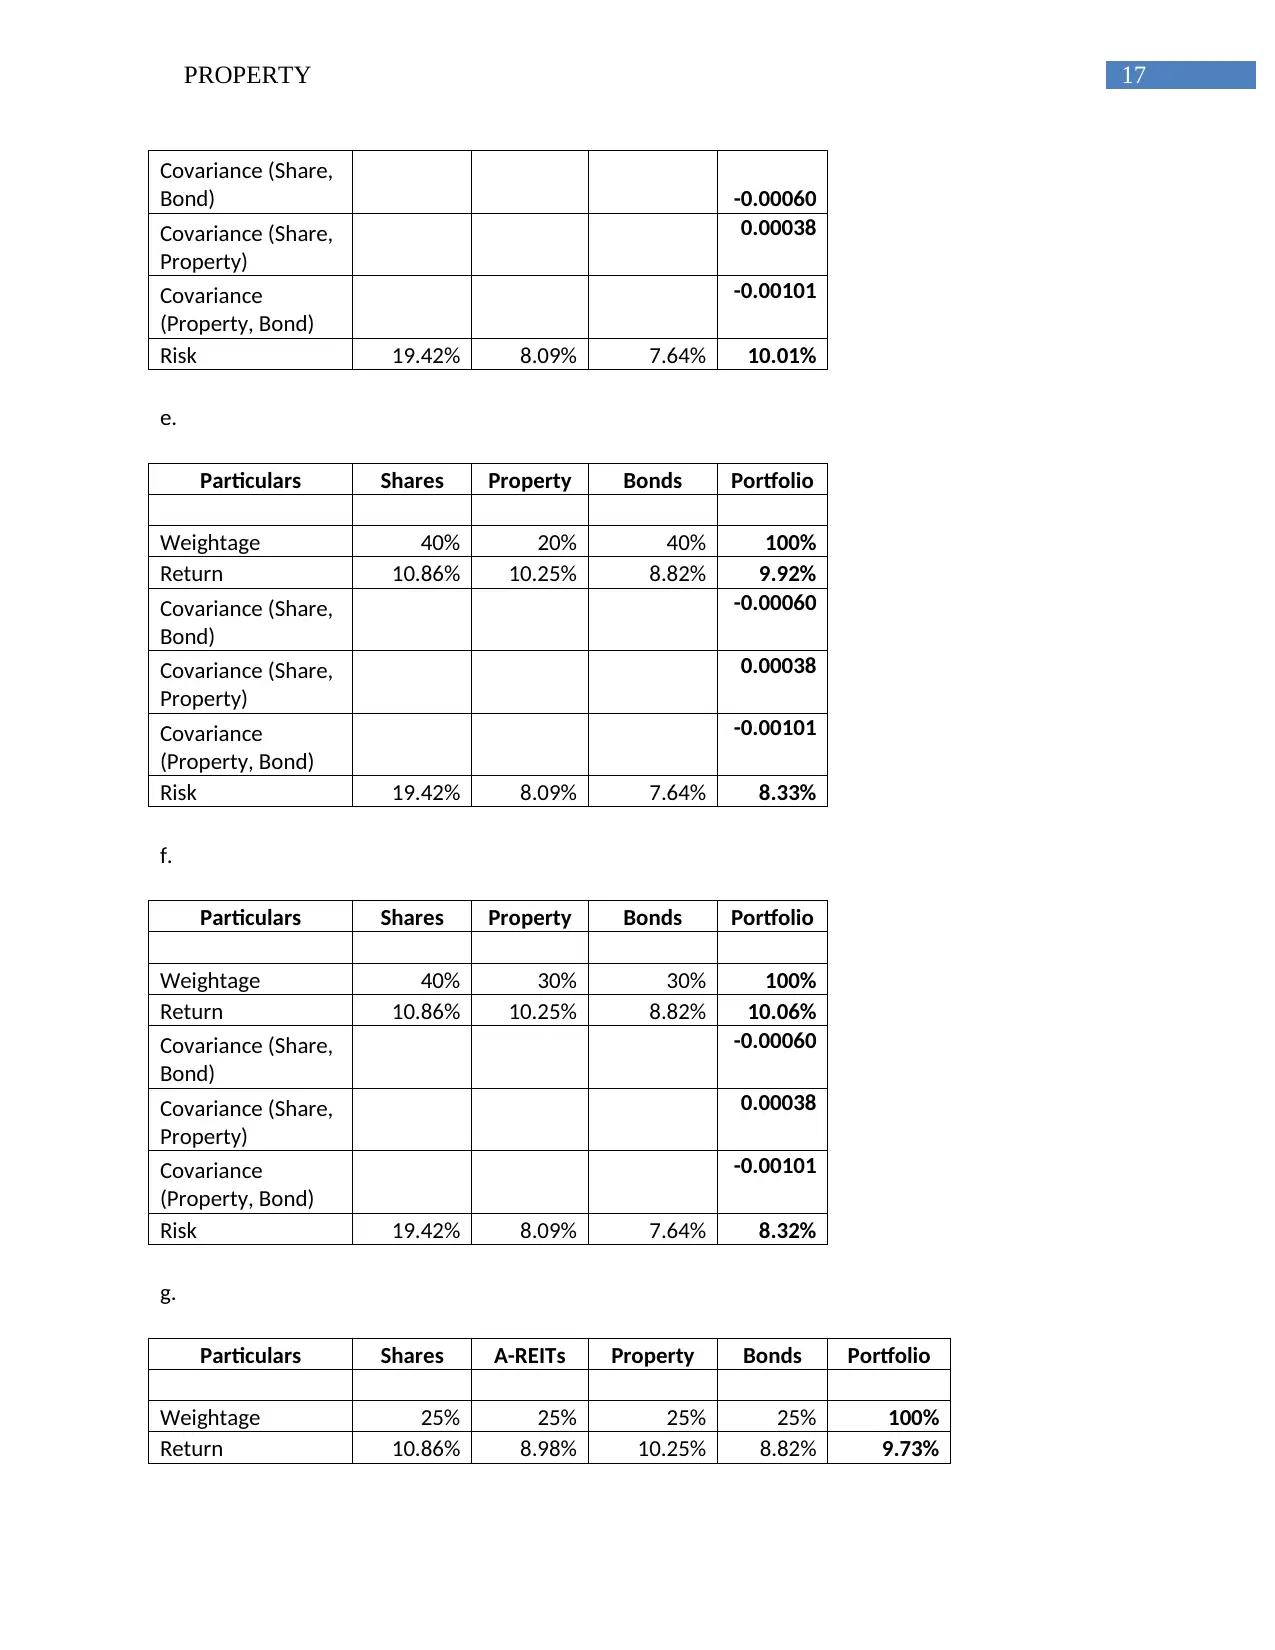
17PROPERTY
Covariance (Share,
Bond) -0.00060
Covariance (Share,
Property)
0.00038
Covariance
(Property, Bond)
-0.00101
Risk 19.42% 8.09% 7.64% 10.01%
e.
Particulars Shares Property Bonds Portfolio
Weightage 40% 20% 40% 100%
Return 10.86% 10.25% 8.82% 9.92%
Covariance (Share,
Bond)
-0.00060
Covariance (Share,
Property)
0.00038
Covariance
(Property, Bond)
-0.00101
Risk 19.42% 8.09% 7.64% 8.33%
f.
Particulars Shares Property Bonds Portfolio
Weightage 40% 30% 30% 100%
Return 10.86% 10.25% 8.82% 10.06%
Covariance (Share,
Bond)
-0.00060
Covariance (Share,
Property)
0.00038
Covariance
(Property, Bond)
-0.00101
Risk 19.42% 8.09% 7.64% 8.32%
g.
Particulars Shares A-REITs Property Bonds Portfolio
Weightage 25% 25% 25% 25% 100%
Return 10.86% 8.98% 10.25% 8.82% 9.73%
Covariance (Share,
Bond) -0.00060
Covariance (Share,
Property)
0.00038
Covariance
(Property, Bond)
-0.00101
Risk 19.42% 8.09% 7.64% 10.01%
e.
Particulars Shares Property Bonds Portfolio
Weightage 40% 20% 40% 100%
Return 10.86% 10.25% 8.82% 9.92%
Covariance (Share,
Bond)
-0.00060
Covariance (Share,
Property)
0.00038
Covariance
(Property, Bond)
-0.00101
Risk 19.42% 8.09% 7.64% 8.33%
f.
Particulars Shares Property Bonds Portfolio
Weightage 40% 30% 30% 100%
Return 10.86% 10.25% 8.82% 10.06%
Covariance (Share,
Bond)
-0.00060
Covariance (Share,
Property)
0.00038
Covariance
(Property, Bond)
-0.00101
Risk 19.42% 8.09% 7.64% 8.32%
g.
Particulars Shares A-REITs Property Bonds Portfolio
Weightage 25% 25% 25% 25% 100%
Return 10.86% 8.98% 10.25% 8.82% 9.73%
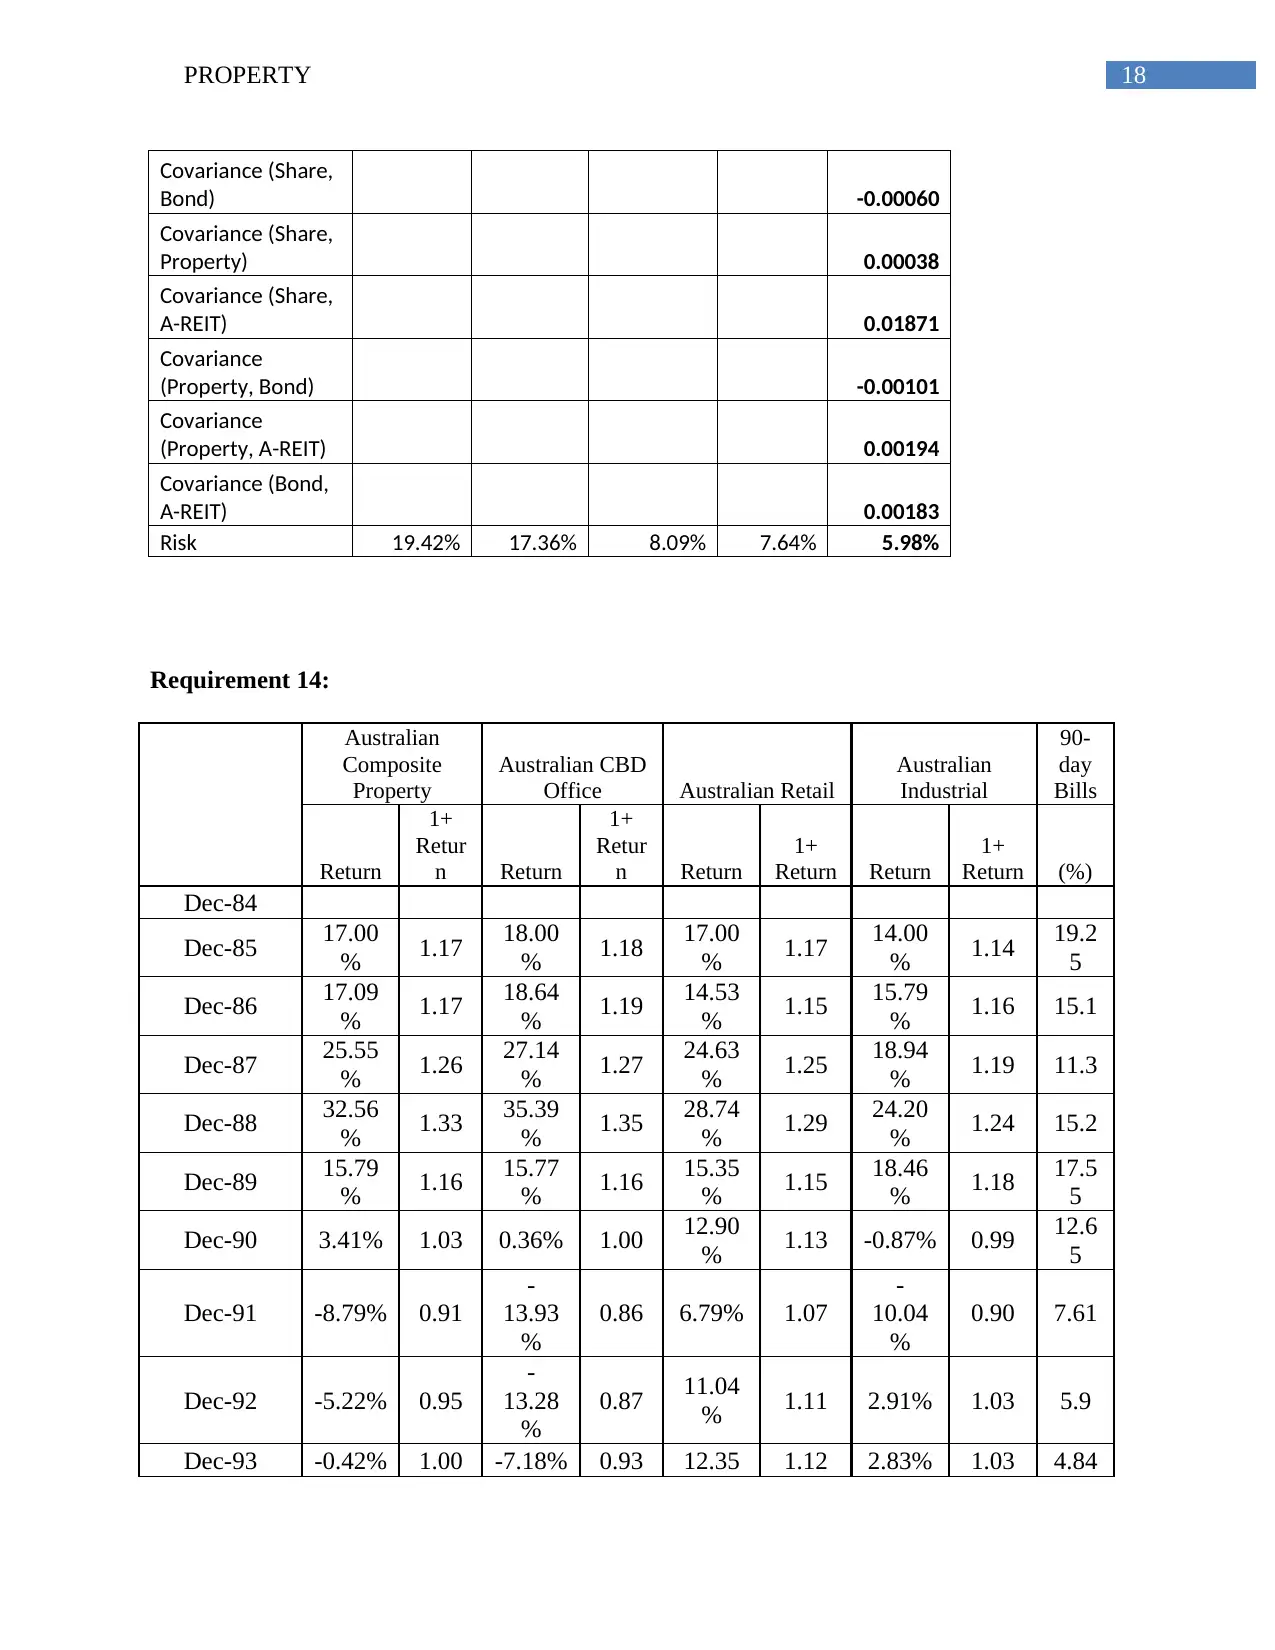
18PROPERTY
Covariance (Share,
Bond) -0.00060
Covariance (Share,
Property) 0.00038
Covariance (Share,
A-REIT) 0.01871
Covariance
(Property, Bond) -0.00101
Covariance
(Property, A-REIT) 0.00194
Covariance (Bond,
A-REIT) 0.00183
Risk 19.42% 17.36% 8.09% 7.64% 5.98%
Requirement 14:
Australian
Composite
Property
Australian CBD
Office Australian Retail
Australian
Industrial
90-
day
Bills
Return
1+
Retur
n Return
1+
Retur
n Return
1+
Return Return
1+
Return (%)
Dec-84
Dec-85 17.00
% 1.17 18.00
% 1.18 17.00
% 1.17 14.00
% 1.14 19.2
5
Dec-86 17.09
% 1.17 18.64
% 1.19 14.53
% 1.15 15.79
% 1.16 15.1
Dec-87 25.55
% 1.26 27.14
% 1.27 24.63
% 1.25 18.94
% 1.19 11.3
Dec-88 32.56
% 1.33 35.39
% 1.35 28.74
% 1.29 24.20
% 1.24 15.2
Dec-89 15.79
% 1.16 15.77
% 1.16 15.35
% 1.15 18.46
% 1.18 17.5
5
Dec-90 3.41% 1.03 0.36% 1.00 12.90
% 1.13 -0.87% 0.99 12.6
5
Dec-91 -8.79% 0.91
-
13.93
%
0.86 6.79% 1.07
-
10.04
%
0.90 7.61
Dec-92 -5.22% 0.95
-
13.28
%
0.87 11.04
% 1.11 2.91% 1.03 5.9
Dec-93 -0.42% 1.00 -7.18% 0.93 12.35 1.12 2.83% 1.03 4.84
Covariance (Share,
Bond) -0.00060
Covariance (Share,
Property) 0.00038
Covariance (Share,
A-REIT) 0.01871
Covariance
(Property, Bond) -0.00101
Covariance
(Property, A-REIT) 0.00194
Covariance (Bond,
A-REIT) 0.00183
Risk 19.42% 17.36% 8.09% 7.64% 5.98%
Requirement 14:
Australian
Composite
Property
Australian CBD
Office Australian Retail
Australian
Industrial
90-
day
Bills
Return
1+
Retur
n Return
1+
Retur
n Return
1+
Return Return
1+
Return (%)
Dec-84
Dec-85 17.00
% 1.17 18.00
% 1.18 17.00
% 1.17 14.00
% 1.14 19.2
5
Dec-86 17.09
% 1.17 18.64
% 1.19 14.53
% 1.15 15.79
% 1.16 15.1
Dec-87 25.55
% 1.26 27.14
% 1.27 24.63
% 1.25 18.94
% 1.19 11.3
Dec-88 32.56
% 1.33 35.39
% 1.35 28.74
% 1.29 24.20
% 1.24 15.2
Dec-89 15.79
% 1.16 15.77
% 1.16 15.35
% 1.15 18.46
% 1.18 17.5
5
Dec-90 3.41% 1.03 0.36% 1.00 12.90
% 1.13 -0.87% 0.99 12.6
5
Dec-91 -8.79% 0.91
-
13.93
%
0.86 6.79% 1.07
-
10.04
%
0.90 7.61
Dec-92 -5.22% 0.95
-
13.28
%
0.87 11.04
% 1.11 2.91% 1.03 5.9
Dec-93 -0.42% 1.00 -7.18% 0.93 12.35 1.12 2.83% 1.03 4.84
Paraphrase This Document
Need a fresh take? Get an instant paraphrase of this document with our AI Paraphraser
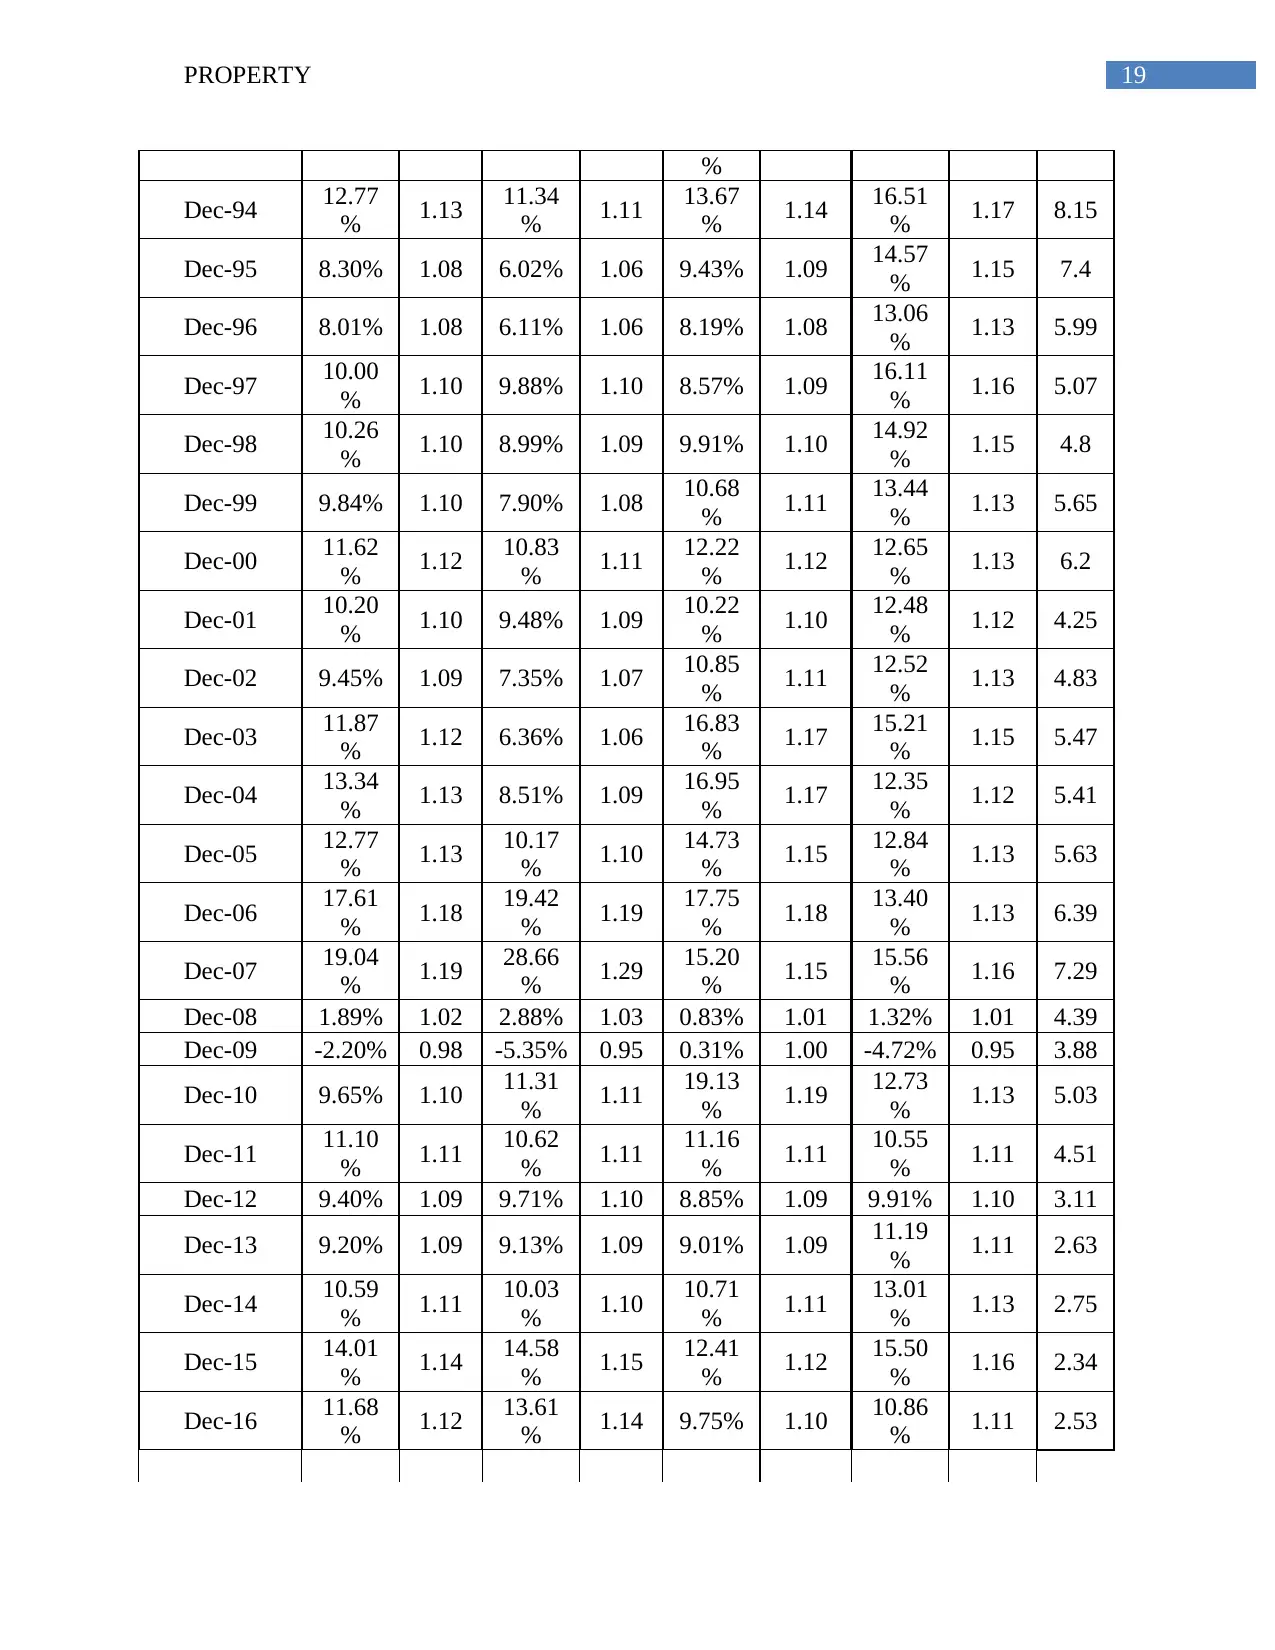
19PROPERTY
%
Dec-94 12.77
% 1.13 11.34
% 1.11 13.67
% 1.14 16.51
% 1.17 8.15
Dec-95 8.30% 1.08 6.02% 1.06 9.43% 1.09 14.57
% 1.15 7.4
Dec-96 8.01% 1.08 6.11% 1.06 8.19% 1.08 13.06
% 1.13 5.99
Dec-97 10.00
% 1.10 9.88% 1.10 8.57% 1.09 16.11
% 1.16 5.07
Dec-98 10.26
% 1.10 8.99% 1.09 9.91% 1.10 14.92
% 1.15 4.8
Dec-99 9.84% 1.10 7.90% 1.08 10.68
% 1.11 13.44
% 1.13 5.65
Dec-00 11.62
% 1.12 10.83
% 1.11 12.22
% 1.12 12.65
% 1.13 6.2
Dec-01 10.20
% 1.10 9.48% 1.09 10.22
% 1.10 12.48
% 1.12 4.25
Dec-02 9.45% 1.09 7.35% 1.07 10.85
% 1.11 12.52
% 1.13 4.83
Dec-03 11.87
% 1.12 6.36% 1.06 16.83
% 1.17 15.21
% 1.15 5.47
Dec-04 13.34
% 1.13 8.51% 1.09 16.95
% 1.17 12.35
% 1.12 5.41
Dec-05 12.77
% 1.13 10.17
% 1.10 14.73
% 1.15 12.84
% 1.13 5.63
Dec-06 17.61
% 1.18 19.42
% 1.19 17.75
% 1.18 13.40
% 1.13 6.39
Dec-07 19.04
% 1.19 28.66
% 1.29 15.20
% 1.15 15.56
% 1.16 7.29
Dec-08 1.89% 1.02 2.88% 1.03 0.83% 1.01 1.32% 1.01 4.39
Dec-09 -2.20% 0.98 -5.35% 0.95 0.31% 1.00 -4.72% 0.95 3.88
Dec-10 9.65% 1.10 11.31
% 1.11 19.13
% 1.19 12.73
% 1.13 5.03
Dec-11 11.10
% 1.11 10.62
% 1.11 11.16
% 1.11 10.55
% 1.11 4.51
Dec-12 9.40% 1.09 9.71% 1.10 8.85% 1.09 9.91% 1.10 3.11
Dec-13 9.20% 1.09 9.13% 1.09 9.01% 1.09 11.19
% 1.11 2.63
Dec-14 10.59
% 1.11 10.03
% 1.10 10.71
% 1.11 13.01
% 1.13 2.75
Dec-15 14.01
% 1.14 14.58
% 1.15 12.41
% 1.12 15.50
% 1.16 2.34
Dec-16 11.68
% 1.12 13.61
% 1.14 9.75% 1.10 10.86
% 1.11 2.53
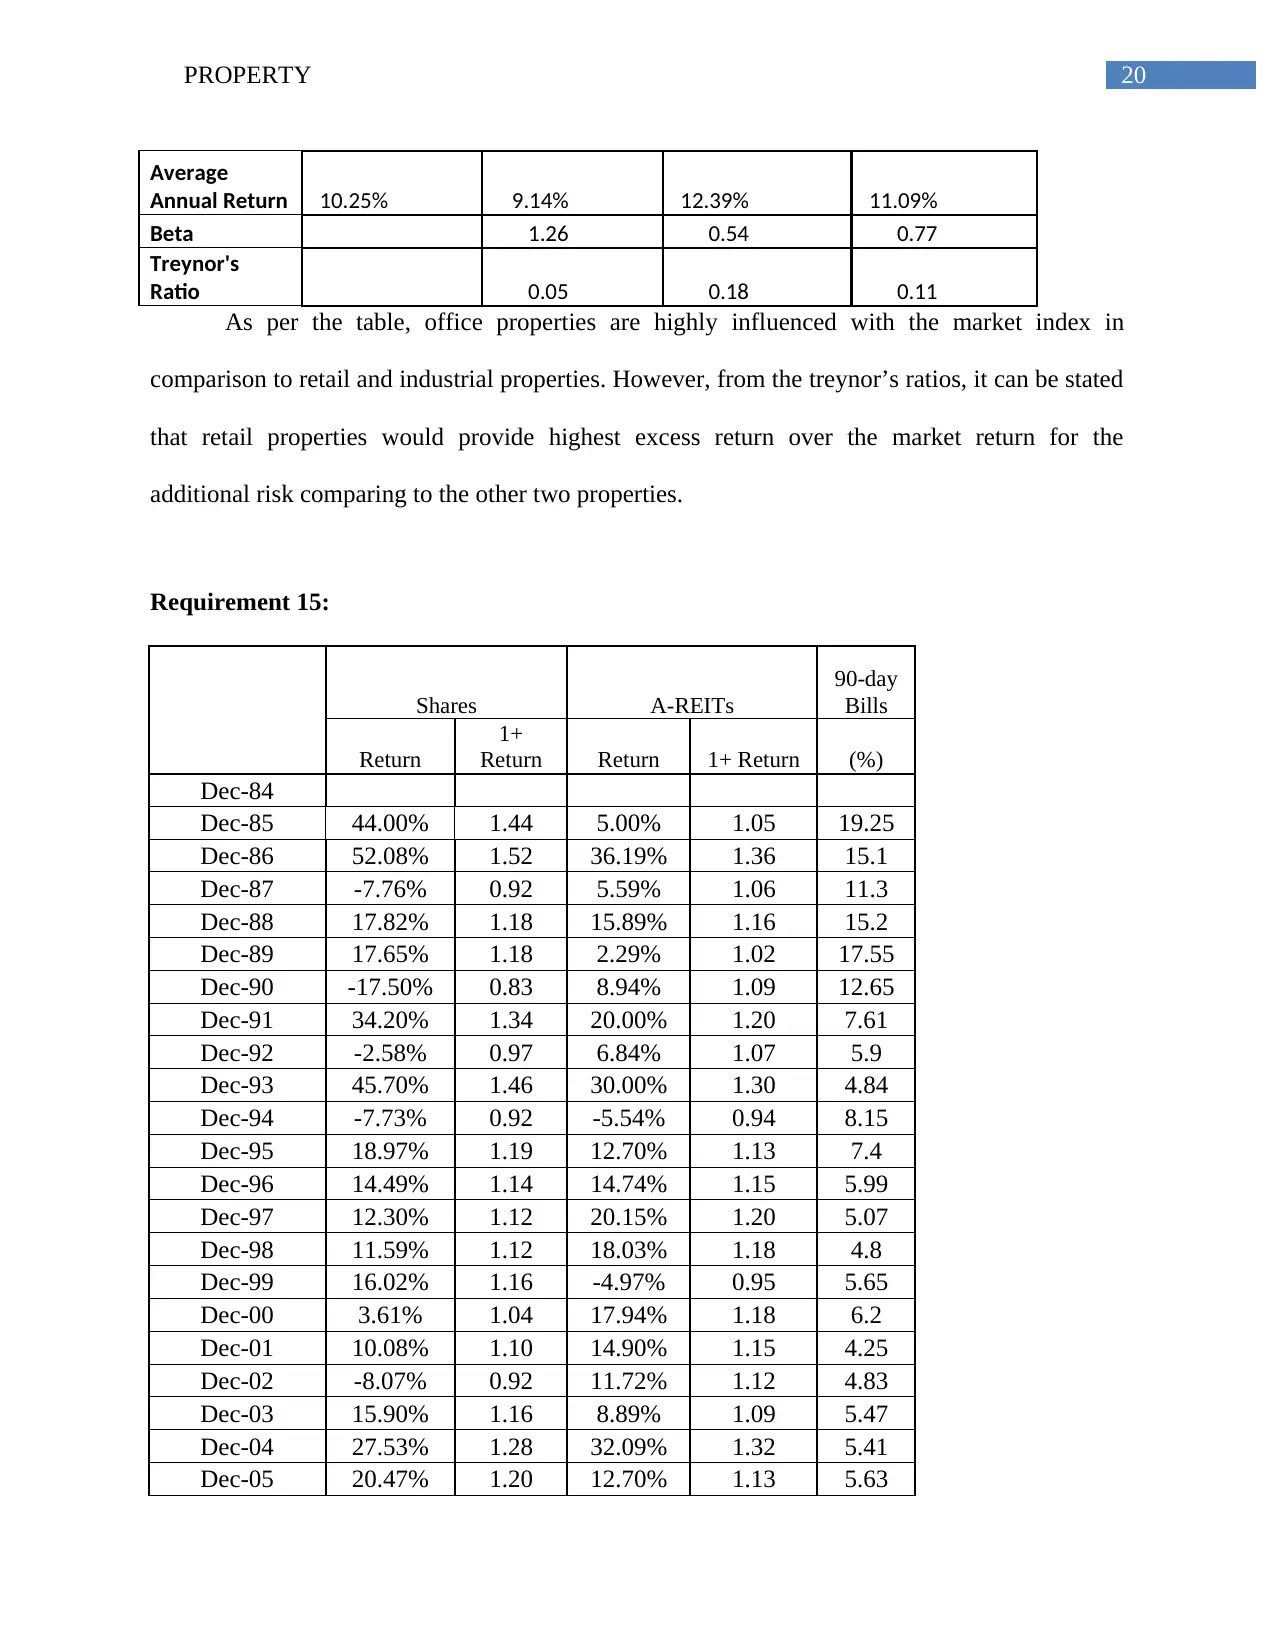
20PROPERTY
Average
Annual Return 10.25% 9.14% 12.39% 11.09%
Beta 1.26 0.54 0.77
Treynor's
Ratio 0.05 0.18 0.11
As per the table, office properties are highly influenced with the market index in
comparison to retail and industrial properties. However, from the treynor’s ratios, it can be stated
that retail properties would provide highest excess return over the market return for the
additional risk comparing to the other two properties.
Requirement 15:
Shares A-REITs
90-day
Bills
Return
1+
Return Return 1+ Return (%)
Dec-84
Dec-85 44.00% 1.44 5.00% 1.05 19.25
Dec-86 52.08% 1.52 36.19% 1.36 15.1
Dec-87 -7.76% 0.92 5.59% 1.06 11.3
Dec-88 17.82% 1.18 15.89% 1.16 15.2
Dec-89 17.65% 1.18 2.29% 1.02 17.55
Dec-90 -17.50% 0.83 8.94% 1.09 12.65
Dec-91 34.20% 1.34 20.00% 1.20 7.61
Dec-92 -2.58% 0.97 6.84% 1.07 5.9
Dec-93 45.70% 1.46 30.00% 1.30 4.84
Dec-94 -7.73% 0.92 -5.54% 0.94 8.15
Dec-95 18.97% 1.19 12.70% 1.13 7.4
Dec-96 14.49% 1.14 14.74% 1.15 5.99
Dec-97 12.30% 1.12 20.15% 1.20 5.07
Dec-98 11.59% 1.12 18.03% 1.18 4.8
Dec-99 16.02% 1.16 -4.97% 0.95 5.65
Dec-00 3.61% 1.04 17.94% 1.18 6.2
Dec-01 10.08% 1.10 14.90% 1.15 4.25
Dec-02 -8.07% 0.92 11.72% 1.12 4.83
Dec-03 15.90% 1.16 8.89% 1.09 5.47
Dec-04 27.53% 1.28 32.09% 1.32 5.41
Dec-05 20.47% 1.20 12.70% 1.13 5.63
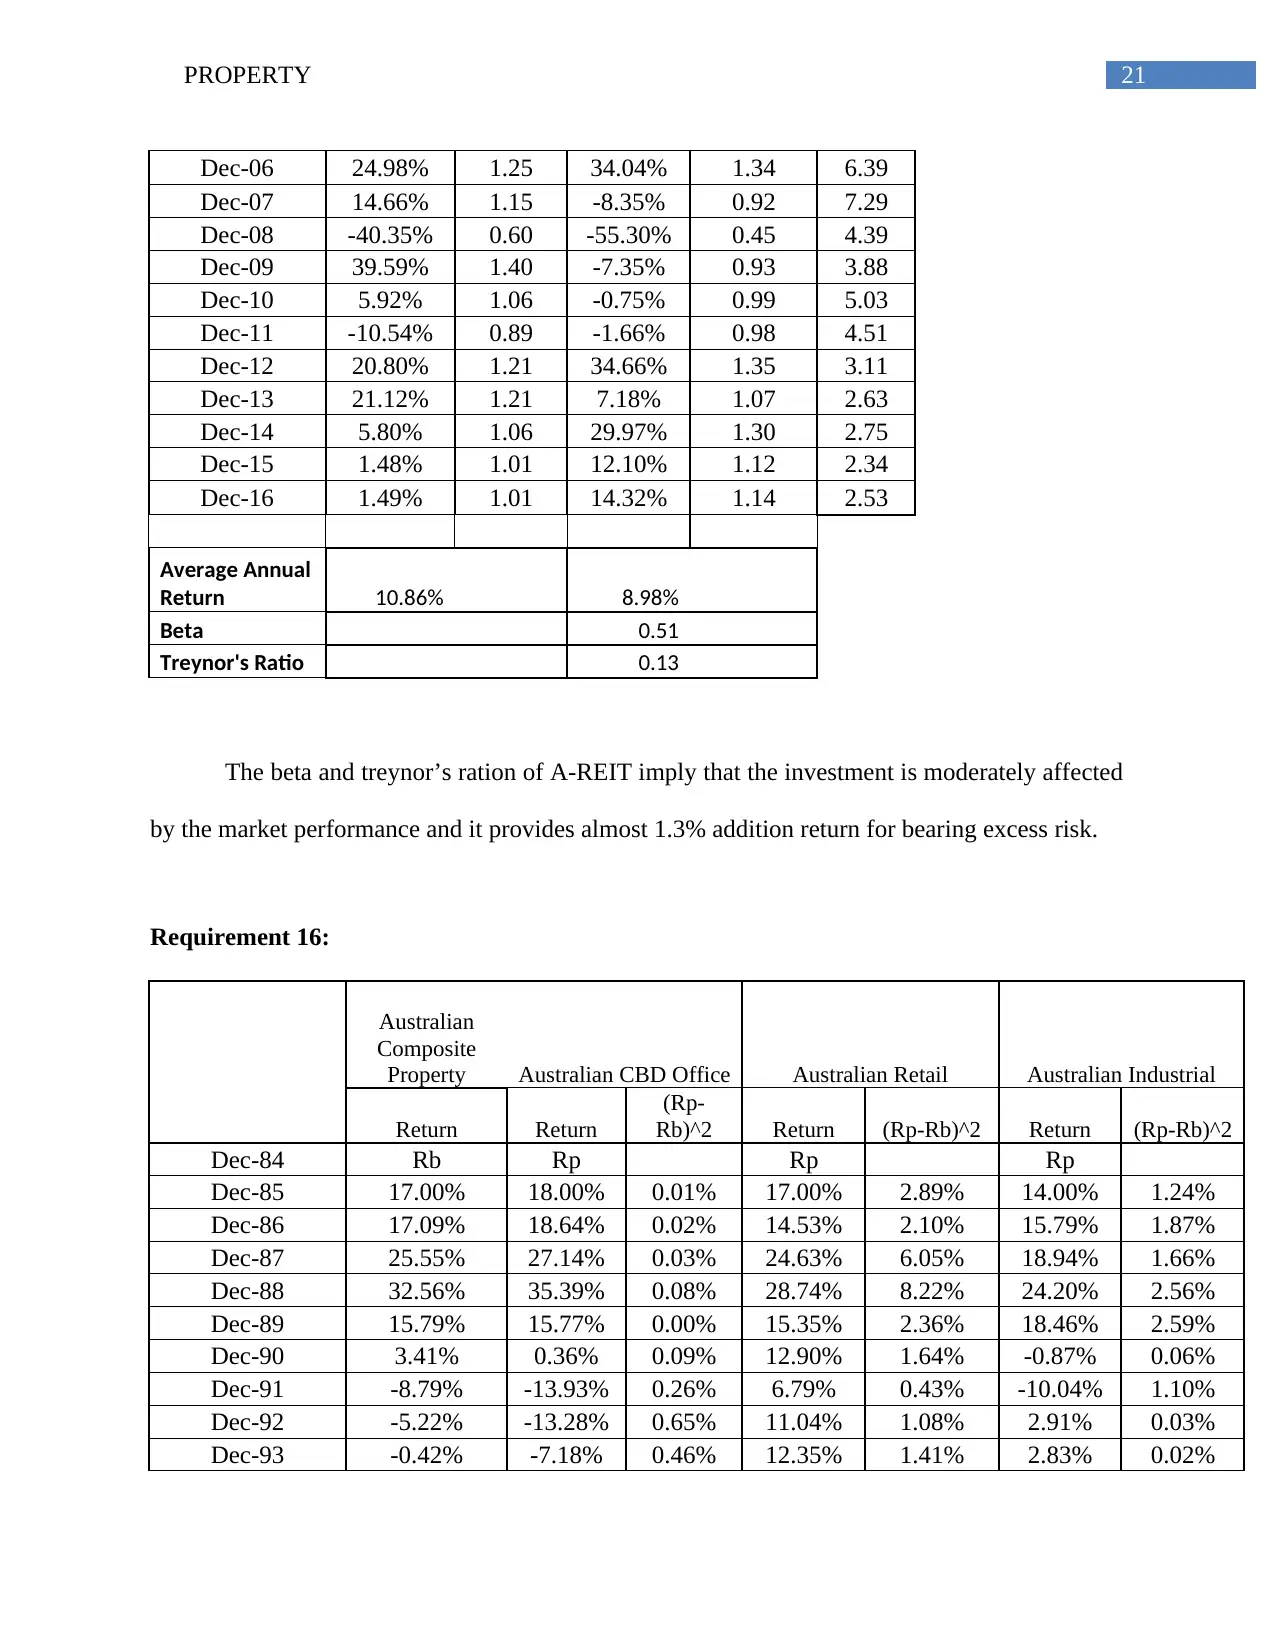
21PROPERTY
Dec-06 24.98% 1.25 34.04% 1.34 6.39
Dec-07 14.66% 1.15 -8.35% 0.92 7.29
Dec-08 -40.35% 0.60 -55.30% 0.45 4.39
Dec-09 39.59% 1.40 -7.35% 0.93 3.88
Dec-10 5.92% 1.06 -0.75% 0.99 5.03
Dec-11 -10.54% 0.89 -1.66% 0.98 4.51
Dec-12 20.80% 1.21 34.66% 1.35 3.11
Dec-13 21.12% 1.21 7.18% 1.07 2.63
Dec-14 5.80% 1.06 29.97% 1.30 2.75
Dec-15 1.48% 1.01 12.10% 1.12 2.34
Dec-16 1.49% 1.01 14.32% 1.14 2.53
Average Annual
Return 10.86% 8.98%
Beta 0.51
Treynor's Ratio 0.13
The beta and treynor’s ration of A-REIT imply that the investment is moderately affected
by the market performance and it provides almost 1.3% addition return for bearing excess risk.
Requirement 16:
Australian
Composite
Property Australian CBD Office Australian Retail Australian Industrial
Return Return
(Rp-
Rb)^2 Return (Rp-Rb)^2 Return (Rp-Rb)^2
Dec-84 Rb Rp Rp Rp
Dec-85 17.00% 18.00% 0.01% 17.00% 2.89% 14.00% 1.24%
Dec-86 17.09% 18.64% 0.02% 14.53% 2.10% 15.79% 1.87%
Dec-87 25.55% 27.14% 0.03% 24.63% 6.05% 18.94% 1.66%
Dec-88 32.56% 35.39% 0.08% 28.74% 8.22% 24.20% 2.56%
Dec-89 15.79% 15.77% 0.00% 15.35% 2.36% 18.46% 2.59%
Dec-90 3.41% 0.36% 0.09% 12.90% 1.64% -0.87% 0.06%
Dec-91 -8.79% -13.93% 0.26% 6.79% 0.43% -10.04% 1.10%
Dec-92 -5.22% -13.28% 0.65% 11.04% 1.08% 2.91% 0.03%
Dec-93 -0.42% -7.18% 0.46% 12.35% 1.41% 2.83% 0.02%
Secure Best Marks with AI Grader
Need help grading? Try our AI Grader for instant feedback on your assignments.
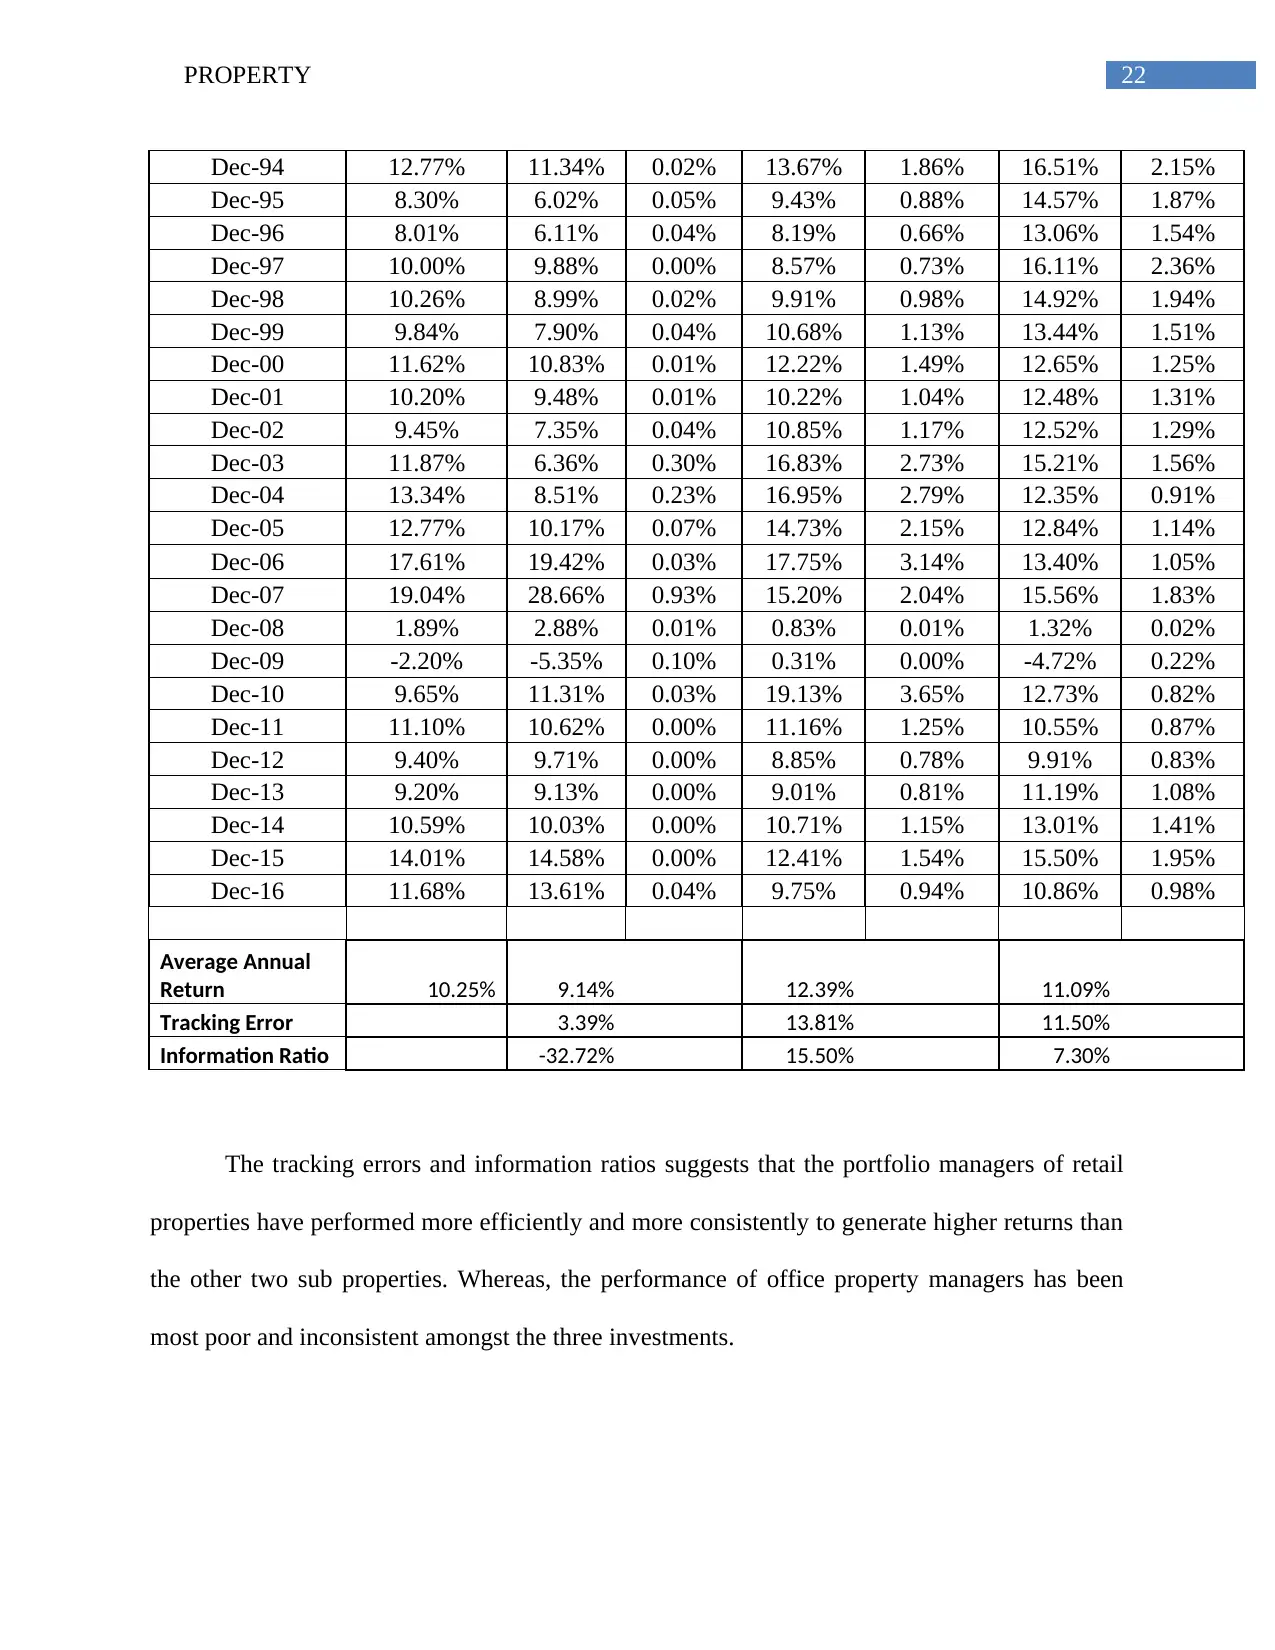
22PROPERTY
Dec-94 12.77% 11.34% 0.02% 13.67% 1.86% 16.51% 2.15%
Dec-95 8.30% 6.02% 0.05% 9.43% 0.88% 14.57% 1.87%
Dec-96 8.01% 6.11% 0.04% 8.19% 0.66% 13.06% 1.54%
Dec-97 10.00% 9.88% 0.00% 8.57% 0.73% 16.11% 2.36%
Dec-98 10.26% 8.99% 0.02% 9.91% 0.98% 14.92% 1.94%
Dec-99 9.84% 7.90% 0.04% 10.68% 1.13% 13.44% 1.51%
Dec-00 11.62% 10.83% 0.01% 12.22% 1.49% 12.65% 1.25%
Dec-01 10.20% 9.48% 0.01% 10.22% 1.04% 12.48% 1.31%
Dec-02 9.45% 7.35% 0.04% 10.85% 1.17% 12.52% 1.29%
Dec-03 11.87% 6.36% 0.30% 16.83% 2.73% 15.21% 1.56%
Dec-04 13.34% 8.51% 0.23% 16.95% 2.79% 12.35% 0.91%
Dec-05 12.77% 10.17% 0.07% 14.73% 2.15% 12.84% 1.14%
Dec-06 17.61% 19.42% 0.03% 17.75% 3.14% 13.40% 1.05%
Dec-07 19.04% 28.66% 0.93% 15.20% 2.04% 15.56% 1.83%
Dec-08 1.89% 2.88% 0.01% 0.83% 0.01% 1.32% 0.02%
Dec-09 -2.20% -5.35% 0.10% 0.31% 0.00% -4.72% 0.22%
Dec-10 9.65% 11.31% 0.03% 19.13% 3.65% 12.73% 0.82%
Dec-11 11.10% 10.62% 0.00% 11.16% 1.25% 10.55% 0.87%
Dec-12 9.40% 9.71% 0.00% 8.85% 0.78% 9.91% 0.83%
Dec-13 9.20% 9.13% 0.00% 9.01% 0.81% 11.19% 1.08%
Dec-14 10.59% 10.03% 0.00% 10.71% 1.15% 13.01% 1.41%
Dec-15 14.01% 14.58% 0.00% 12.41% 1.54% 15.50% 1.95%
Dec-16 11.68% 13.61% 0.04% 9.75% 0.94% 10.86% 0.98%
Average Annual
Return 10.25% 9.14% 12.39% 11.09%
Tracking Error 3.39% 13.81% 11.50%
Information Ratio -32.72% 15.50% 7.30%
The tracking errors and information ratios suggests that the portfolio managers of retail
properties have performed more efficiently and more consistently to generate higher returns than
the other two sub properties. Whereas, the performance of office property managers has been
most poor and inconsistent amongst the three investments.
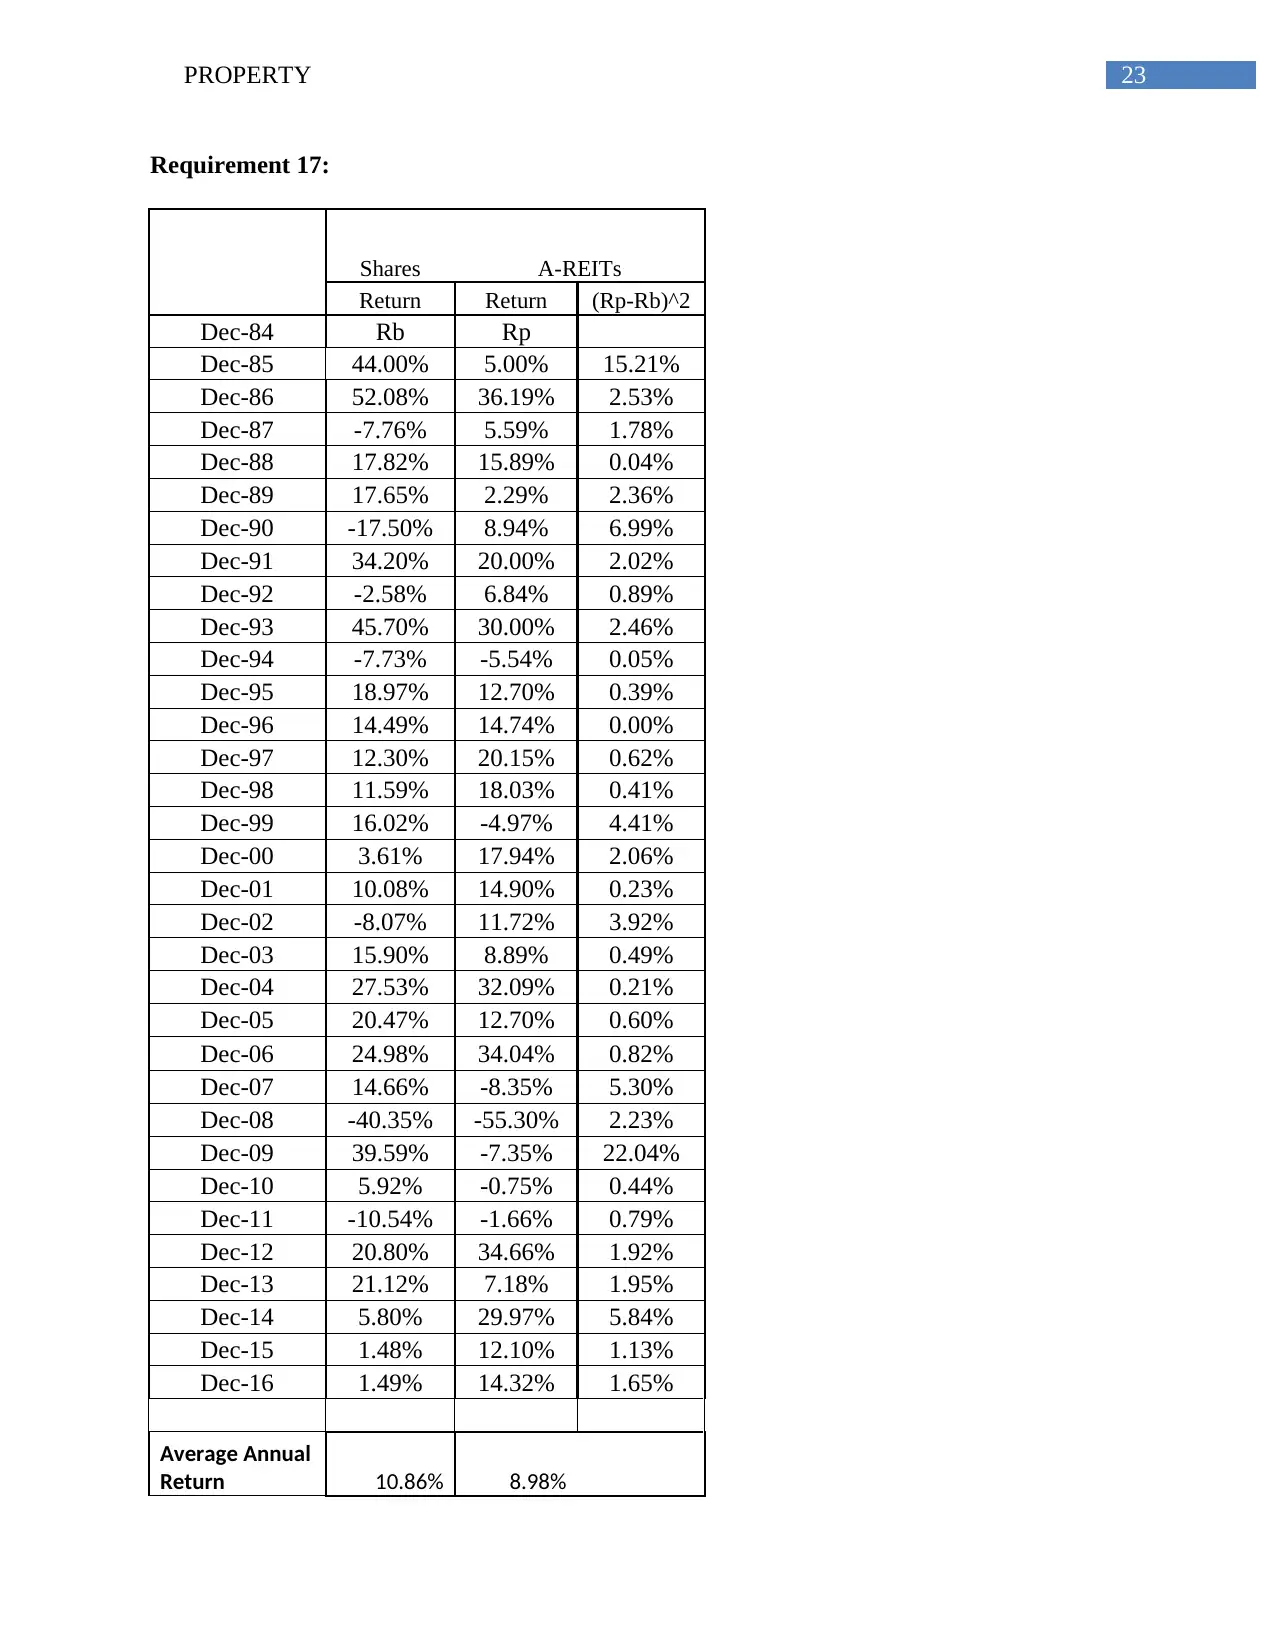
23PROPERTY
Requirement 17:
Shares A-REITs
Return Return (Rp-Rb)^2
Dec-84 Rb Rp
Dec-85 44.00% 5.00% 15.21%
Dec-86 52.08% 36.19% 2.53%
Dec-87 -7.76% 5.59% 1.78%
Dec-88 17.82% 15.89% 0.04%
Dec-89 17.65% 2.29% 2.36%
Dec-90 -17.50% 8.94% 6.99%
Dec-91 34.20% 20.00% 2.02%
Dec-92 -2.58% 6.84% 0.89%
Dec-93 45.70% 30.00% 2.46%
Dec-94 -7.73% -5.54% 0.05%
Dec-95 18.97% 12.70% 0.39%
Dec-96 14.49% 14.74% 0.00%
Dec-97 12.30% 20.15% 0.62%
Dec-98 11.59% 18.03% 0.41%
Dec-99 16.02% -4.97% 4.41%
Dec-00 3.61% 17.94% 2.06%
Dec-01 10.08% 14.90% 0.23%
Dec-02 -8.07% 11.72% 3.92%
Dec-03 15.90% 8.89% 0.49%
Dec-04 27.53% 32.09% 0.21%
Dec-05 20.47% 12.70% 0.60%
Dec-06 24.98% 34.04% 0.82%
Dec-07 14.66% -8.35% 5.30%
Dec-08 -40.35% -55.30% 2.23%
Dec-09 39.59% -7.35% 22.04%
Dec-10 5.92% -0.75% 0.44%
Dec-11 -10.54% -1.66% 0.79%
Dec-12 20.80% 34.66% 1.92%
Dec-13 21.12% 7.18% 1.95%
Dec-14 5.80% 29.97% 5.84%
Dec-15 1.48% 12.10% 1.13%
Dec-16 1.49% 14.32% 1.65%
Average Annual
Return 10.86% 8.98%
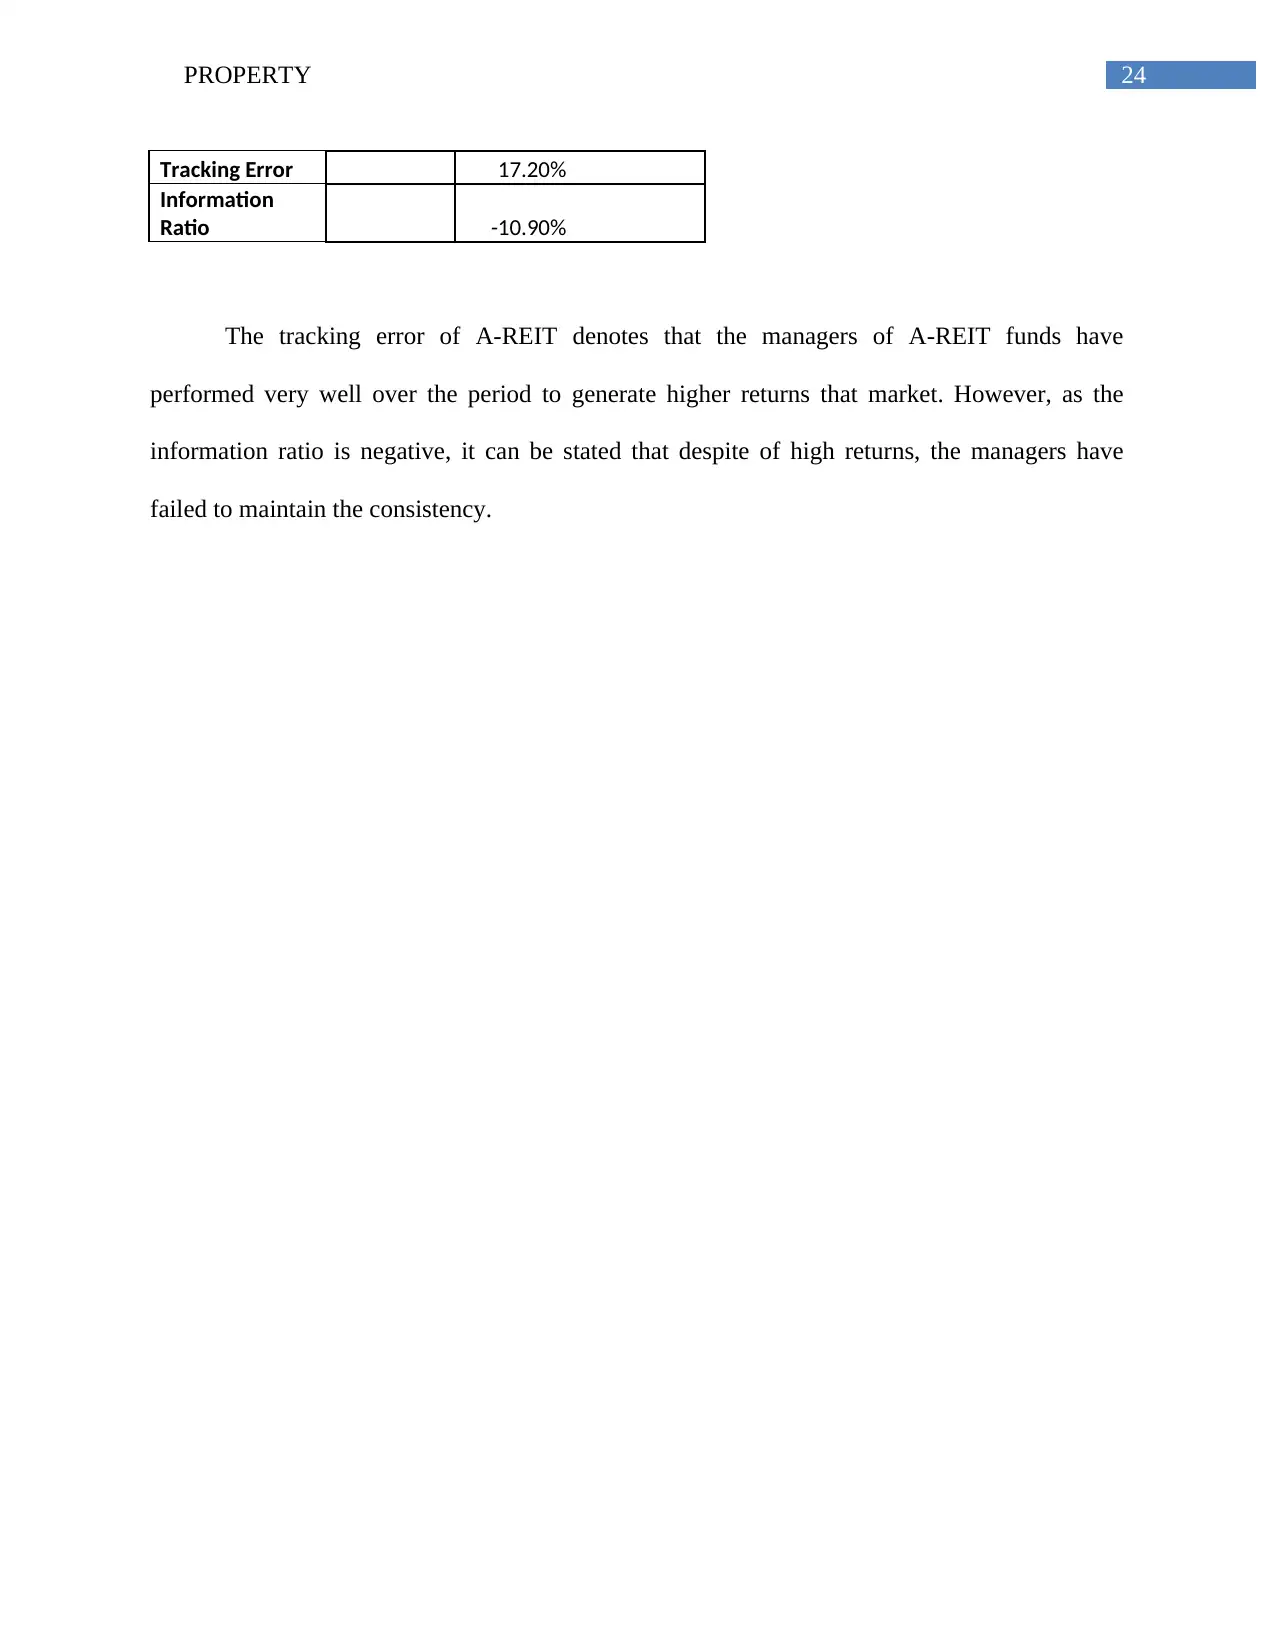
24PROPERTY
Tracking Error 17.20%
Information
Ratio -10.90%
The tracking error of A-REIT denotes that the managers of A-REIT funds have
performed very well over the period to generate higher returns that market. However, as the
information ratio is negative, it can be stated that despite of high returns, the managers have
failed to maintain the consistency.
Paraphrase This Document
Need a fresh take? Get an instant paraphrase of this document with our AI Paraphraser
25PROPERTY
Bibliography:
Baker, H.K. and Haslem, J.A., 2015. Information needs of individual investors
Barry, P.J. and Robison, L.J., 2014. Economic Rates of Return and Investment Analysis. The
Engineering Economist, 59(3), pp.231-236.
Bodie, Z., 2013. Investments. McGraw-Hill.
Boyd, J., Epanchin-Niell, R. and Siikamäki, J., 2015. Conservation planning: a review of return
on investment analysis. Review of Environmental Economics and Policy, 9(1), pp.23-42.
Damodaran, A., 2016. Damodaran on valuation: security analysis for investment and corporate
finance (Vol. 324). John Wiley & Sons.
DeFusco, R.A., McLeavey, D.W., Anson, M.J., Pinto, J.E. and Runkle, D.E., 2015. Quantitative
investment analysis. John Wiley & Sons.
Dhrymes, P.J., 2017. Portfolio Theory: Origins, Markowitz and CAPM Based Selection.
In Portfolio Construction, Measurement, and Efficiency (pp. 39-48). Springer International
Publishing.
Frank, K.R. and Keith, C.B., 2016. Investment analysis and portfolio management
Jordan, B., 2014. Fundamentals of investments. McGraw-Hill Higher Education.
Kevin, S., 2015. Security analysis and portfolio management. PHI Learning Pvt. Ltd
Runkle, D.E., DeFusco, R.A., Anson, M.J., Pinto, J.E. and McLeavey, D.W., 2013. Quantitative
Investment Analysis. Wiley.

26PROPERTY
1 out of 27
Related Documents

Your All-in-One AI-Powered Toolkit for Academic Success.
+13062052269
info@desklib.com
Available 24*7 on WhatsApp / Email
![[object Object]](/_next/static/media/star-bottom.7253800d.svg)
Unlock your academic potential
© 2024 | Zucol Services PVT LTD | All rights reserved.