Financial Ratio Analysis of Cement Companies in Bangladesh (FIN254)
VerifiedAdded on 2021/01/05
|34
|4782
|180
Project
AI Summary
This project, submitted for the Introduction to Financial Management (FIN254) course, presents a comprehensive ratio analysis of Heidelberg Cement Bangladesh Limited and LafargeHolcim Bangladesh Limited. The analysis covers the period from 2016 to 2019, encompassing liquidity, activity, solvency, profitability, and market ratios. The report includes detailed calculations and a comparative analysis of the two companies' financial performance, providing insights into their strengths and weaknesses based on key financial indicators such as current ratio, quick ratio, accounts receivable turnover, debt ratio, and return on equity. The project aims to demonstrate an understanding of financial statement analysis and its application in assessing corporate financial health within the context of the Bangladeshi cement industry.
Ratio Analysis of 2 Cement Companies in Bangladesh
Course: Introduction to Financial Management (FIN254)
Section 18
Submitted to: Khaiyyum Hashem
Senior Lecturer, Department of Accounting and Finance
Ratio Analysis of
Heidelberg Cement Bangladesh Limited & LafargeHolcim Bangladesh Limited
Submitted by:
Rowzatur Rumman Kashfi 1620135020
Anika Fairuse 1311209630
Paraphrase This Document
Need a fresh take? Get an instant paraphrase of this document with our AI Paraphraser
2
December 22nd, 2018
Khaiyyum Hashem
Lecturer
Department of Accounting and Finance
North South University
Bashundhara R/A, Dhaka-1229
Subject: Submission of Group Project
Dear Sir
We would like to express our gratitude to you for giving us the opportunity to do a project on
ratio analysis which not only helped us learn calculating ratios but also helped us to know the
effects of the change in these ratios in decision making.
Here is the report you asked us to submit on the analysis of financial statement of two
publicly listed companies. We have chosen Heidelberg Cement Bangladesh Ltd and
LafargeHolcim Bangladesh Limited to do our report on.
We have tried our level best to follow it according to your guidelines along with your
instructions. Any question about the report or any feedback is most welcomed.
Sincerely,
Rowzatur Rumman Kashfi
……………………….
Anika Fairuse
……………………….
3
Table of Contents
1 Executive Summary..............................................................................................................................5
2 Company Introductions.........................................................................................................................6
2.1 Heidelberg Cement Bangladesh Limited.......................................................................................6
2.2 LafargeHolcim Bangladesh Limited..............................................................................................6
3 Ratio Analysis (Time Series & Cross Sectional)..................................................................................7
3.1 Liquidity Ratios.............................................................................................................................7
3.1.1 Current Ratio...........................................................................................................................7
3.1.2 Quick (Acid-Test) Ratio.........................................................................................................8
3.2 Activity Ratios...............................................................................................................................9
3.2.1 Accounts Receivable Turnover...............................................................................................9
3.2.2 Average Collection Period....................................................................................................10
3.2.3 Accounts Payable Turnover..................................................................................................11
3.2.4 Average Payment Period......................................................................................................12
3.3.5 Inventory Turnover...............................................................................................................13
3.2.6 Average Age of Inventory....................................................................................................14
3.2.7 Total Asset Turnover............................................................................................................15
3.2.8 Fixed Asset Turnover............................................................................................................16
3.3 Solvency Ratios...........................................................................................................................17
3.3.1 Debt Ratio.............................................................................................................................17
3.3.2 Debt-Equity Ratio.................................................................................................................18
3.3.3 Times Interest Earned...........................................................................................................19
3.4 Profitability Ratios.......................................................................................................................20
3.4.1 Gross Profit Margin..............................................................................................................20
3.4.2 Net Profit Margin..................................................................................................................21
3.4.3 Return on Total Assets (ROA)..............................................................................................22
3.4.4 Return on Equity...................................................................................................................23
3.5 Market Ratios...............................................................................................................................24
3.5.1 Earning Per Share.................................................................................................................24
⊘ This is a preview!⊘
Do you want full access?
Subscribe today to unlock all pages.
Trusted by 1+ million students worldwide
4
3.5.2 Price/ Earnings (P/E) Ratio...................................................................................................25
3.5.3 Book Value per Share...........................................................................................................26
3.5.4 Market/ Book Ratio..............................................................................................................27
3.5.5 Dividend per Share...............................................................................................................28
3.5.6 Dividend Yield......................................................................................................................29
3.5.7 Dividend Payout...................................................................................................................30
4 Recommendations and Conclusion.....................................................................................................31
5 calculations.........................................................................................................................................32
5.1 Heidelberg Cement Bangladesh...................................................................................................32
5.2 LafargeHolcim Bangladesh.........................................................................................................35
6 References...........................................................................................................................................38
Paraphrase This Document
Need a fresh take? Get an instant paraphrase of this document with our AI Paraphraser
5
1 Executive Summary
We had to calculate the financial ratios of two publicly listed companies using their financial
statements for the range of 3 years- 2014 to 2017. We found out the Liquidity ratios, Activity
ratios, Solvency ratios, Profitability ratios and Market for both the companies. After that we
analyzed the ratios to understand the real finance standings of the company.
We consequently did the ‘year wise’ analysis on the 2 cement industries of Bangladesh
(Heidelberg Cement Bangladesh Ltd & LafargeHolcim Bangladesh Limited) and then we
compared the ratios of the two companies with each other. We tried our best to make accurate
calculations and analysis and this term paper has benefitted all of our team members.
6
2 Company Introductions
2.1 Heidelberg Cement Bangladesh Limited
Heidelberg Cement Bangladesh Limited is one of the largest producers of cement in
Bangladesh. Sale of Portland Composite Cement (PCC) through two brands namely Scan
Cement and Ruby Cement is the key revenue driver of this company. Its manufacturing
unites are situated in Chittagong and Kanchpur having a total installed capacity of 2.1 million
MT. Recently, additional capacity of grinding unit of 750,000 MT/year in Chittagong had
started its commercial operation since January 12, 2012.
2.2 LafargeHolcim Bangladesh Limited
LafargeHolcim is the leading global construction materials and solutions company serving
masons, builders, architects and engineers all over the world. LafargeHolcim was born of the
merger of Lafarge and Holcim in 2015. With over 180 years of combined experience. Our
operations produce cement, aggregates and ready-mix concrete which are used in building
projects ranging from affordable housing and small, local projects to the biggest, most
technically and architecturally challenging infrastructure projects. As urbanization
increasingly impacts people and the planet, we provide innovative products and building
solutions with a clear commitment to social and environmental sustainability.
⊘ This is a preview!⊘
Do you want full access?
Subscribe today to unlock all pages.
Trusted by 1+ million students worldwide
7
3 Ratio Analysis (Time Series & Cross Sectional)
3.1 Liquidity Ratios
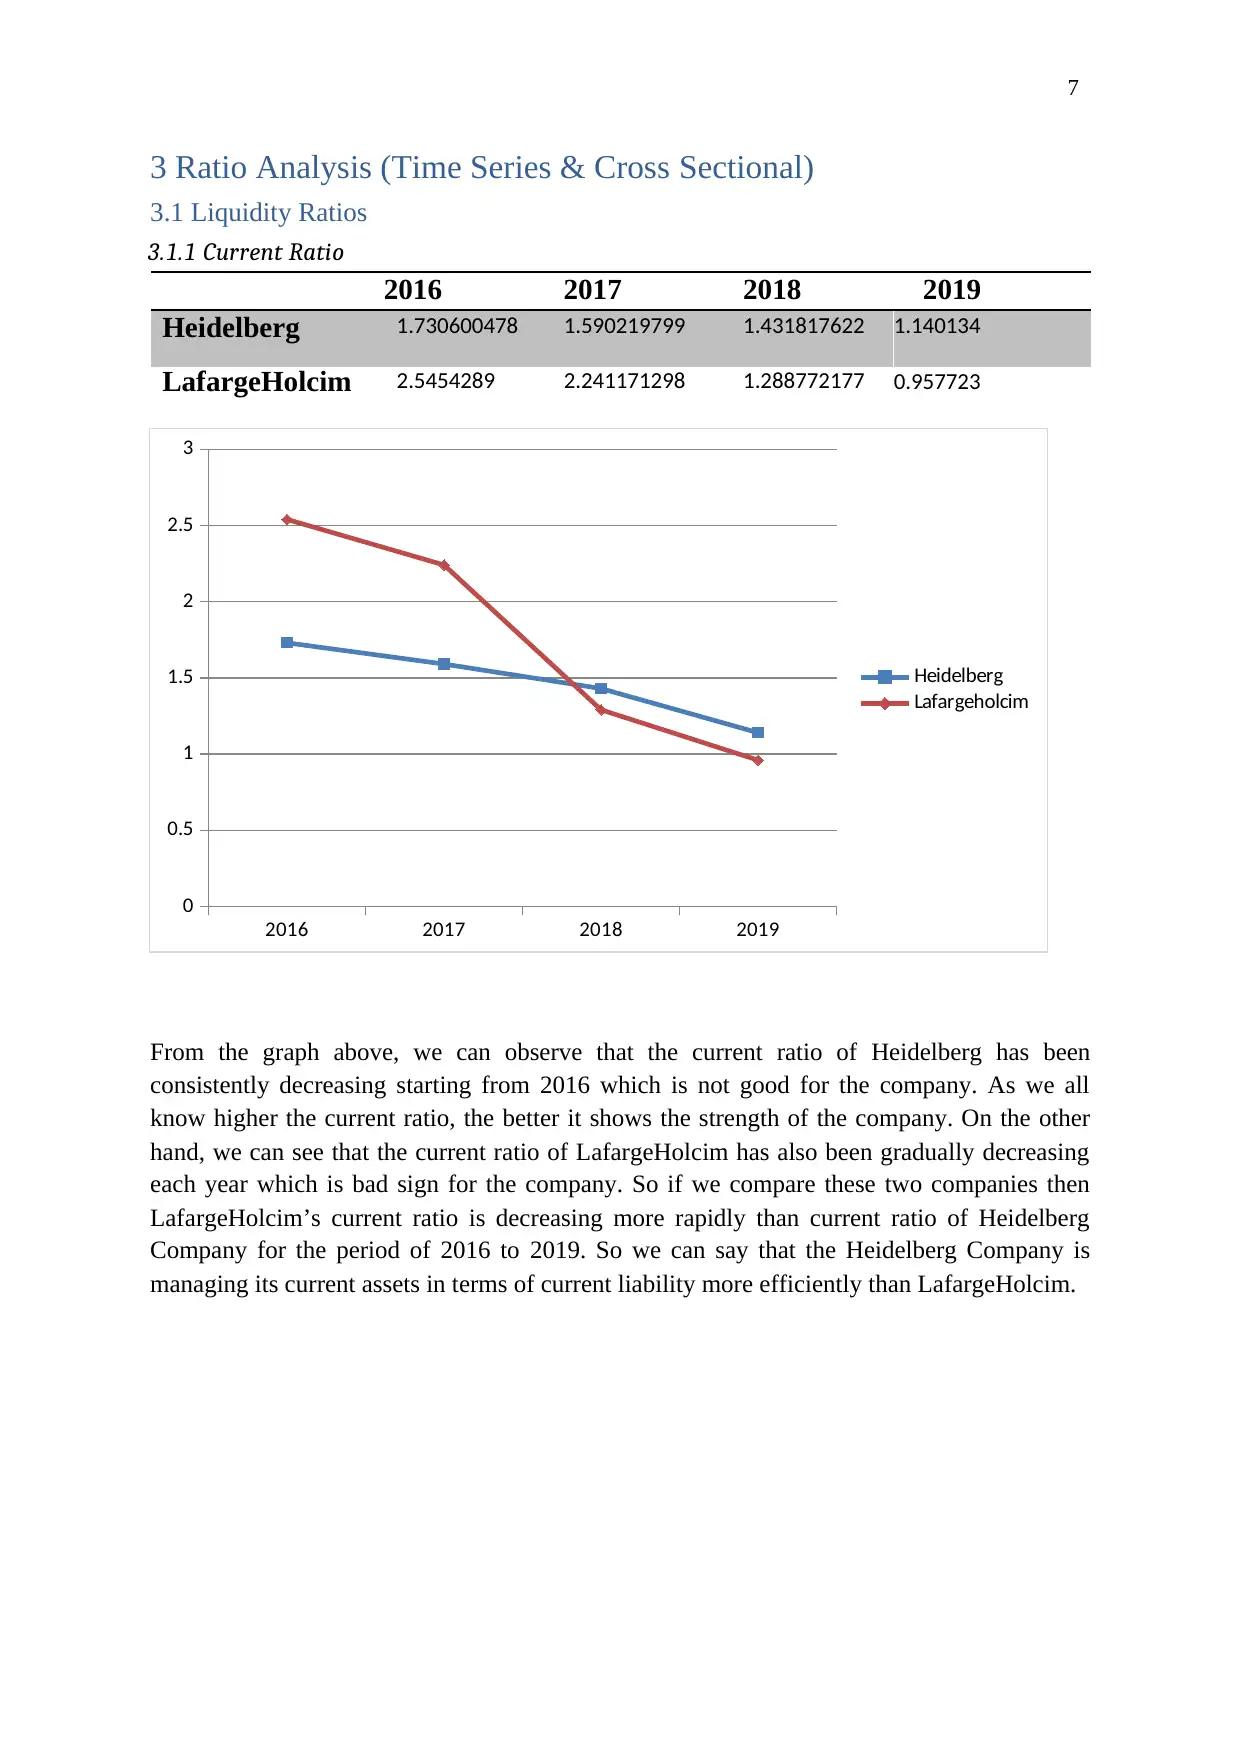
3.1.1 Current Ratio
2016 2017 2018 2019
Heidelberg 1.730600478 1.590219799 1.431817622 1.140134
LafargeHolcim 2.5454289 2.241171298 1.288772177 0.957723
2016 2017 2018 2019
0
0.5
1
1.5
2
2.5
3
Heidelberg
Lafargeholcim
From the graph above, we can observe that the current ratio of Heidelberg has been
consistently decreasing starting from 2016 which is not good for the company. As we all
know higher the current ratio, the better it shows the strength of the company. On the other
hand, we can see that the current ratio of LafargeHolcim has also been gradually decreasing
each year which is bad sign for the company. So if we compare these two companies then
LafargeHolcim’s current ratio is decreasing more rapidly than current ratio of Heidelberg
Company for the period of 2016 to 2019. So we can say that the Heidelberg Company is
managing its current assets in terms of current liability more efficiently than LafargeHolcim.
3 Ratio Analysis (Time Series & Cross Sectional)
3.1 Liquidity Ratios
3.1.1 Current Ratio
2016 2017 2018 2019
Heidelberg 1.730600478 1.590219799 1.431817622 1.140134
LafargeHolcim 2.5454289 2.241171298 1.288772177 0.957723
2016 2017 2018 2019
0
0.5
1
1.5
2
2.5
3
Heidelberg
Lafargeholcim
From the graph above, we can observe that the current ratio of Heidelberg has been
consistently decreasing starting from 2016 which is not good for the company. As we all
know higher the current ratio, the better it shows the strength of the company. On the other
hand, we can see that the current ratio of LafargeHolcim has also been gradually decreasing
each year which is bad sign for the company. So if we compare these two companies then
LafargeHolcim’s current ratio is decreasing more rapidly than current ratio of Heidelberg
Company for the period of 2016 to 2019. So we can say that the Heidelberg Company is
managing its current assets in terms of current liability more efficiently than LafargeHolcim.
Paraphrase This Document
Need a fresh take? Get an instant paraphrase of this document with our AI Paraphraser
8
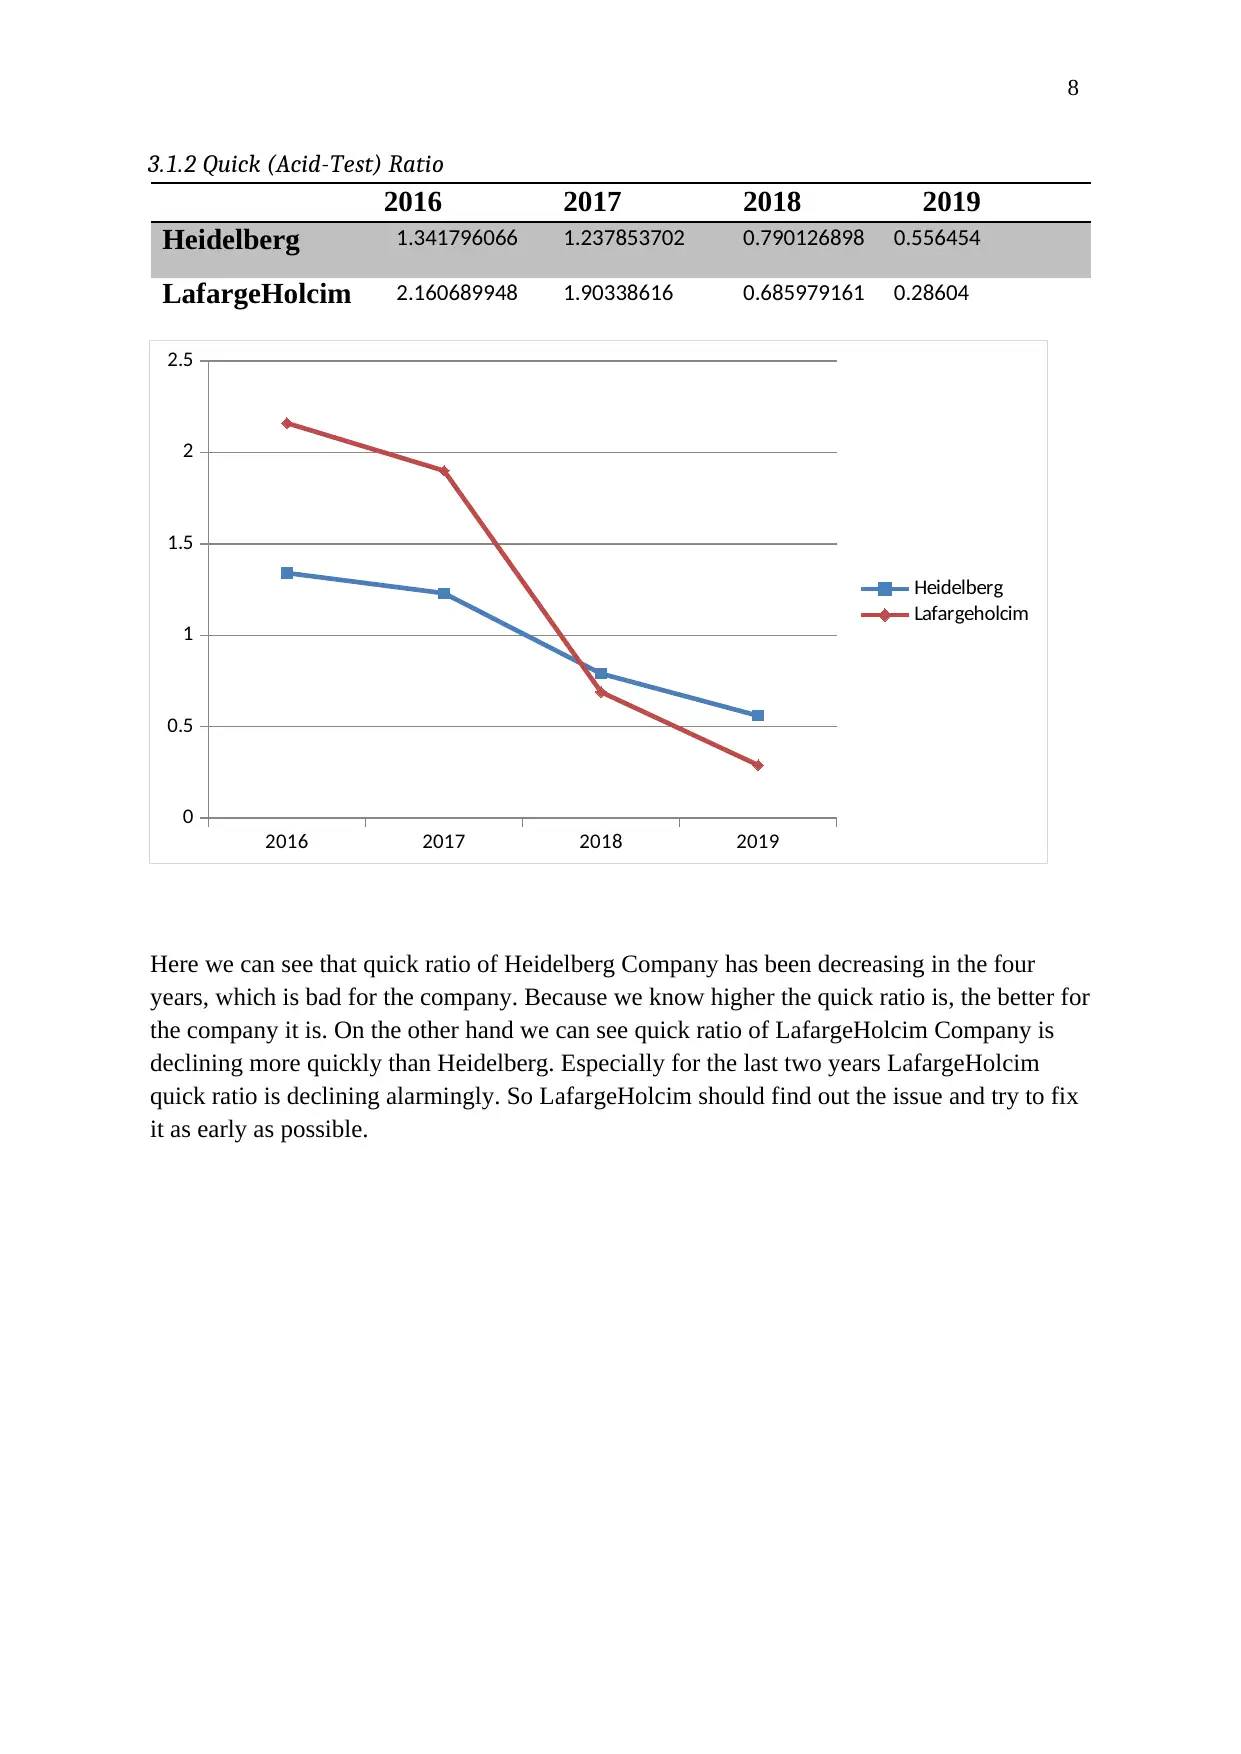
3.1.2 Quick (Acid-Test) Ratio
2016 2017 2018 2019
Heidelberg 1.341796066 1.237853702 0.790126898 0.556454
LafargeHolcim 2.160689948 1.90338616 0.685979161 0.28604
2016 2017 2018 2019
0
0.5
1
1.5
2
2.5
Heidelberg
Lafargeholcim
Here we can see that quick ratio of Heidelberg Company has been decreasing in the four
years, which is bad for the company. Because we know higher the quick ratio is, the better for
the company it is. On the other hand we can see quick ratio of LafargeHolcim Company is
declining more quickly than Heidelberg. Especially for the last two years LafargeHolcim
quick ratio is declining alarmingly. So LafargeHolcim should find out the issue and try to fix
it as early as possible.
9
3.2 Activity Ratios
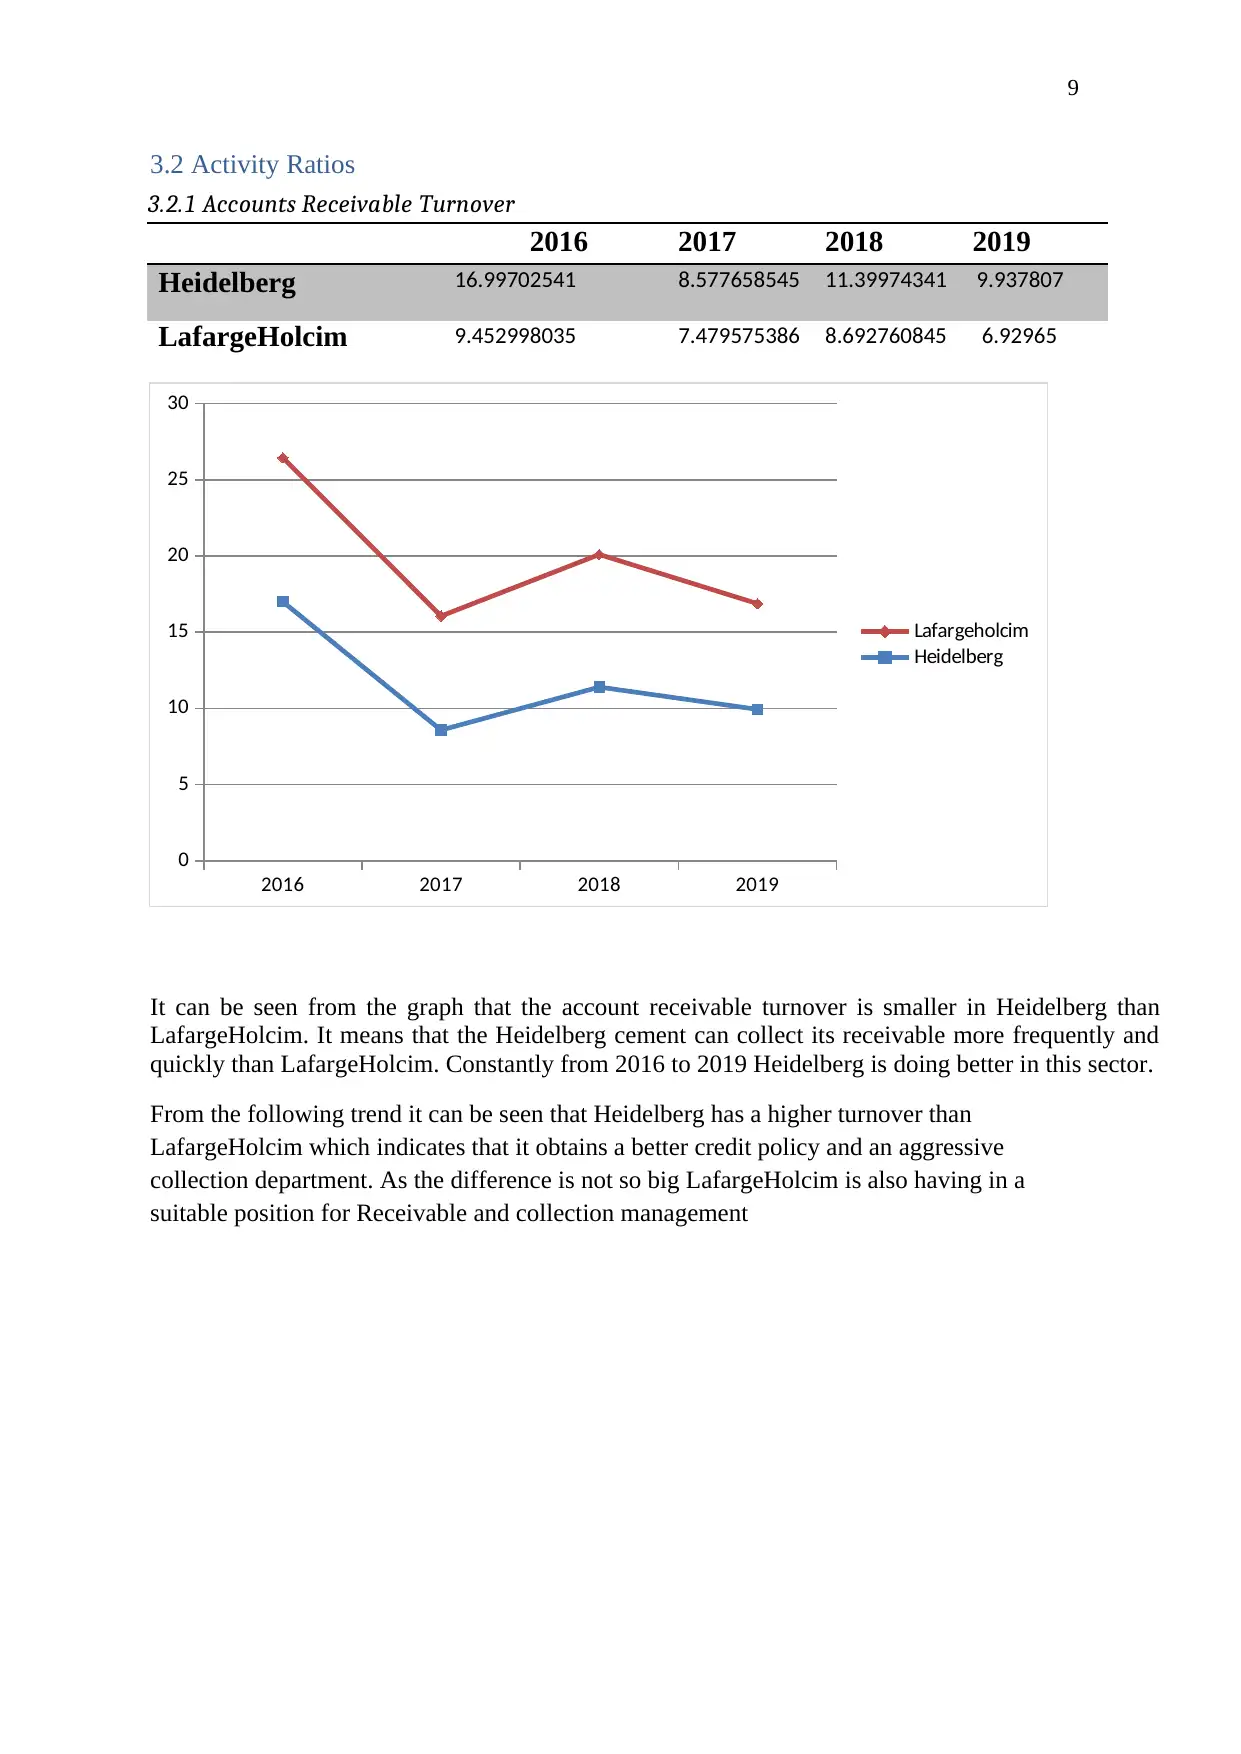
3.2.1 Accounts Receivable Turnover
2016 2017 2018 2019
Heidelberg 16.99702541 8.577658545 11.39974341 9.937807
LafargeHolcim 9.452998035 7.479575386 8.692760845 6.92965
2016 2017 2018 2019
0
5
10
15
20
25
30
Lafargeholcim
Heidelberg
It can be seen from the graph that the account receivable turnover is smaller in Heidelberg than
LafargeHolcim. It means that the Heidelberg cement can collect its receivable more frequently and
quickly than LafargeHolcim. Constantly from 2016 to 2019 Heidelberg is doing better in this sector.
From the following trend it can be seen that Heidelberg has a higher turnover than
LafargeHolcim which indicates that it obtains a better credit policy and an aggressive
collection department. As the difference is not so big LafargeHolcim is also having in a
suitable position for Receivable and collection management
3.2 Activity Ratios
3.2.1 Accounts Receivable Turnover
2016 2017 2018 2019
Heidelberg 16.99702541 8.577658545 11.39974341 9.937807
LafargeHolcim 9.452998035 7.479575386 8.692760845 6.92965
2016 2017 2018 2019
0
5
10
15
20
25
30
Lafargeholcim
Heidelberg
It can be seen from the graph that the account receivable turnover is smaller in Heidelberg than
LafargeHolcim. It means that the Heidelberg cement can collect its receivable more frequently and
quickly than LafargeHolcim. Constantly from 2016 to 2019 Heidelberg is doing better in this sector.
From the following trend it can be seen that Heidelberg has a higher turnover than
LafargeHolcim which indicates that it obtains a better credit policy and an aggressive
collection department. As the difference is not so big LafargeHolcim is also having in a
suitable position for Receivable and collection management
⊘ This is a preview!⊘
Do you want full access?
Subscribe today to unlock all pages.
Trusted by 1+ million students worldwide
10
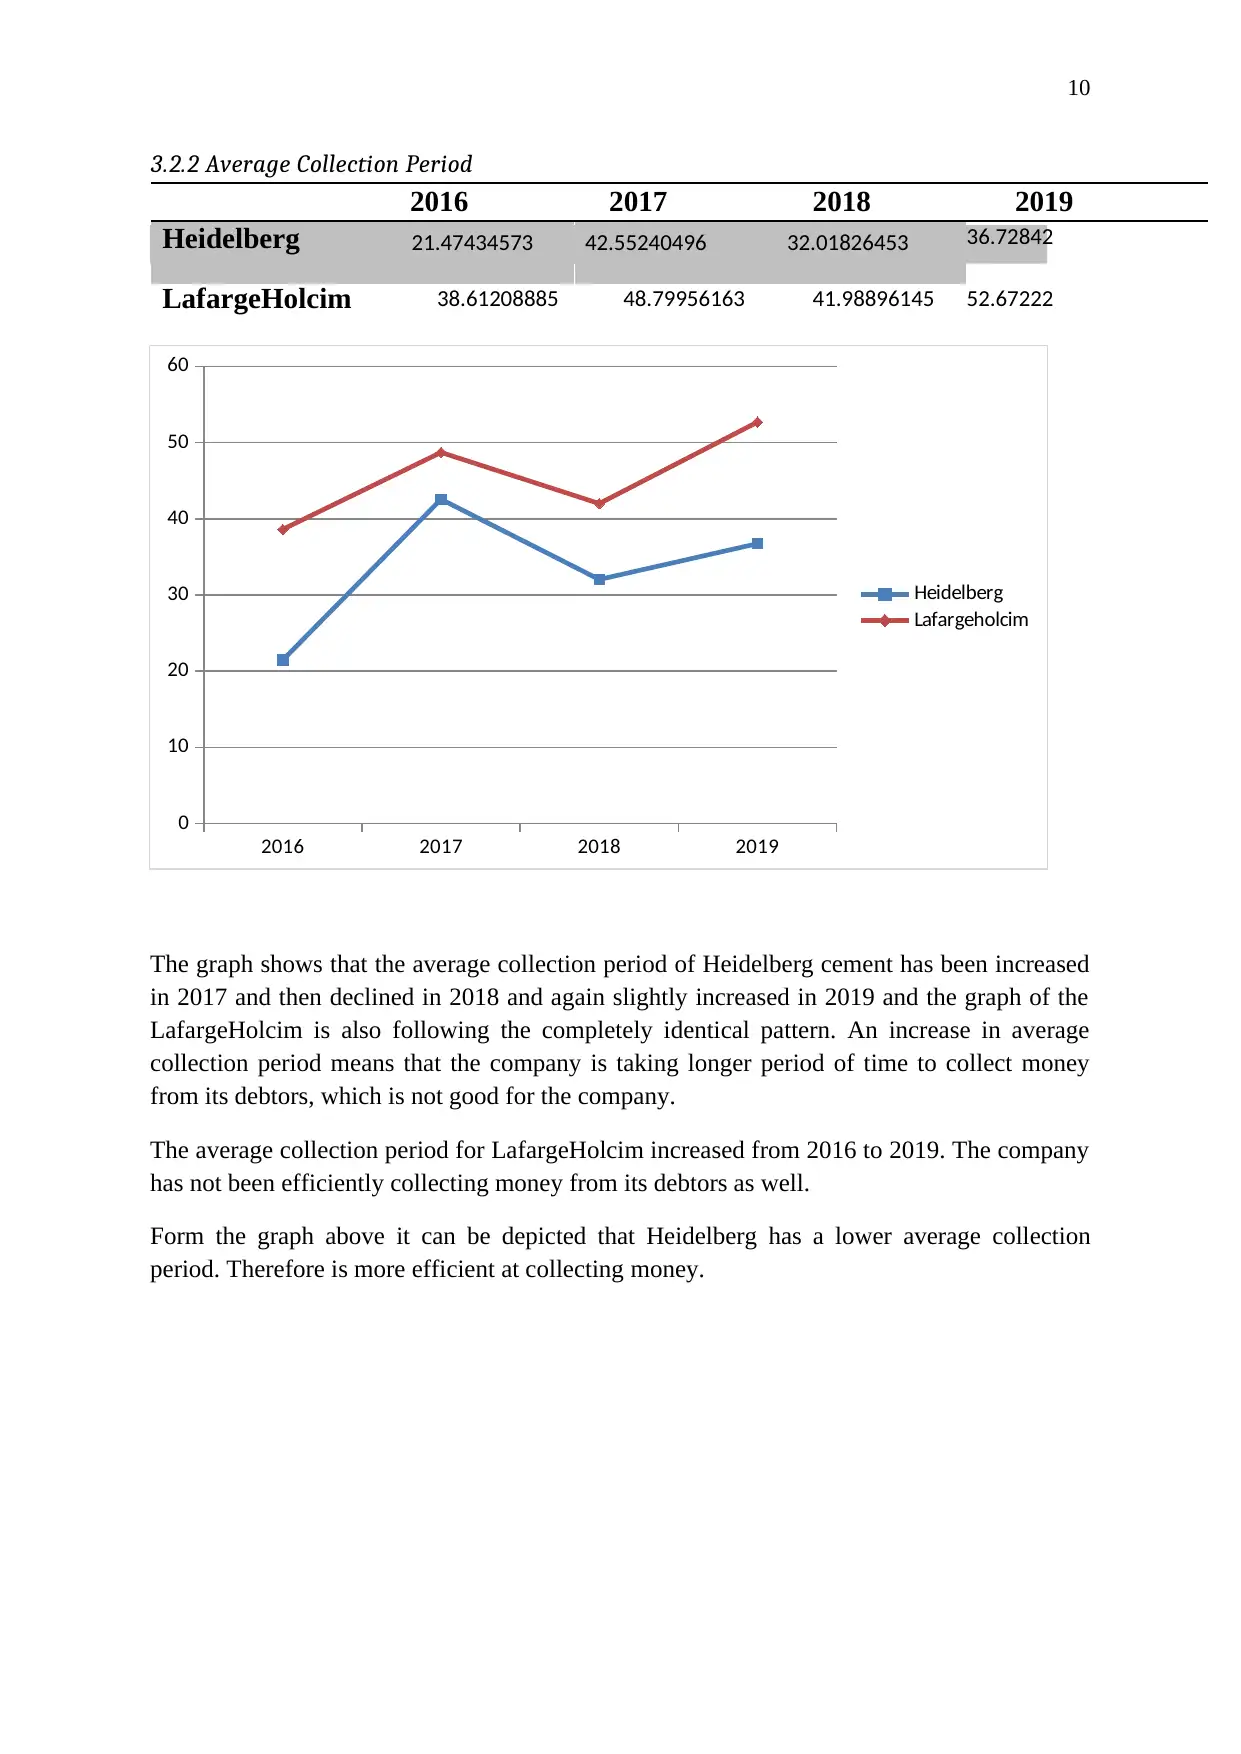
3.2.2 Average Collection Period
2016 2017 2018 2019
Heidelberg 21.47434573 42.55240496 32.01826453 36.72842
LafargeHolcim 38.61208885 48.79956163 41.98896145 52.67222
2016 2017 2018 2019
0
10
20
30
40
50
60
Heidelberg
Lafargeholcim
The graph shows that the average collection period of Heidelberg cement has been increased
in 2017 and then declined in 2018 and again slightly increased in 2019 and the graph of the
LafargeHolcim is also following the completely identical pattern. An increase in average
collection period means that the company is taking longer period of time to collect money
from its debtors, which is not good for the company.
The average collection period for LafargeHolcim increased from 2016 to 2019. The company
has not been efficiently collecting money from its debtors as well.
Form the graph above it can be depicted that Heidelberg has a lower average collection
period. Therefore is more efficient at collecting money.
Paraphrase This Document
Need a fresh take? Get an instant paraphrase of this document with our AI Paraphraser
11
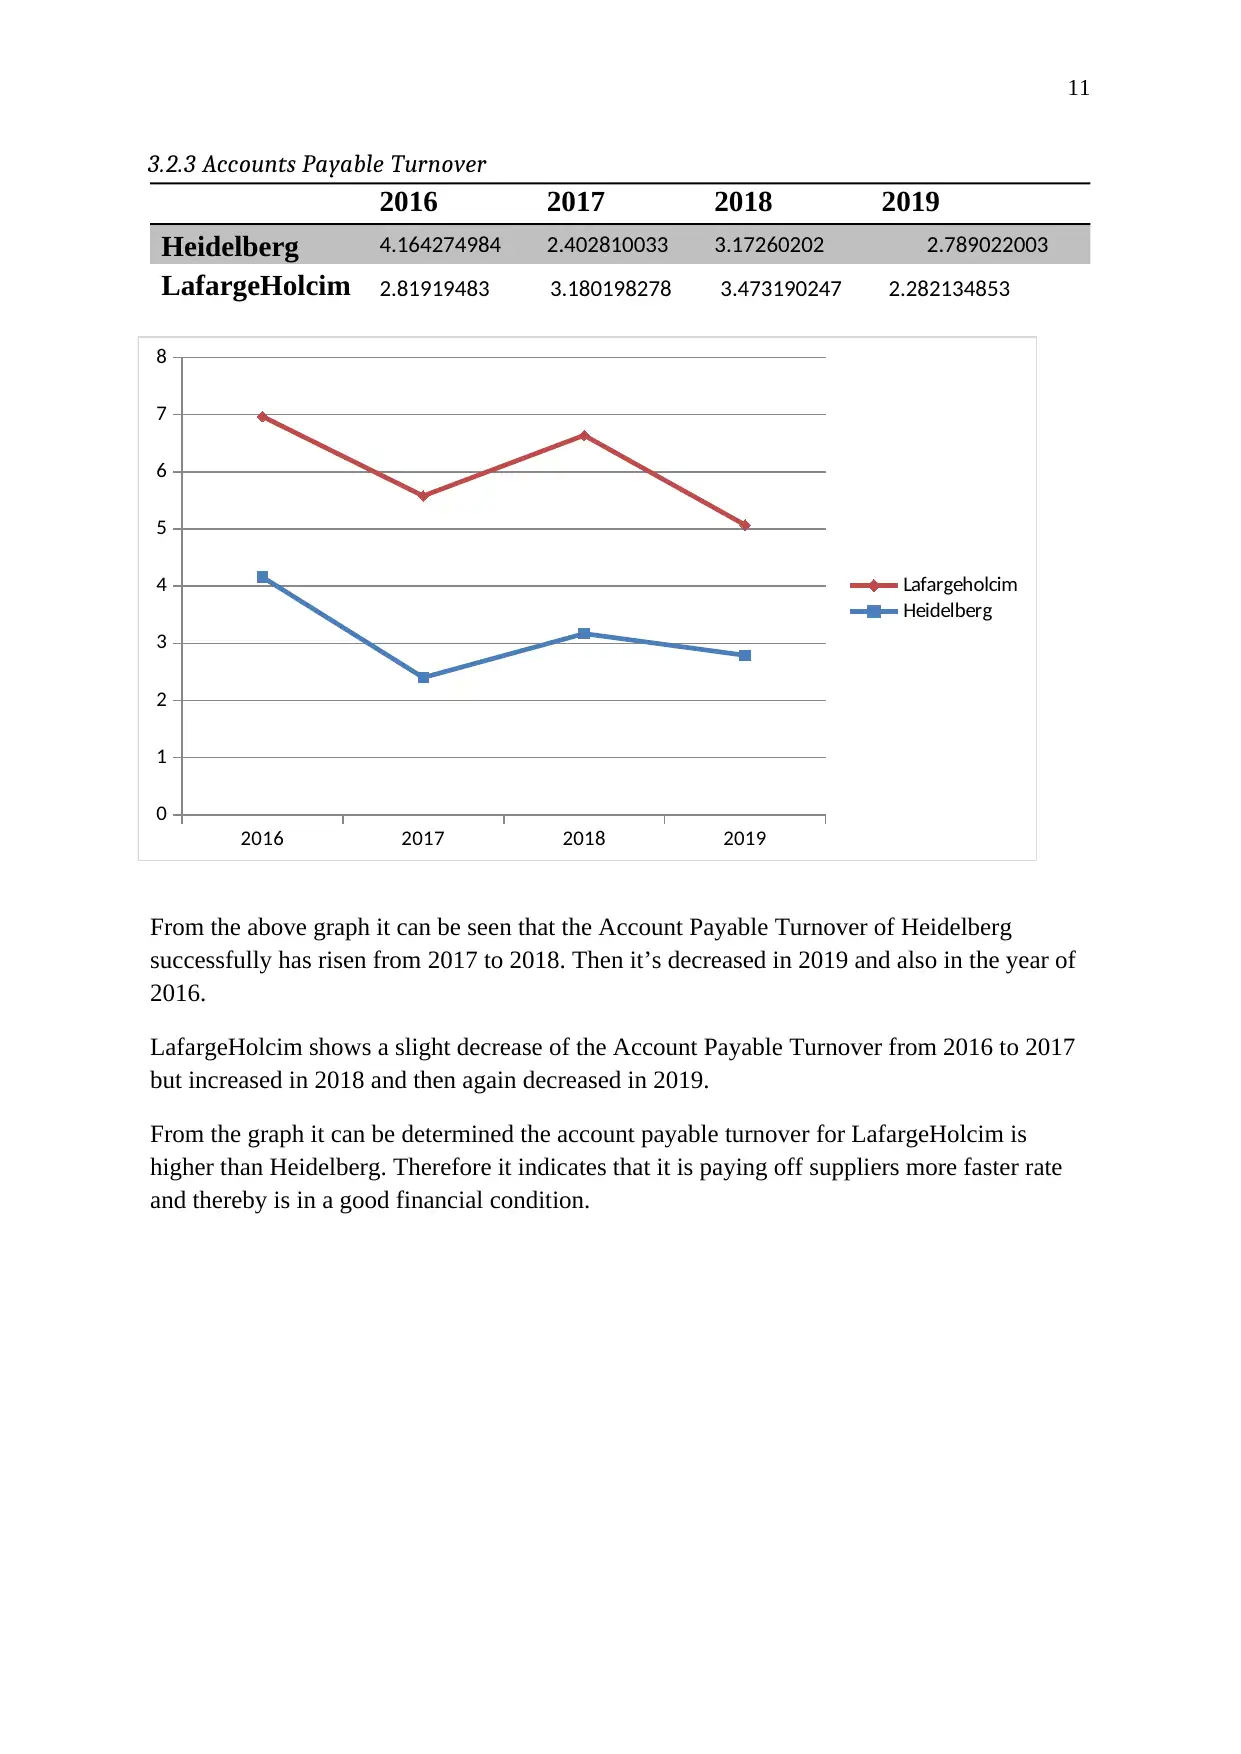
3.2.3 Accounts Payable Turnover
2016 2017 2018 2019
Heidelberg 4.164274984 2.402810033 3.17260202 2.789022003
LafargeHolcim 2.81919483 3.180198278 3.473190247 2.282134853
2016 2017 2018 2019
0
1
2
3
4
5
6
7
8
Lafargeholcim
Heidelberg
From the above graph it can be seen that the Account Payable Turnover of Heidelberg
successfully has risen from 2017 to 2018. Then it’s decreased in 2019 and also in the year of
2016.
LafargeHolcim shows a slight decrease of the Account Payable Turnover from 2016 to 2017
but increased in 2018 and then again decreased in 2019.
From the graph it can be determined the account payable turnover for LafargeHolcim is
higher than Heidelberg. Therefore it indicates that it is paying off suppliers more faster rate
and thereby is in a good financial condition.
12
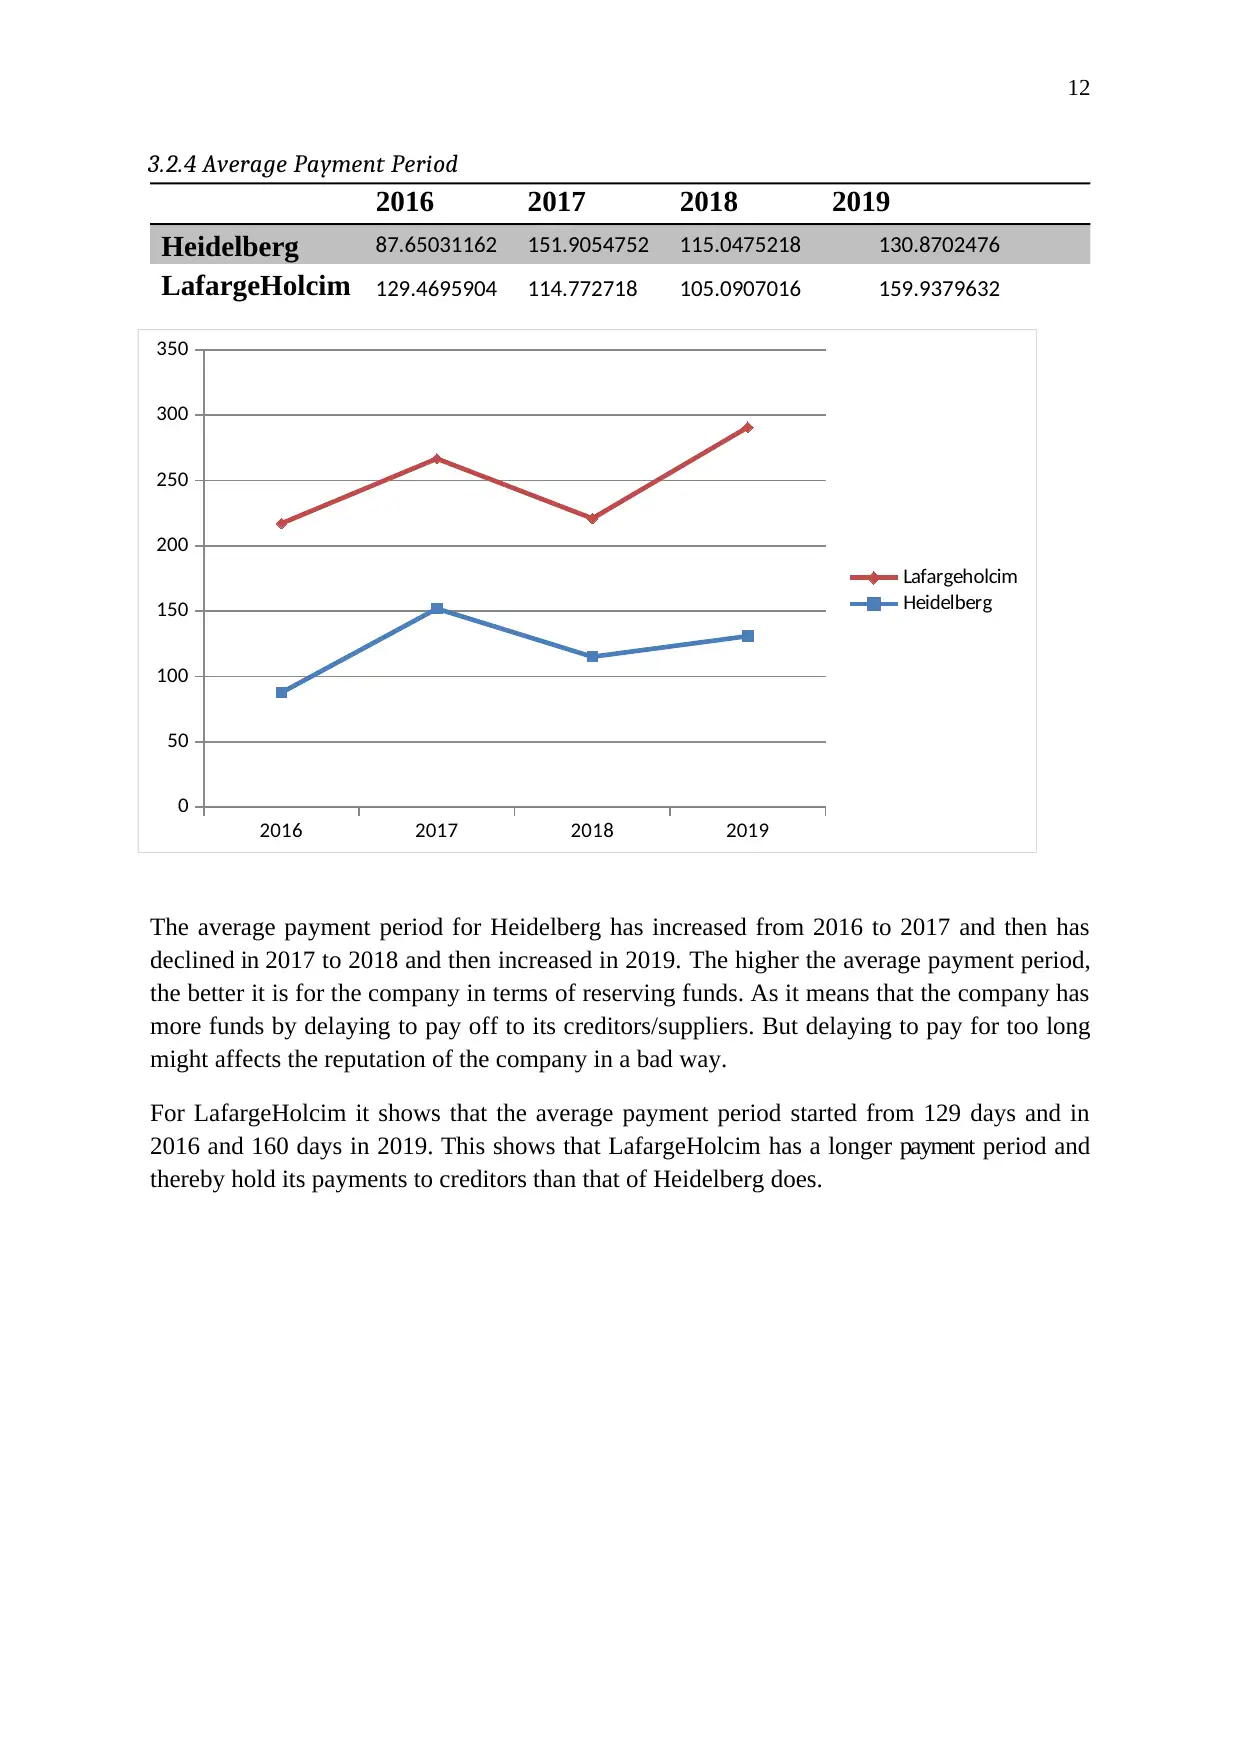
3.2.4 Average Payment Period
2016 2017 2018 2019
Heidelberg 87.65031162 151.9054752 115.0475218 130.8702476
LafargeHolcim 129.4695904 114.772718 105.0907016 159.9379632
2016 2017 2018 2019
0
50
100
150
200
250
300
350
Lafargeholcim
Heidelberg
The average payment period for Heidelberg has increased from 2016 to 2017 and then has
declined in 2017 to 2018 and then increased in 2019. The higher the average payment period,
the better it is for the company in terms of reserving funds. As it means that the company has
more funds by delaying to pay off to its creditors/suppliers. But delaying to pay for too long
might affects the reputation of the company in a bad way.
For LafargeHolcim it shows that the average payment period started from 129 days and in
2016 and 160 days in 2019. This shows that LafargeHolcim has a longer payment period and
thereby hold its payments to creditors than that of Heidelberg does.
⊘ This is a preview!⊘
Do you want full access?
Subscribe today to unlock all pages.
Trusted by 1+ million students worldwide
1 out of 34
Related Documents


Your All-in-One AI-Powered Toolkit for Academic Success.
+13062052269
info@desklib.com
Available 24*7 on WhatsApp / Email
![[object Object]](/_next/static/media/star-bottom.7253800d.svg)
Unlock your academic potential
Copyright © 2020–2026 A2Z Services. All Rights Reserved. Developed and managed by ZUCOL.