CIV3204: Analysis of Streamflow and Rainfall Data - Assignment 2019
VerifiedAdded on 2022/10/01
|9
|1369
|177
Project
AI Summary
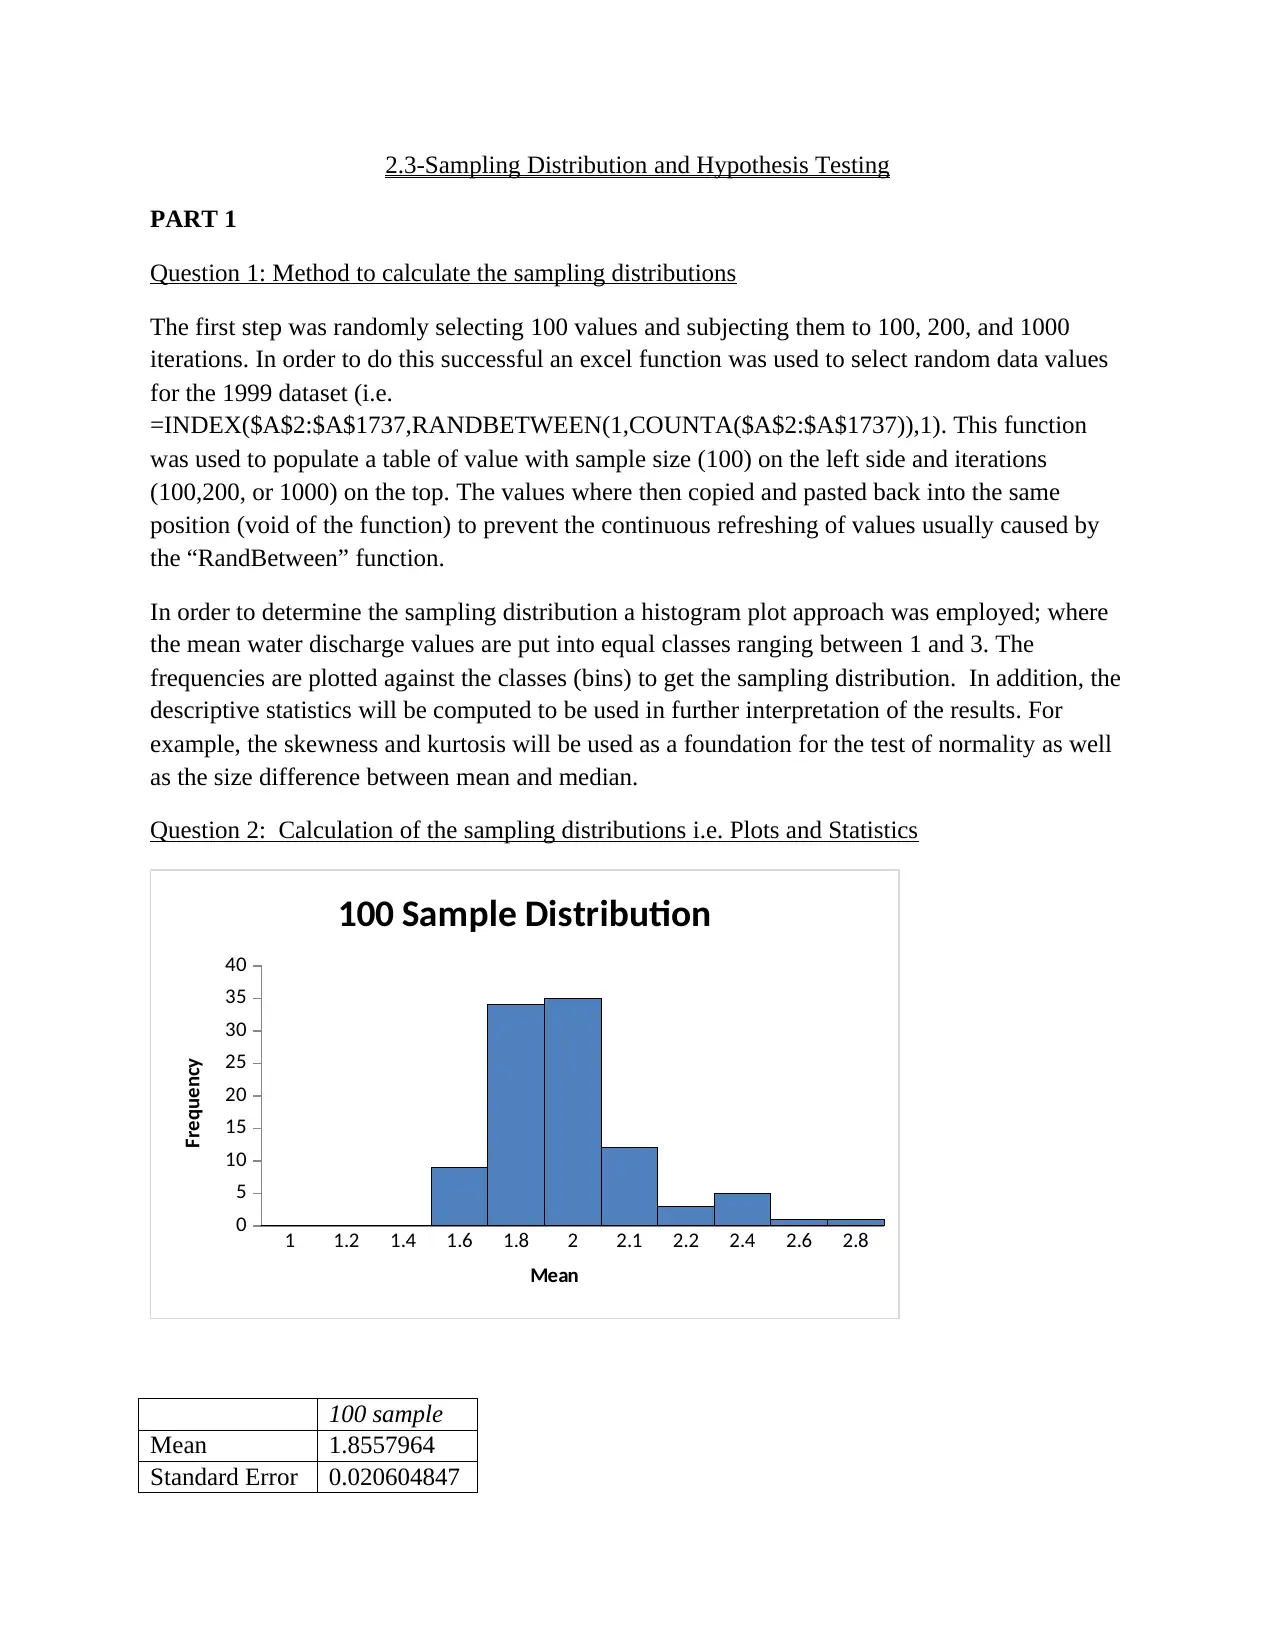
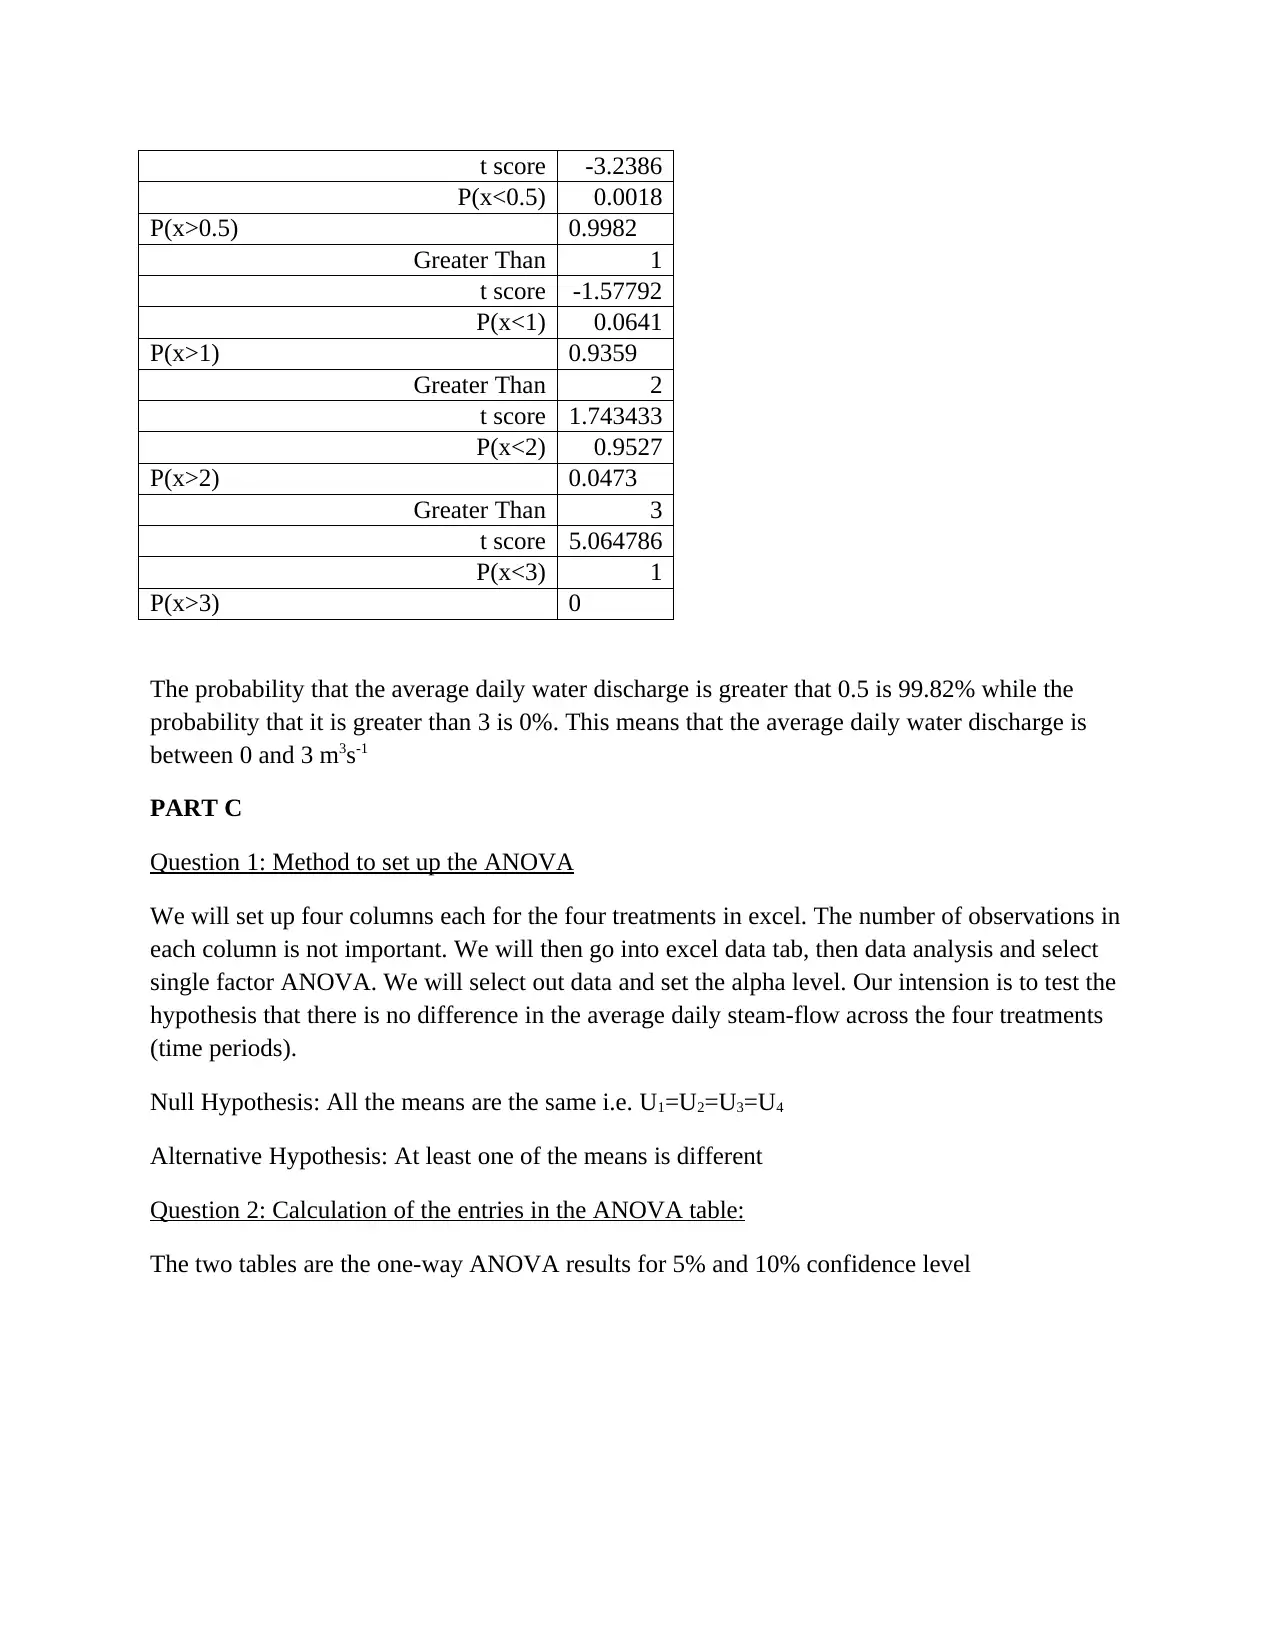
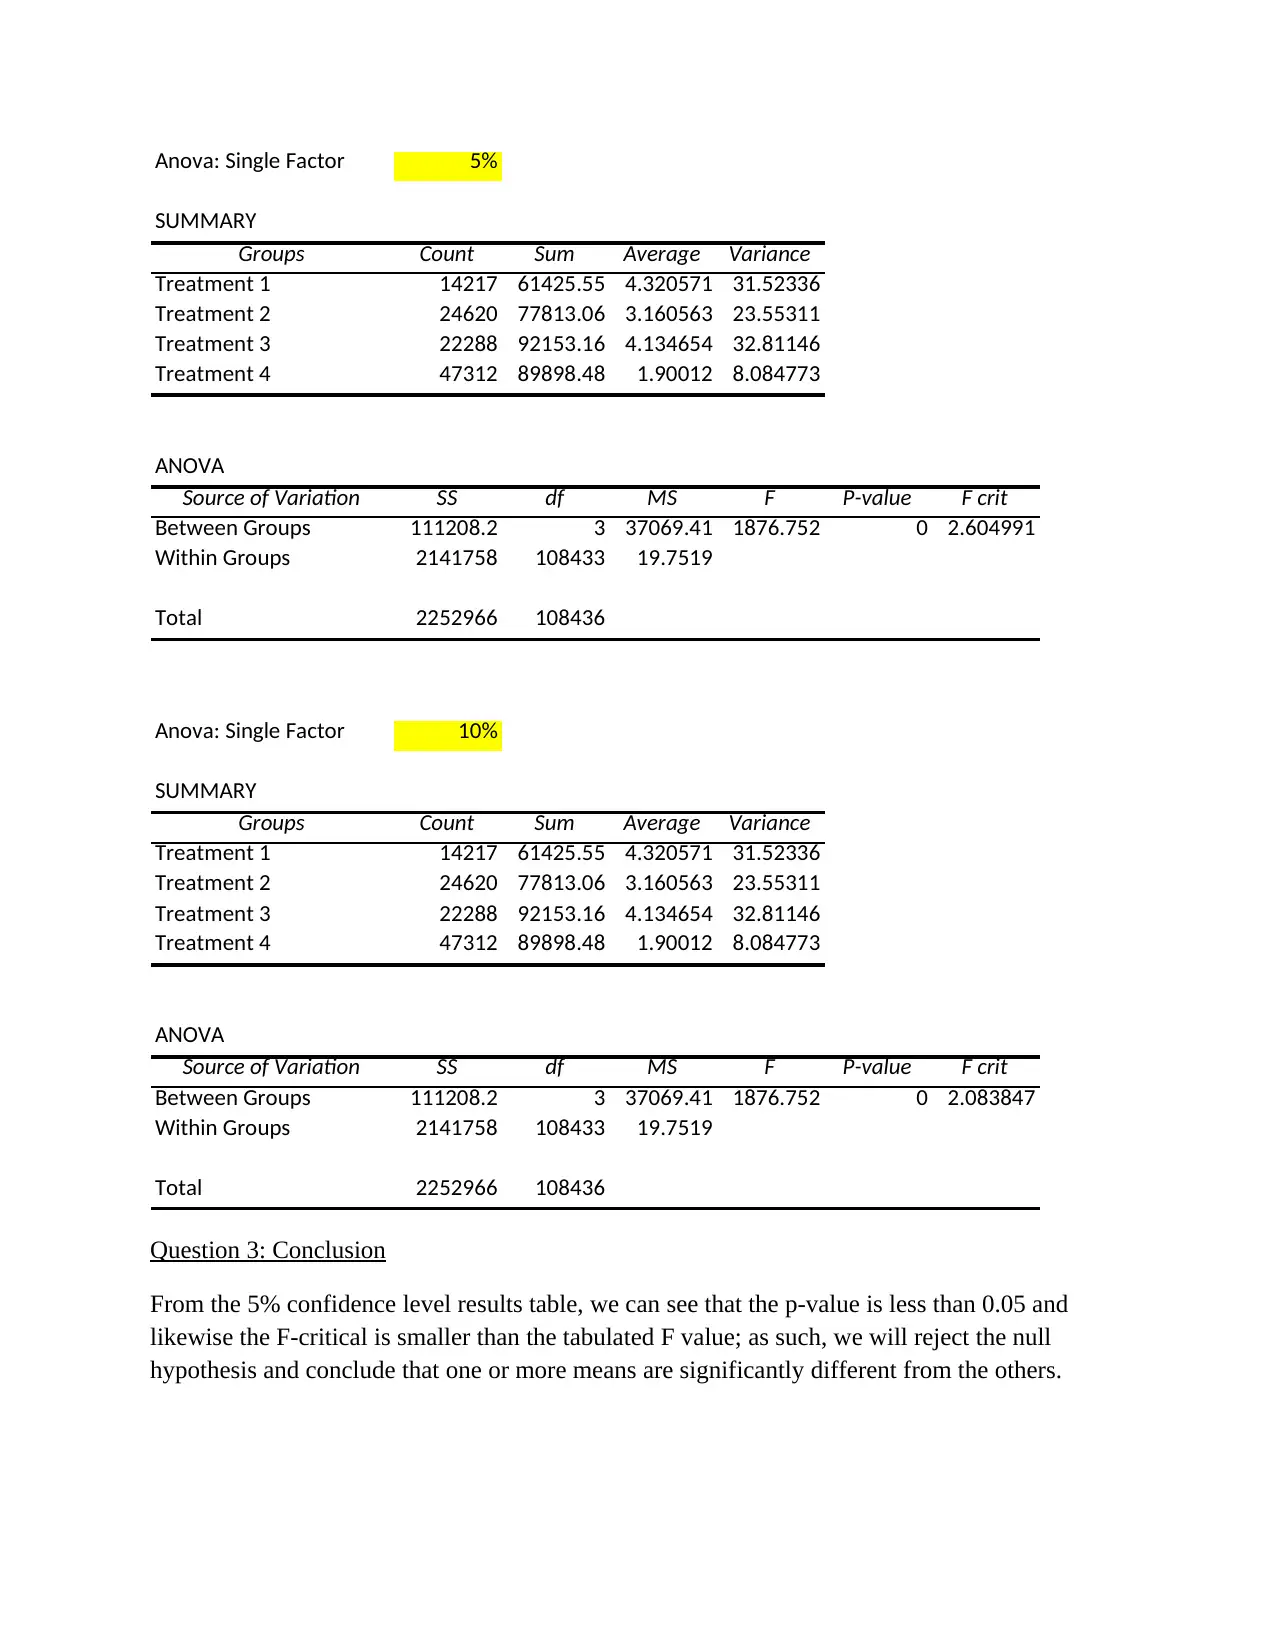
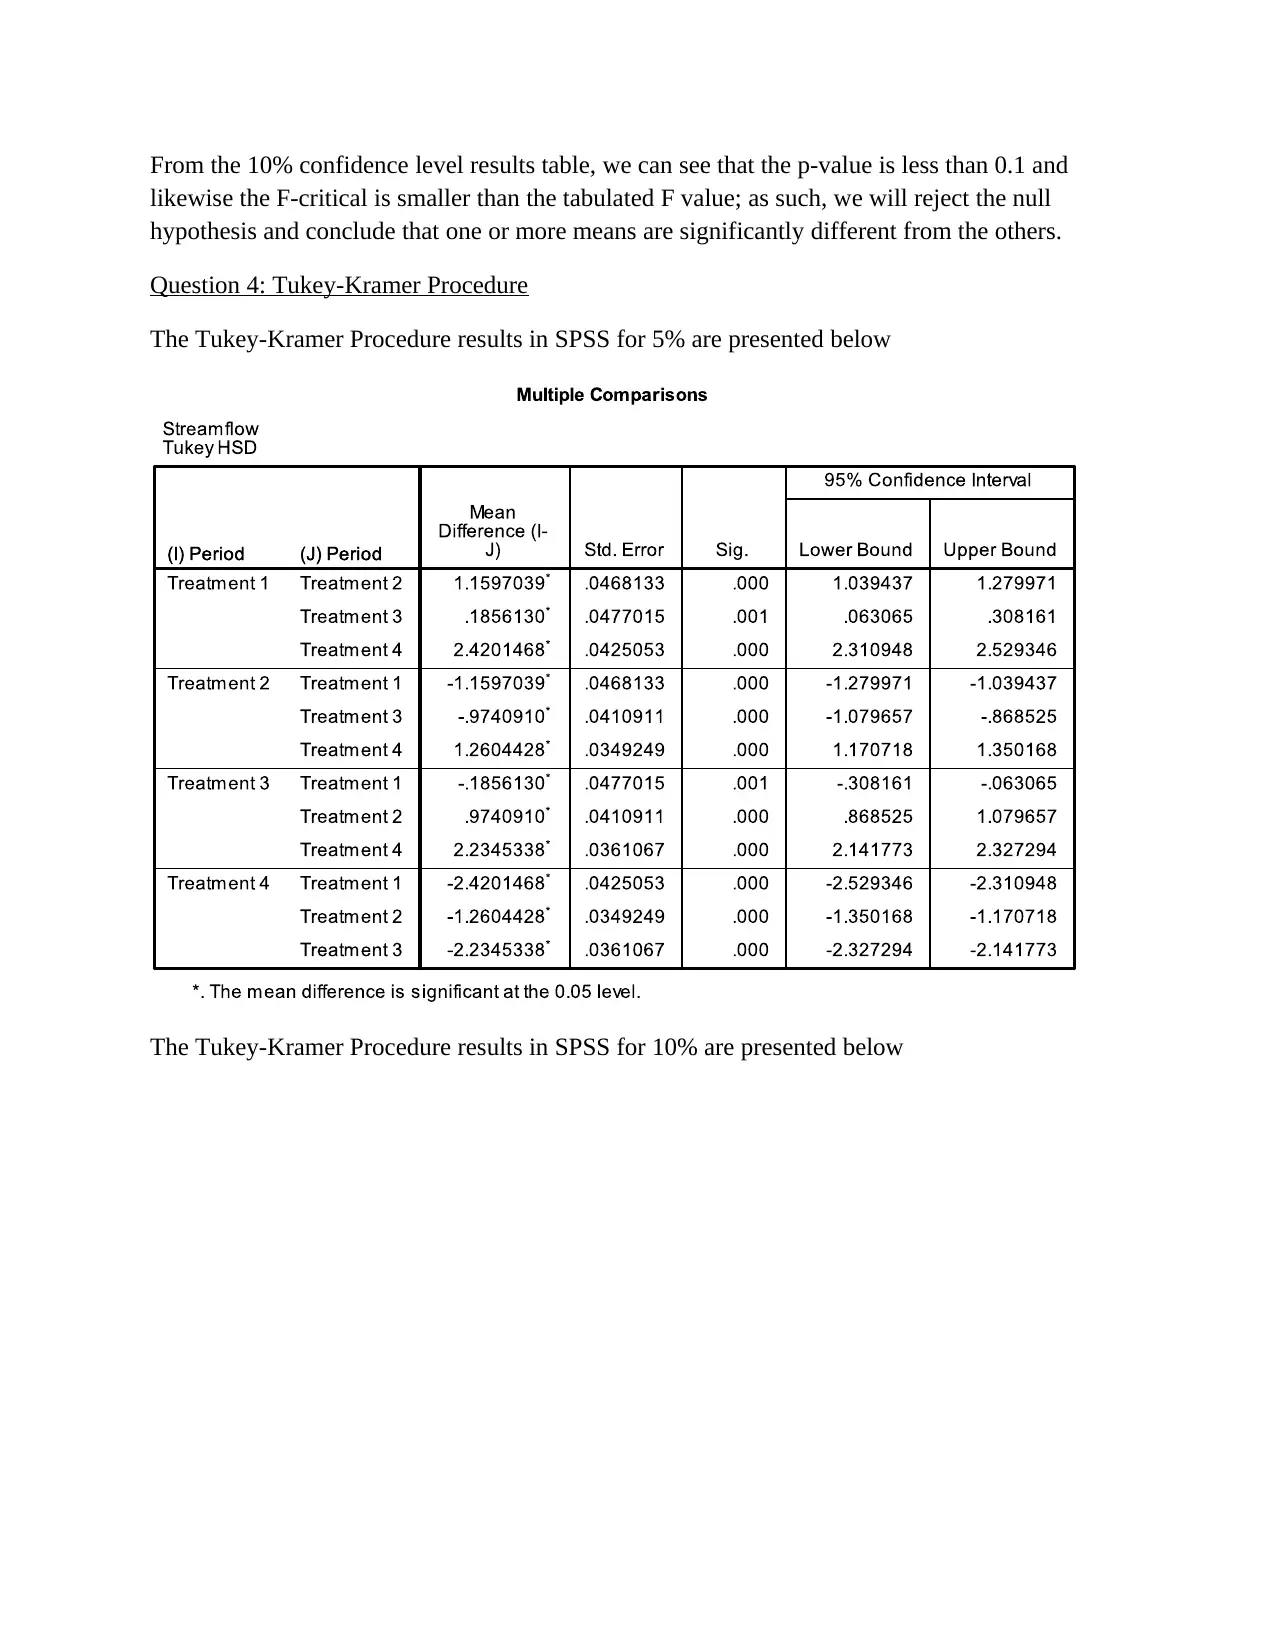
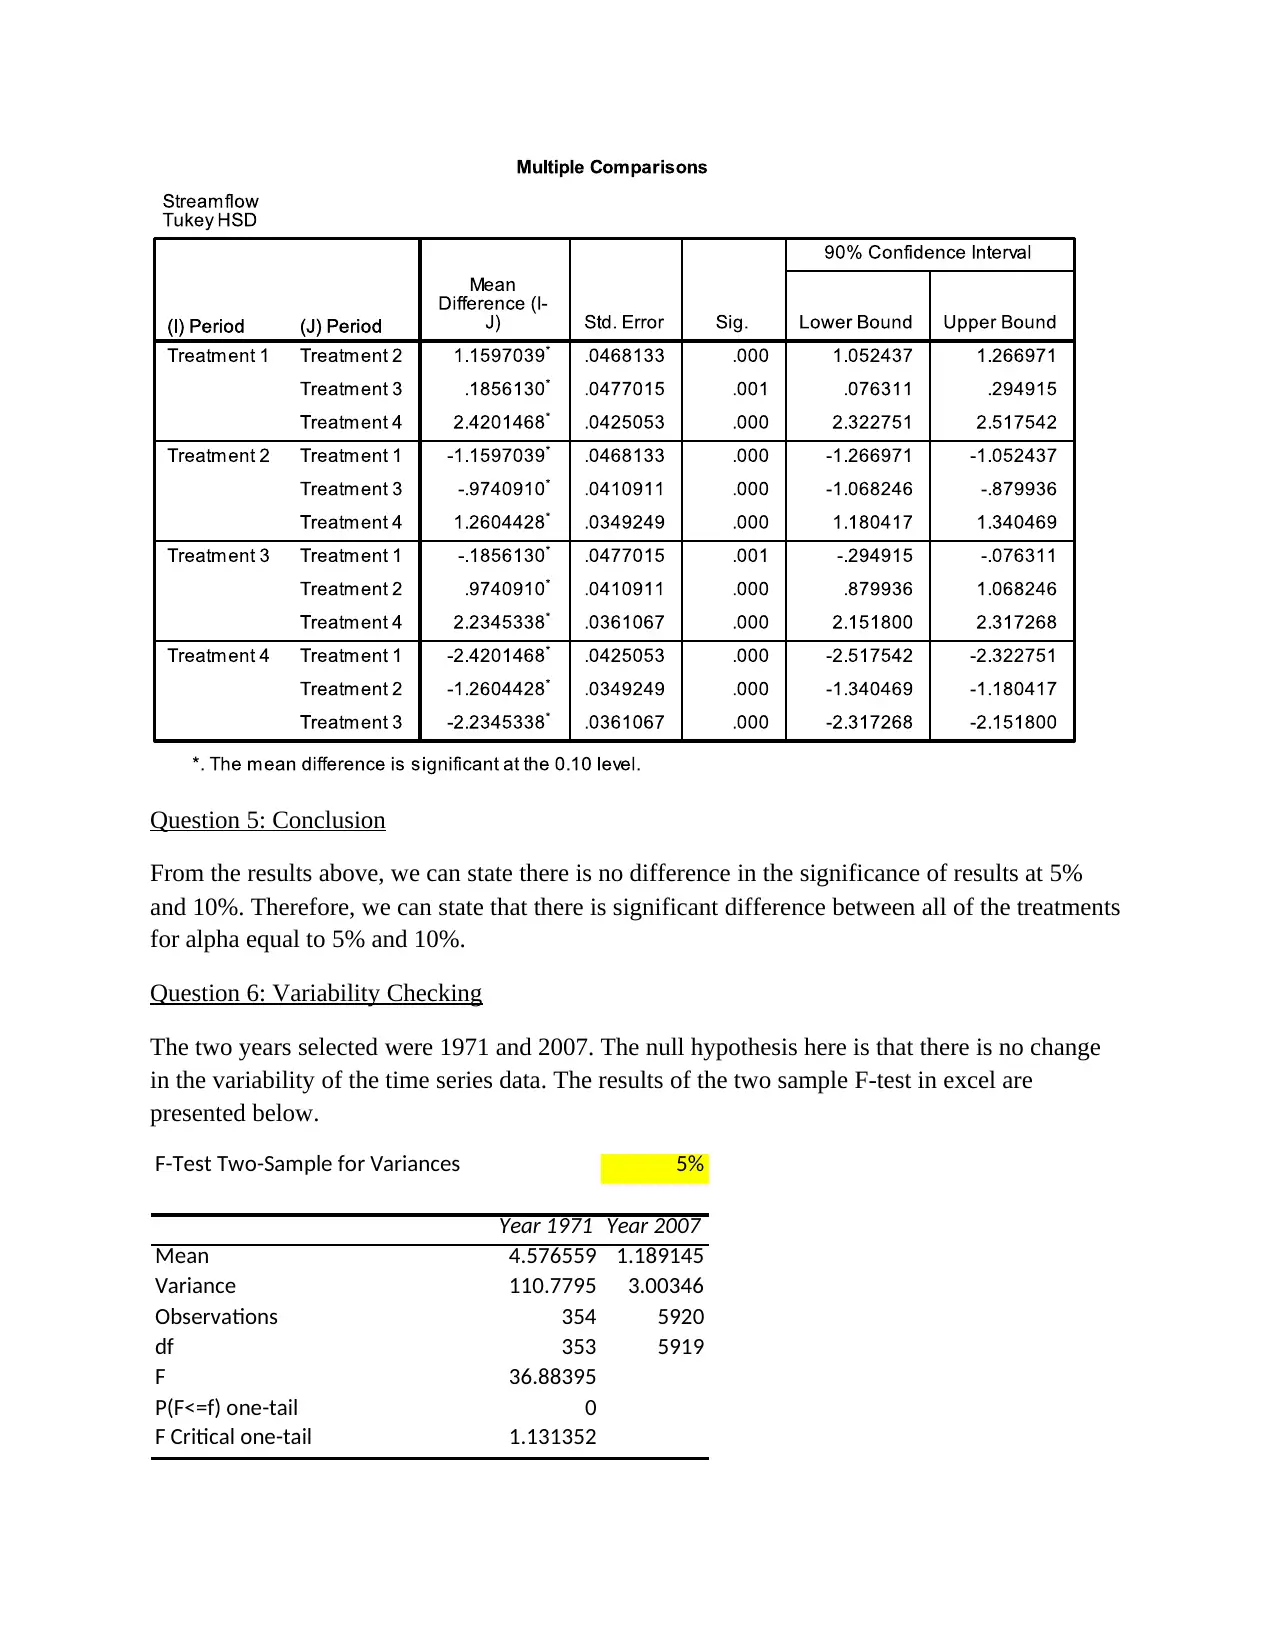
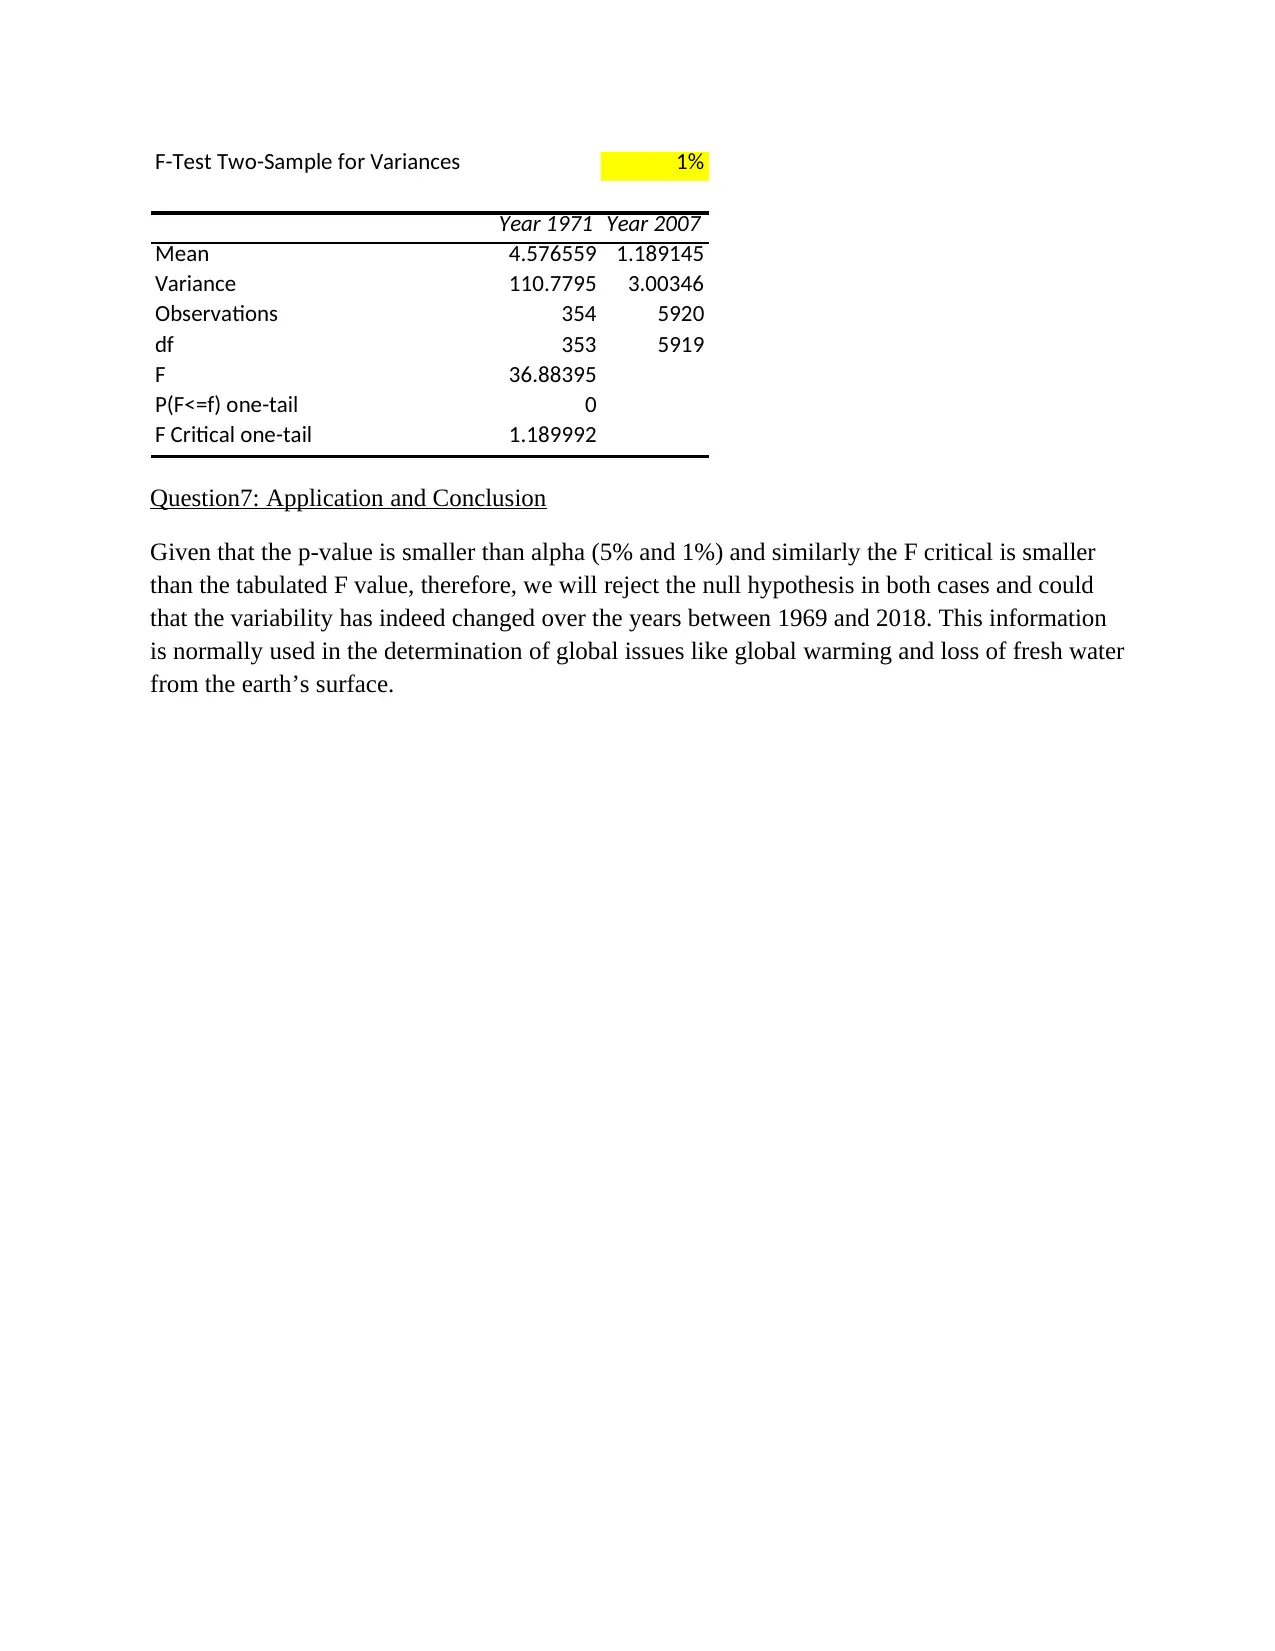
This project analyzes streamflow and rainfall data for the Woori Yallock catchment, focusing on sampling distributions and hypothesis testing. The analysis begins by randomly selecting data and calculating sampling distributions using histograms and descriptive statistics like skewness and kurtosis. The project then calculates probabilities for daily average streamflow exceeding specific values using t-tests. Further, the assignment utilizes ANOVA and the Tukey-Kramer procedure to test for differences in mean streamflow across different time periods. Finally, the project examines variability changes over time using F-tests, connecting findings to broader environmental concerns like global warming and water resource management. The student's solution covers methods, calculations, interpretations, and conclusions for each part of the assignment, demonstrating a comprehensive understanding of statistical analysis applied to hydrological data.
1 out of 9
Related Documents


Your All-in-One AI-Powered Toolkit for Academic Success.
+13062052269
info@desklib.com
Available 24*7 on WhatsApp / Email
![[object Object]](/_next/static/media/star-bottom.7253800d.svg)
Copyright © 2020–2026 A2Z Services. All Rights Reserved. Developed and managed by ZUCOL.