MN2565 Economics for Business Report
VerifiedAdded on 2022/09/12
|10
|1787
|16
AI Summary
Contribute Materials
Your contribution can guide someone’s learning journey. Share your
documents today.

Physics
Title- MN2565 Economics for Business
Title- MN2565 Economics for Business
Secure Best Marks with AI Grader
Need help grading? Try our AI Grader for instant feedback on your assignments.
1 Solution:-
The indifference curves are based on the principle of the 'Diminishing the Marginal rate of substitution
‘or ‘Law of Diminishing Marginal utility.' It means than the increase in the units of x leads to a decrease
in a unit of y with the same amount. The indifference curve shows the substitution between the two
goods and their combing satisfaction. The level of the satisfaction depends upon the diminishing
Marginal Rate that leads the convexity of the IC (indifference curve). It is a graph that represents the
combination of the commodity or goods, which gives the consumer the same utility and satisfaction. For
example- if two products are perfect substitutes of each –other than IC will be a straight line, and MRS
(marginal rate of substitution) will be constant. If two goods or commodities such as water and gasoline
in a car are complementary to each other, then the shape of the IC will be convex or L-shaped to the
origin.
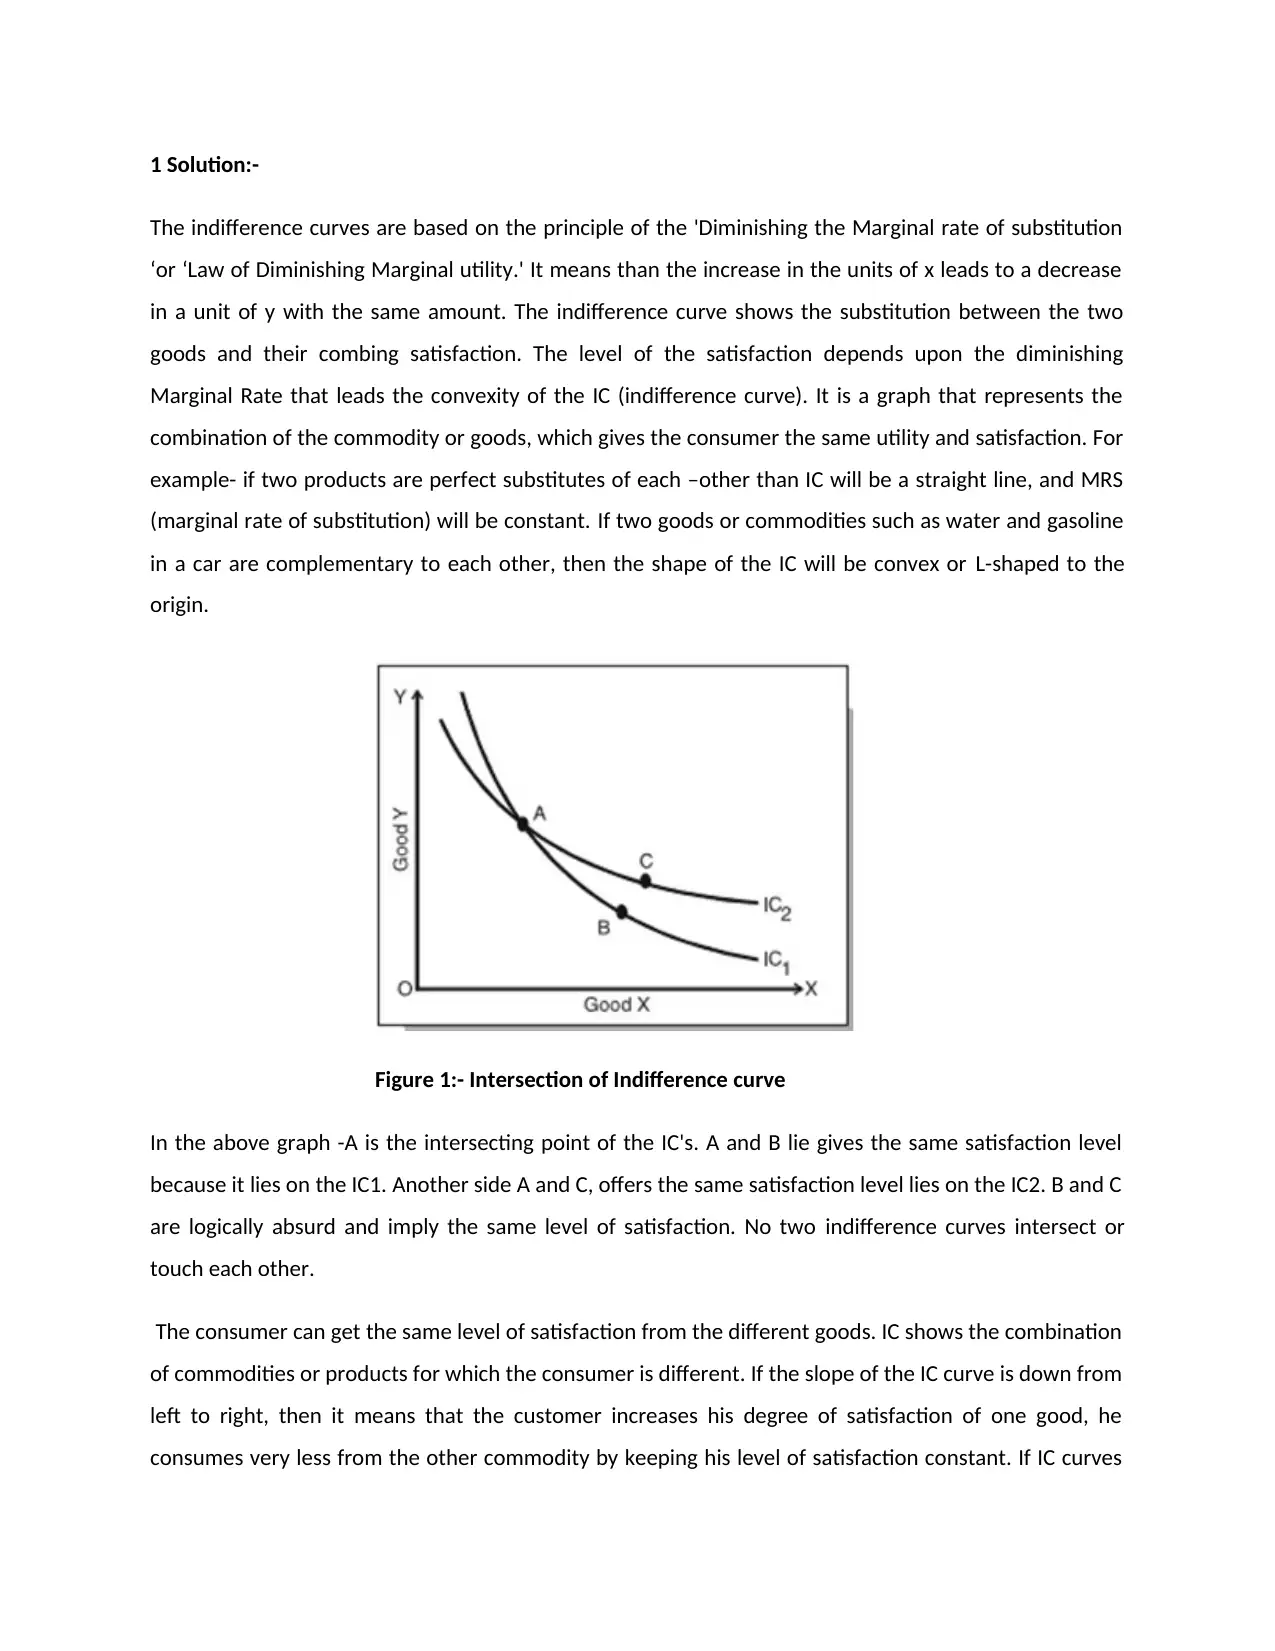
Figure 1:- Intersection of Indifference curve
In the above graph -A is the intersecting point of the IC's. A and B lie gives the same satisfaction level
because it lies on the IC1. Another side A and C, offers the same satisfaction level lies on the IC2. B and C
are logically absurd and imply the same level of satisfaction. No two indifference curves intersect or
touch each other.
The consumer can get the same level of satisfaction from the different goods. IC shows the combination
of commodities or products for which the consumer is different. If the slope of the IC curve is down from
left to right, then it means that the customer increases his degree of satisfaction of one good, he
consumes very less from the other commodity by keeping his level of satisfaction constant. If IC curves
The indifference curves are based on the principle of the 'Diminishing the Marginal rate of substitution
‘or ‘Law of Diminishing Marginal utility.' It means than the increase in the units of x leads to a decrease
in a unit of y with the same amount. The indifference curve shows the substitution between the two
goods and their combing satisfaction. The level of the satisfaction depends upon the diminishing
Marginal Rate that leads the convexity of the IC (indifference curve). It is a graph that represents the
combination of the commodity or goods, which gives the consumer the same utility and satisfaction. For
example- if two products are perfect substitutes of each –other than IC will be a straight line, and MRS
(marginal rate of substitution) will be constant. If two goods or commodities such as water and gasoline
in a car are complementary to each other, then the shape of the IC will be convex or L-shaped to the
origin.
Figure 1:- Intersection of Indifference curve
In the above graph -A is the intersecting point of the IC's. A and B lie gives the same satisfaction level
because it lies on the IC1. Another side A and C, offers the same satisfaction level lies on the IC2. B and C
are logically absurd and imply the same level of satisfaction. No two indifference curves intersect or
touch each other.
The consumer can get the same level of satisfaction from the different goods. IC shows the combination
of commodities or products for which the consumer is different. If the slope of the IC curve is down from
left to right, then it means that the customer increases his degree of satisfaction of one good, he
consumes very less from the other commodity by keeping his level of satisfaction constant. If IC curves
show convex to origin, it means that consumer increases the use of one good over the other, and this
curve shows the 'marginal Rate of Substitution.' It means that the rate at which consumer sacrifices one
good for others.
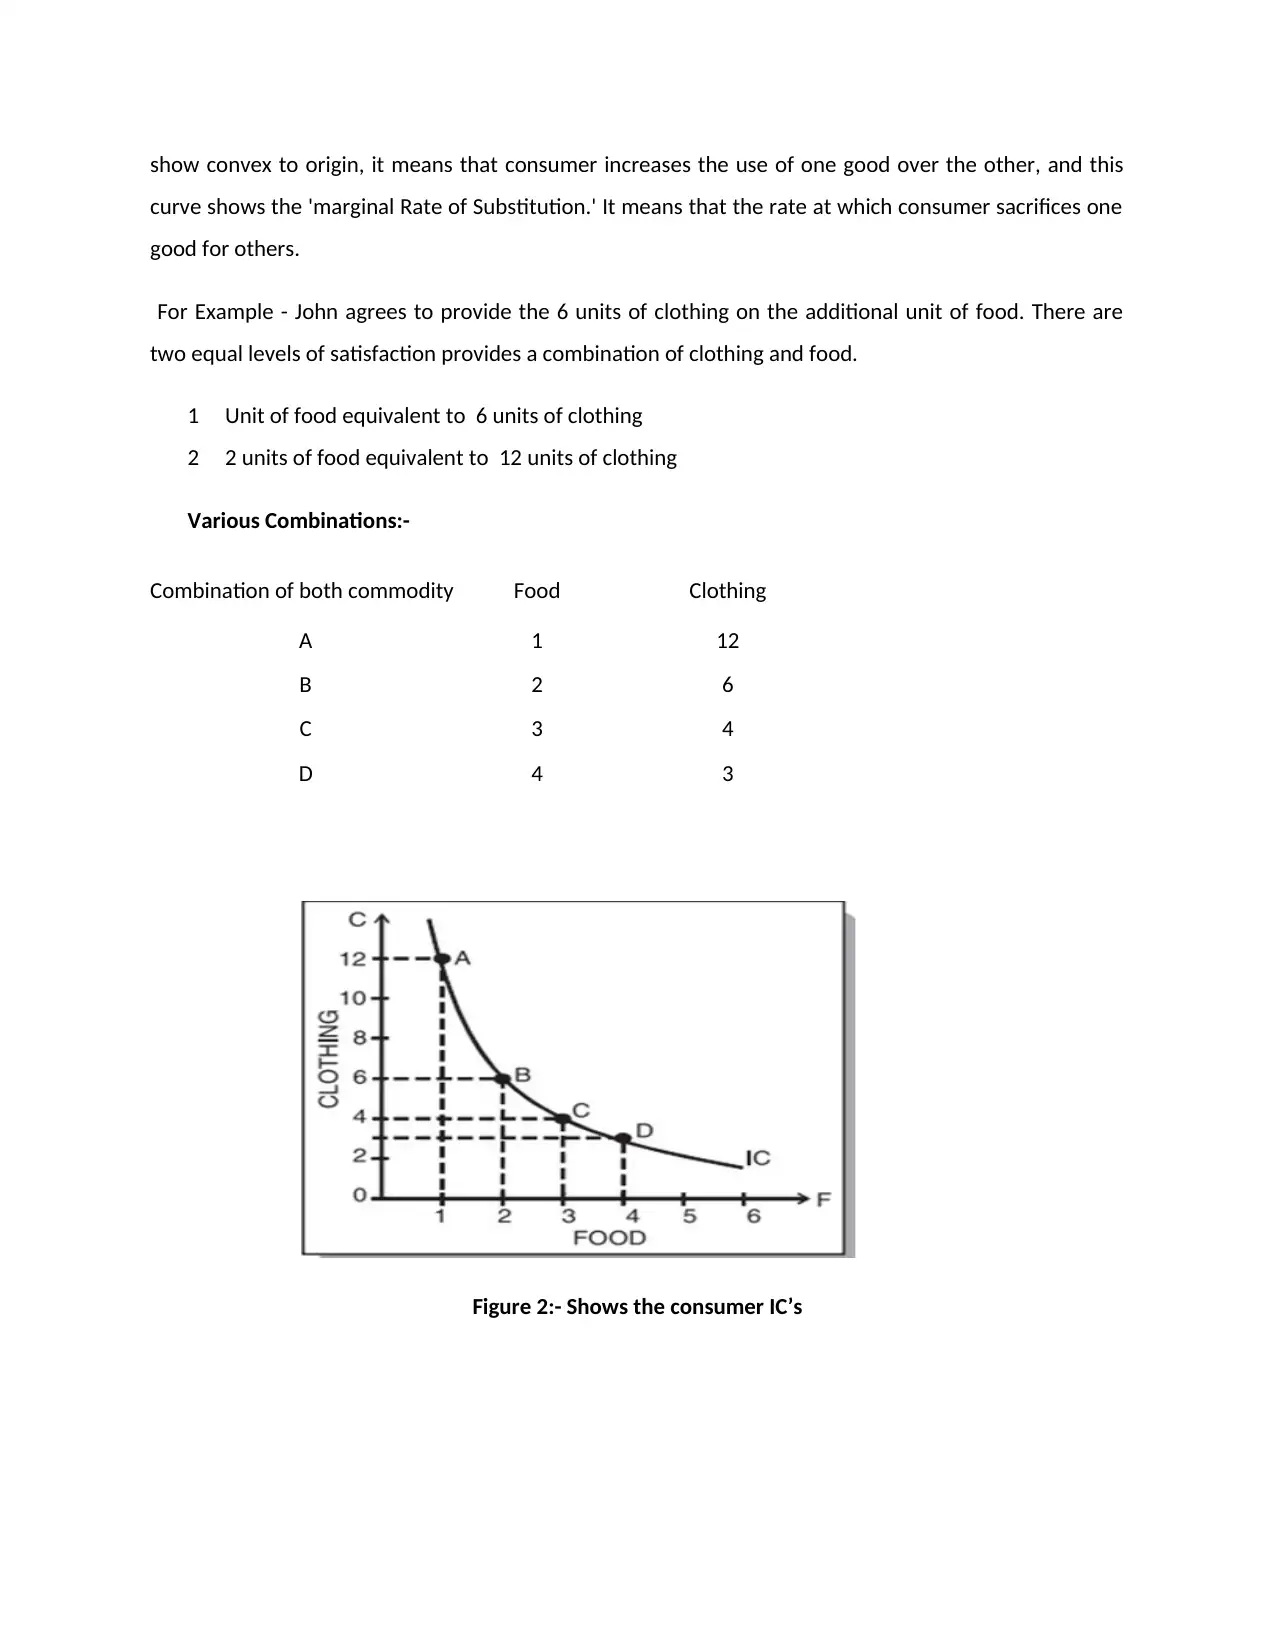
For Example - John agrees to provide the 6 units of clothing on the additional unit of food. There are
two equal levels of satisfaction provides a combination of clothing and food.
1 Unit of food equivalent to 6 units of clothing
2 2 units of food equivalent to 12 units of clothing
Various Combinations:-
Combination of both commodity Food Clothing
A 1 12
B 2 6
C 3 4
D 4 3
Figure 2:- Shows the consumer IC’s
curve shows the 'marginal Rate of Substitution.' It means that the rate at which consumer sacrifices one
good for others.
For Example - John agrees to provide the 6 units of clothing on the additional unit of food. There are
two equal levels of satisfaction provides a combination of clothing and food.
1 Unit of food equivalent to 6 units of clothing
2 2 units of food equivalent to 12 units of clothing
Various Combinations:-
Combination of both commodity Food Clothing
A 1 12
B 2 6
C 3 4
D 4 3
Figure 2:- Shows the consumer IC’s
Therefore Marginal rate of substitution depends upon the consumer choice when he or she gives up one
commodity for another, and the graph of IC becomes convex from the origin. The IC curve cannot be
concave because the marginal rate cannot be increased. This is not possible because consumers cannot
give up one commodity for others. Indifference curves remain convex with the origin because ‘Marginal
Utility’ always decreased with decrease consumption. The formula represents the convex relationship
N = Change in the X commodity / Change in Y commodity
It is based on the idea – ‘twice the marginal rate of the substitution,' based on the Principal -
'Diminishing Marginal Utility.' The reason behind that after consumption of each additional unit leads to
less satisfaction as compared to the original consumed unit. It means that the consumers more prefer
goods which have higher the difference in the curve as compare to the products declines towards the
lower of IC.
2 Solutions:-
ICs curve property is based on the assumption that the 'Marginal Rate of Substitution' between two
goods or commodity X and Y tends to decrease. It is based on the above example because it depends
upon the consumer’s choice. When people obtain too many goods of Y and less amount for good X, then
they will prefer good X instead of good Y. The basis on the law of ‘Diminishing the Marginal
Substitution,' if the amount of Dairy Milk goes up, then the quantity of Kit Kat goes down, and MRS will
be decline.
The price elasticity of demand means the percentage change in the demanded quantity of a commodity
or good, divided by the percentage change in the Price of the commodity. The price elasticity of supply
means the percentage change in supplied quantity divided by the percentage change in the Price of the
commodity.
Demand curves relate to the number of commodities that consumer is willing to purchase, and the cost
of each unit has changed. We know that line of the demand curve is sloping downward, where the
shape of the price-elastic demand curves is a flat or steep line. Therefore, it exhibits that the consumer's
demand is insensitive to the price change of goods funding. The relation between the Price and income
in time represented by the
Ia= X *Px + Y *PY
Ia = Income
Secure Best Marks with AI Grader
Need help grading? Try our AI Grader for instant feedback on your assignments.
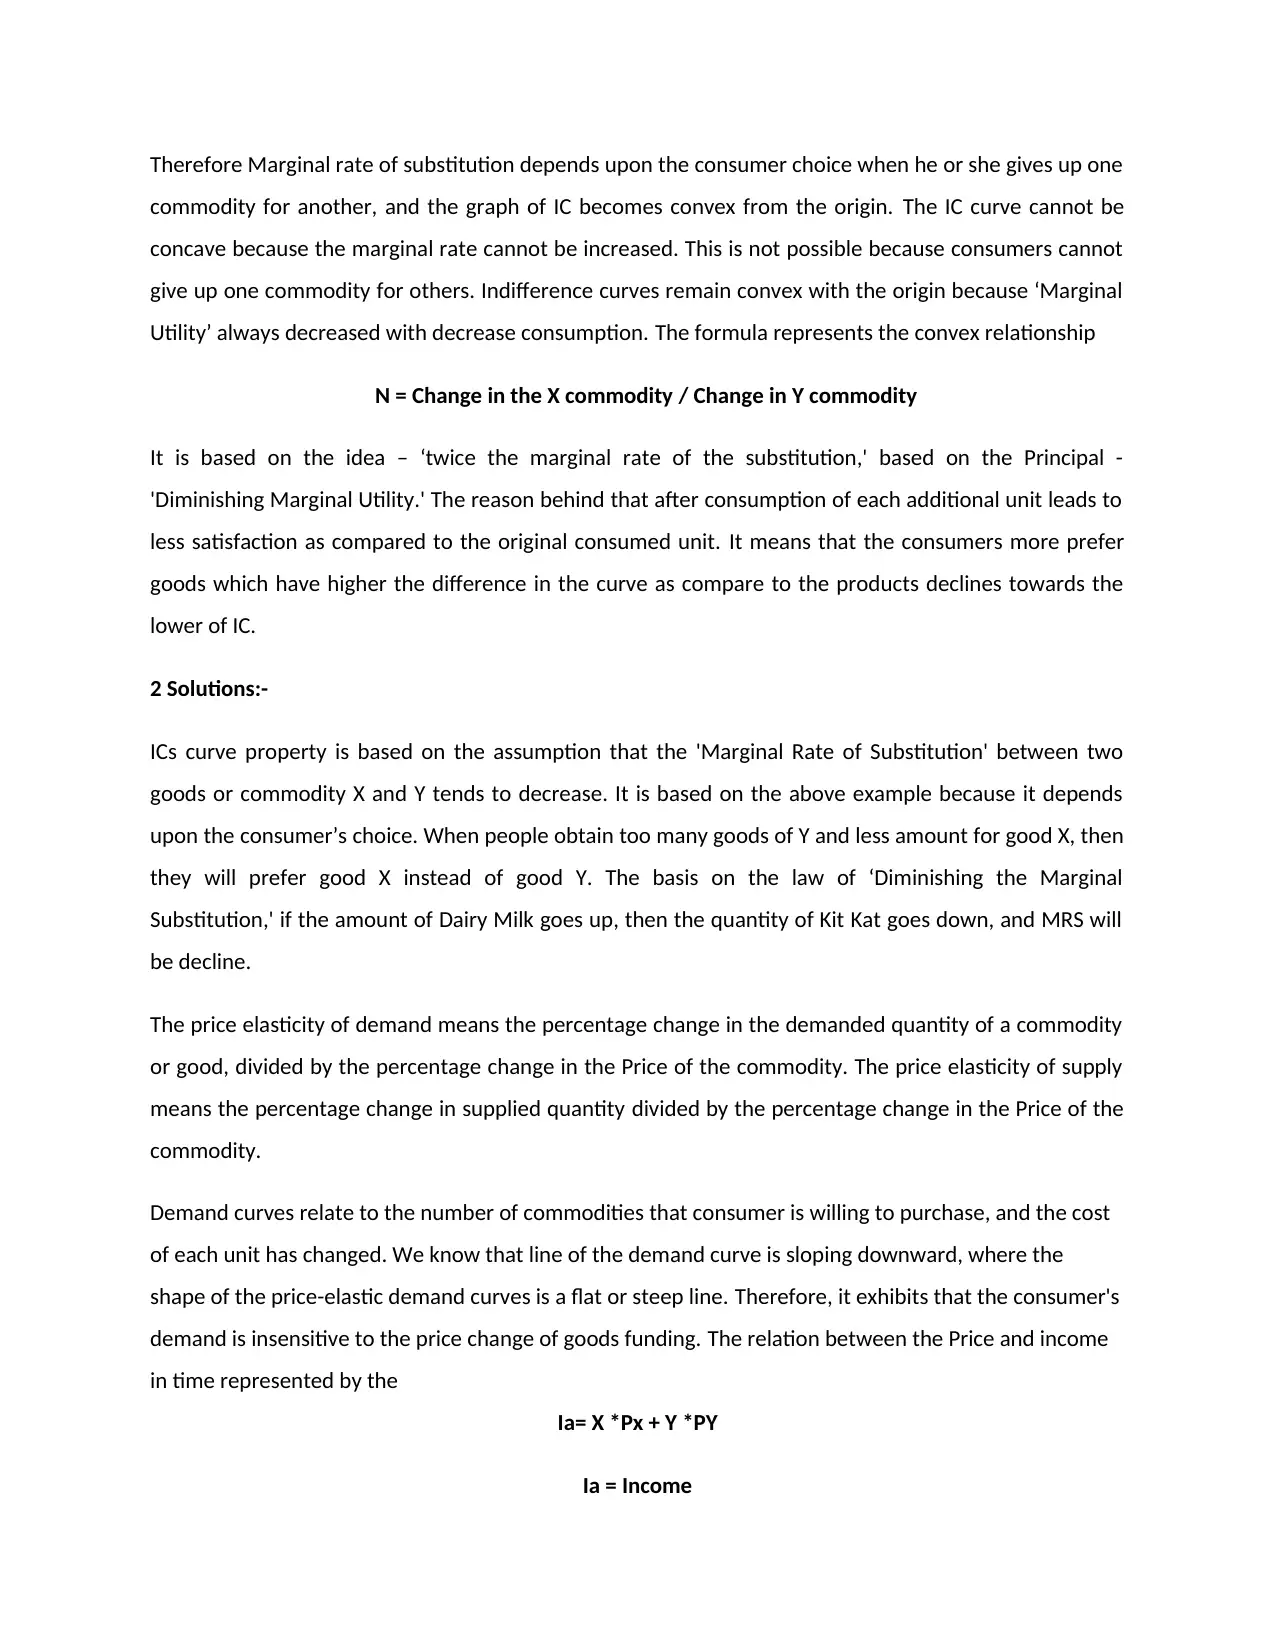
Px = Price of commodity X
PY = Price of commodity Y
Every person has a different indifference map; if the indifference curve moves away, then the level of
satisfaction goes on increases. Most of the peoples prefer the utility of higher level, e.g.:- point D in the
ICs. But the budget line outside the ICs curve shows that consumers cannot afford this. A, B, and C are
the points on the budget lines, which show that these commodities affordable by the consumer. People
mostly like the point from A to B and A to C because A on Ic2 gives a higher level of happiness or
satisfaction, and similarly, Ic1 is also obtainable. The utility of Ic2 is lesser than the Ic1. The utility of the
consumer is maximum when the budget line at the higher indifference curve is tangential. If at the point
A consumption is optimal, then the utility will be maximum, and the MRS will be equal to the relative
Price of both commodities. Consumer choice for both goods satisfy by the following equation
MUX1/MUX2 = p1/p2
Or
MUX1/p1= MUX2/p2 .d
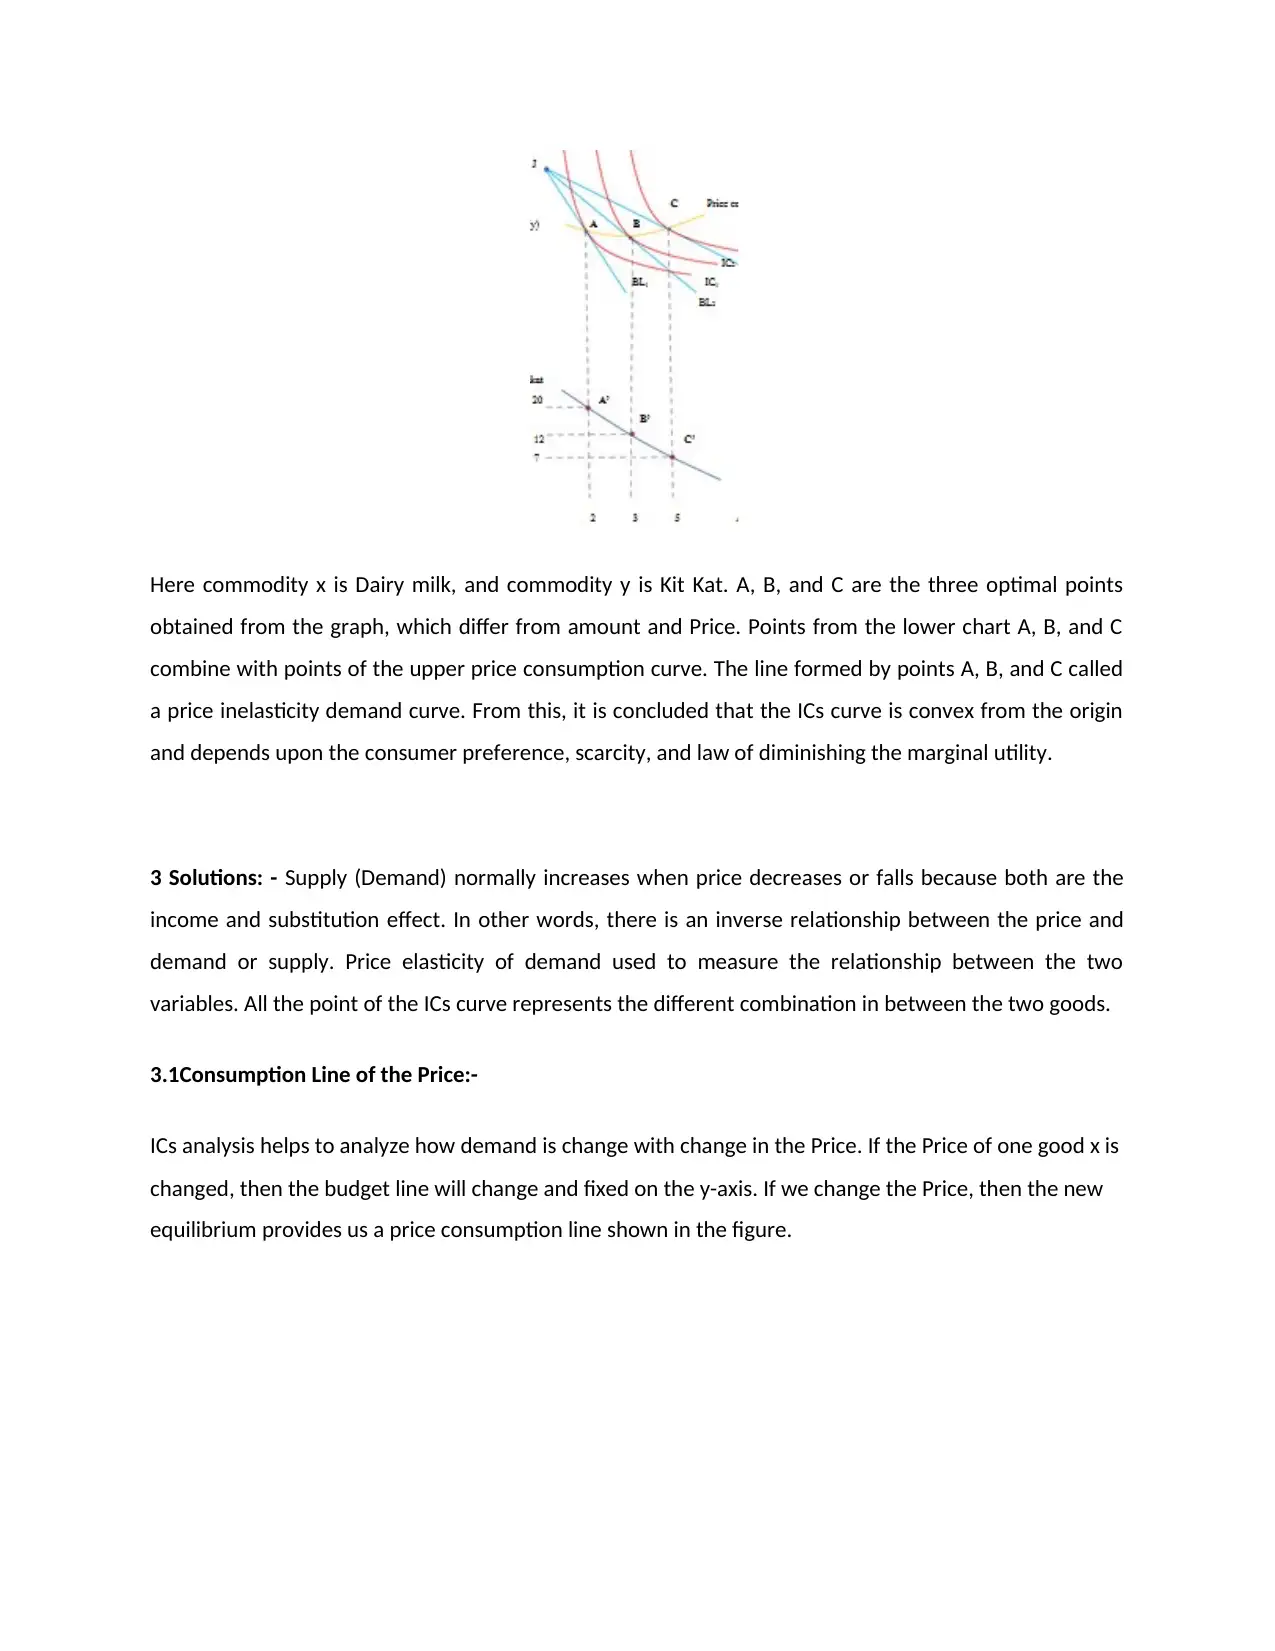
Here commodity x is Dairy milk, and commodity y is Kit Kat. A, B, and C are the three optimal points
obtained from the graph, which differ from amount and Price. Points from the lower chart A, B, and C
combine with points of the upper price consumption curve. The line formed by points A, B, and C called
a price inelasticity demand curve. From this, it is concluded that the ICs curve is convex from the origin
and depends upon the consumer preference, scarcity, and law of diminishing the marginal utility.
3 Solutions: - Supply (Demand) normally increases when price decreases or falls because both are the
income and substitution effect. In other words, there is an inverse relationship between the price and
demand or supply. Price elasticity of demand used to measure the relationship between the two
variables. All the point of the ICs curve represents the different combination in between the two goods.
3.1Consumption Line of the Price:-
ICs analysis helps to analyze how demand is change with change in the Price. If the Price of one good x is
changed, then the budget line will change and fixed on the y-axis. If we change the Price, then the new
equilibrium provides us a price consumption line shown in the figure.
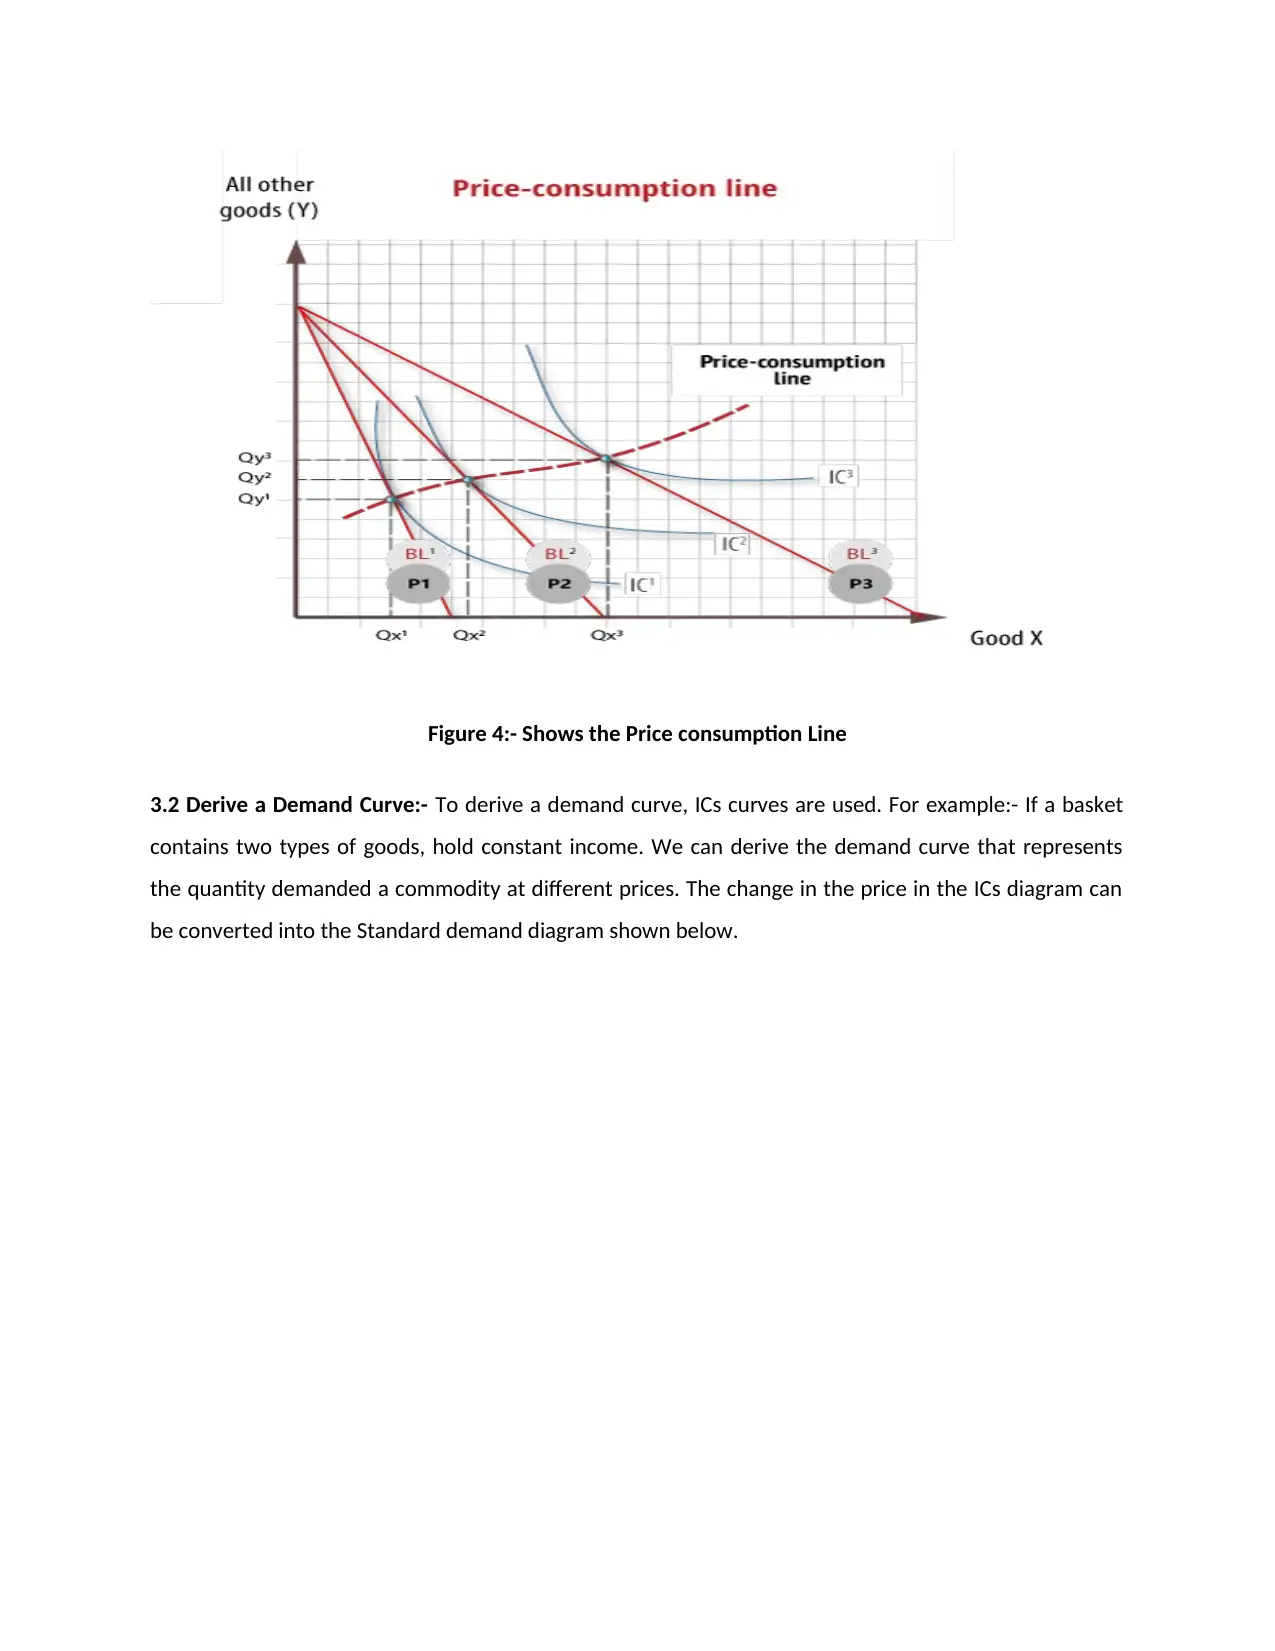
Figure 4:- Shows the Price consumption Line
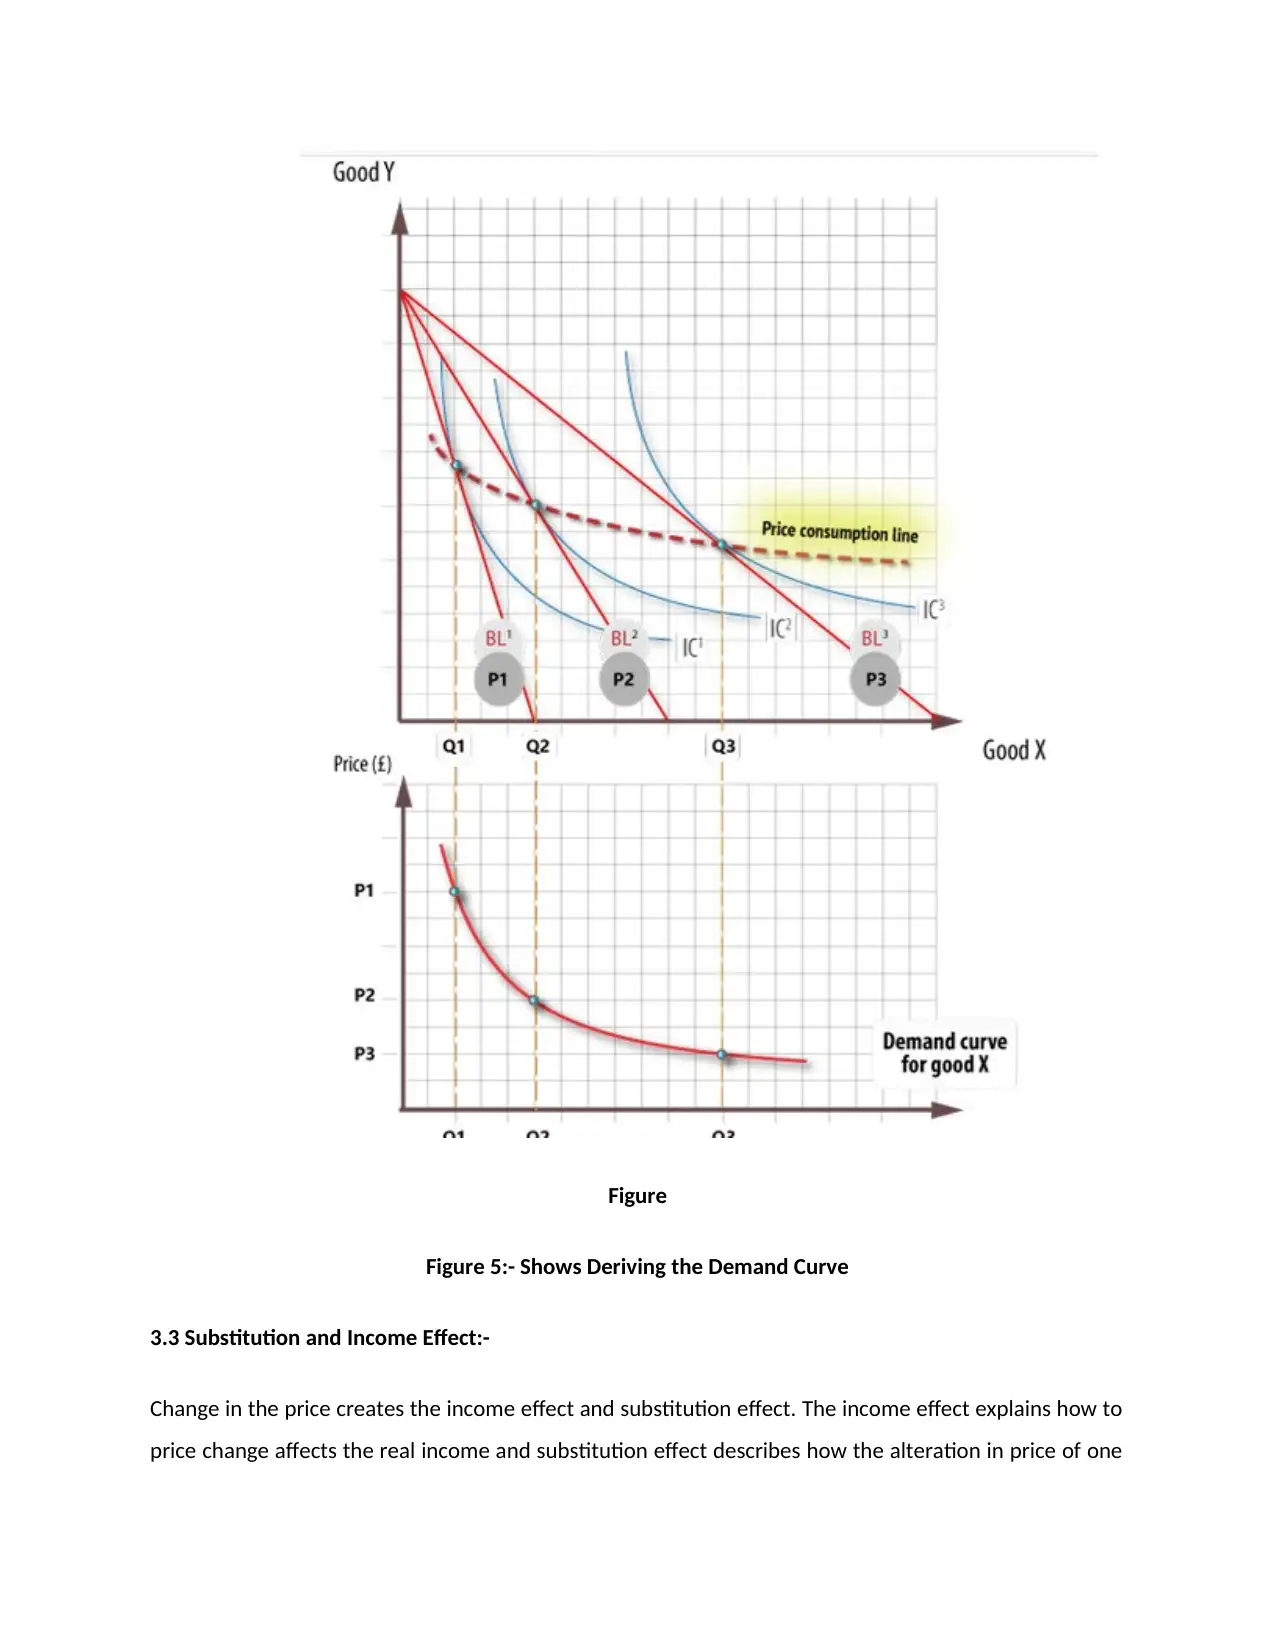
3.2 Derive a Demand Curve:- To derive a demand curve, ICs curves are used. For example:- If a basket
contains two types of goods, hold constant income. We can derive the demand curve that represents
the quantity demanded a commodity at different prices. The change in the price in the ICs diagram can
be converted into the Standard demand diagram shown below.
Paraphrase This Document
Need a fresh take? Get an instant paraphrase of this document with our AI Paraphraser
Figure
Figure 5:- Shows Deriving the Demand Curve
3.3 Substitution and Income Effect:-
Change in the price creates the income effect and substitution effect. The income effect explains how to
price change affects the real income and substitution effect describes how the alteration in price of one
Figure 5:- Shows Deriving the Demand Curve
3.3 Substitution and Income Effect:-
Change in the price creates the income effect and substitution effect. The income effect explains how to
price change affects the real income and substitution effect describes how the alteration in price of one
good shifts the demand to other good. In term of ICs, the substitution effect can be obtained from the
gradient of the budget line when it moves outward or inward. Outward when price increases or outward
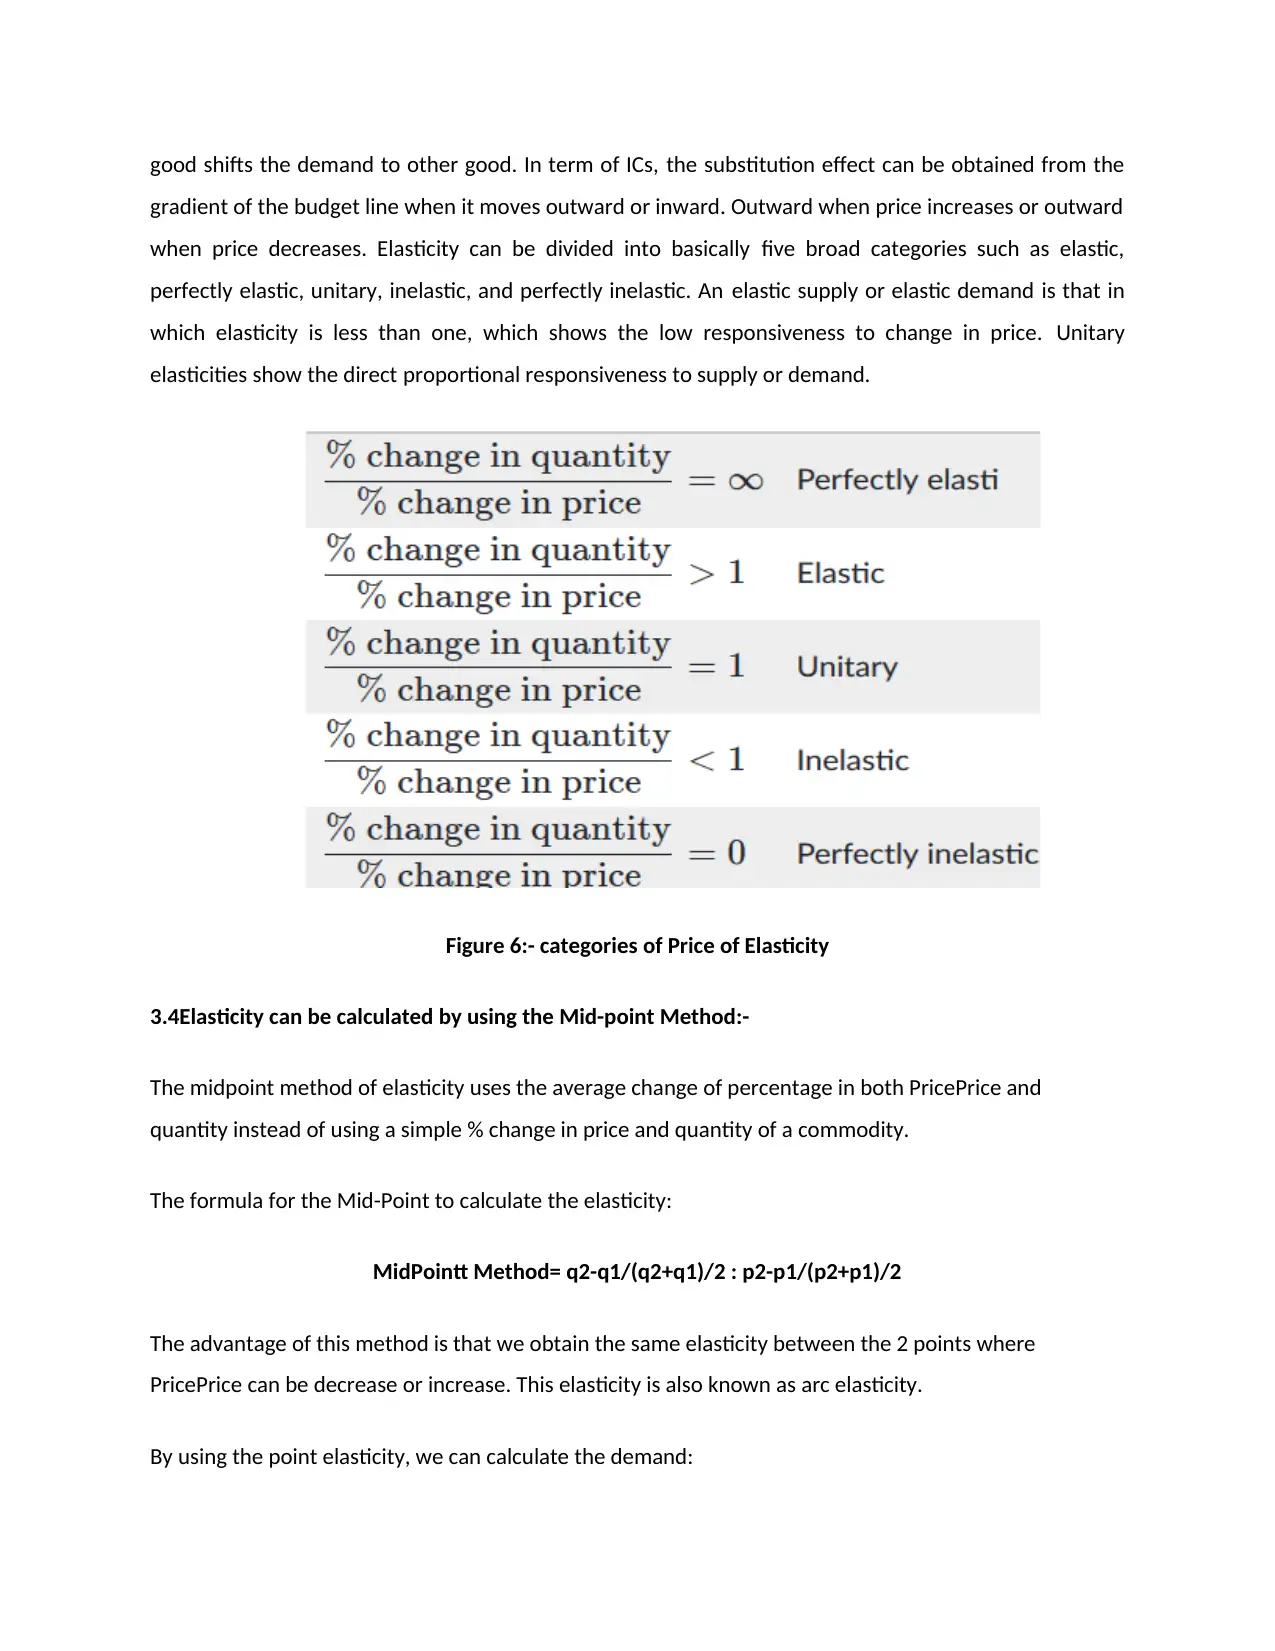
when price decreases. Elasticity can be divided into basically five broad categories such as elastic,
perfectly elastic, unitary, inelastic, and perfectly inelastic. An elastic supply or elastic demand is that in
which elasticity is less than one, which shows the low responsiveness to change in price. Unitary
elasticities show the direct proportional responsiveness to supply or demand.
Figure 6:- categories of Price of Elasticity
3.4Elasticity can be calculated by using the Mid-point Method:-
The midpoint method of elasticity uses the average change of percentage in both PricePrice and
quantity instead of using a simple % change in price and quantity of a commodity.
The formula for the Mid-Point to calculate the elasticity:
MidPointt Method= q2-q1/(q2+q1)/2 : p2-p1/(p2+p1)/2
The advantage of this method is that we obtain the same elasticity between the 2 points where
PricePrice can be decrease or increase. This elasticity is also known as arc elasticity.
By using the point elasticity, we can calculate the demand:
gradient of the budget line when it moves outward or inward. Outward when price increases or outward
when price decreases. Elasticity can be divided into basically five broad categories such as elastic,
perfectly elastic, unitary, inelastic, and perfectly inelastic. An elastic supply or elastic demand is that in
which elasticity is less than one, which shows the low responsiveness to change in price. Unitary
elasticities show the direct proportional responsiveness to supply or demand.
Figure 6:- categories of Price of Elasticity
3.4Elasticity can be calculated by using the Mid-point Method:-
The midpoint method of elasticity uses the average change of percentage in both PricePrice and
quantity instead of using a simple % change in price and quantity of a commodity.
The formula for the Mid-Point to calculate the elasticity:
MidPointt Method= q2-q1/(q2+q1)/2 : p2-p1/(p2+p1)/2
The advantage of this method is that we obtain the same elasticity between the 2 points where
PricePrice can be decrease or increase. This elasticity is also known as arc elasticity.
By using the point elasticity, we can calculate the demand:

The midpoint method has a drawback that if two points are far from each – other, then elasticity can
lose its meaning. For this reason, point elasticity is preferred by some economists. In this, we need to
know the initial value and new values.
Point Elasticity Method= (new q - initial q)/initial q : (new p - initial p)/initial p
lose its meaning. For this reason, point elasticity is preferred by some economists. In this, we need to
know the initial value and new values.
Point Elasticity Method= (new q - initial q)/initial q : (new p - initial p)/initial p
1 out of 10
Related Documents


Your All-in-One AI-Powered Toolkit for Academic Success.
+13062052269
info@desklib.com
Available 24*7 on WhatsApp / Email
![[object Object]](/_next/static/media/star-bottom.7253800d.svg)
Unlock your academic potential
© 2024 | Zucol Services PVT LTD | All rights reserved.