logo

Financial Analysis of Vodafone Group

Bharti Airtel Limited's Integrated Report and Annual Accounts for the year 2017-18, Vodafone Group Plc's Annual Report for 2017, Deutsche Telekom's Financial Year 2017 report, and a financial report for an unspecified company for the year 2017.

15 Pages3228 Words66 Views
   

Added on  2022-11-25

About This Document

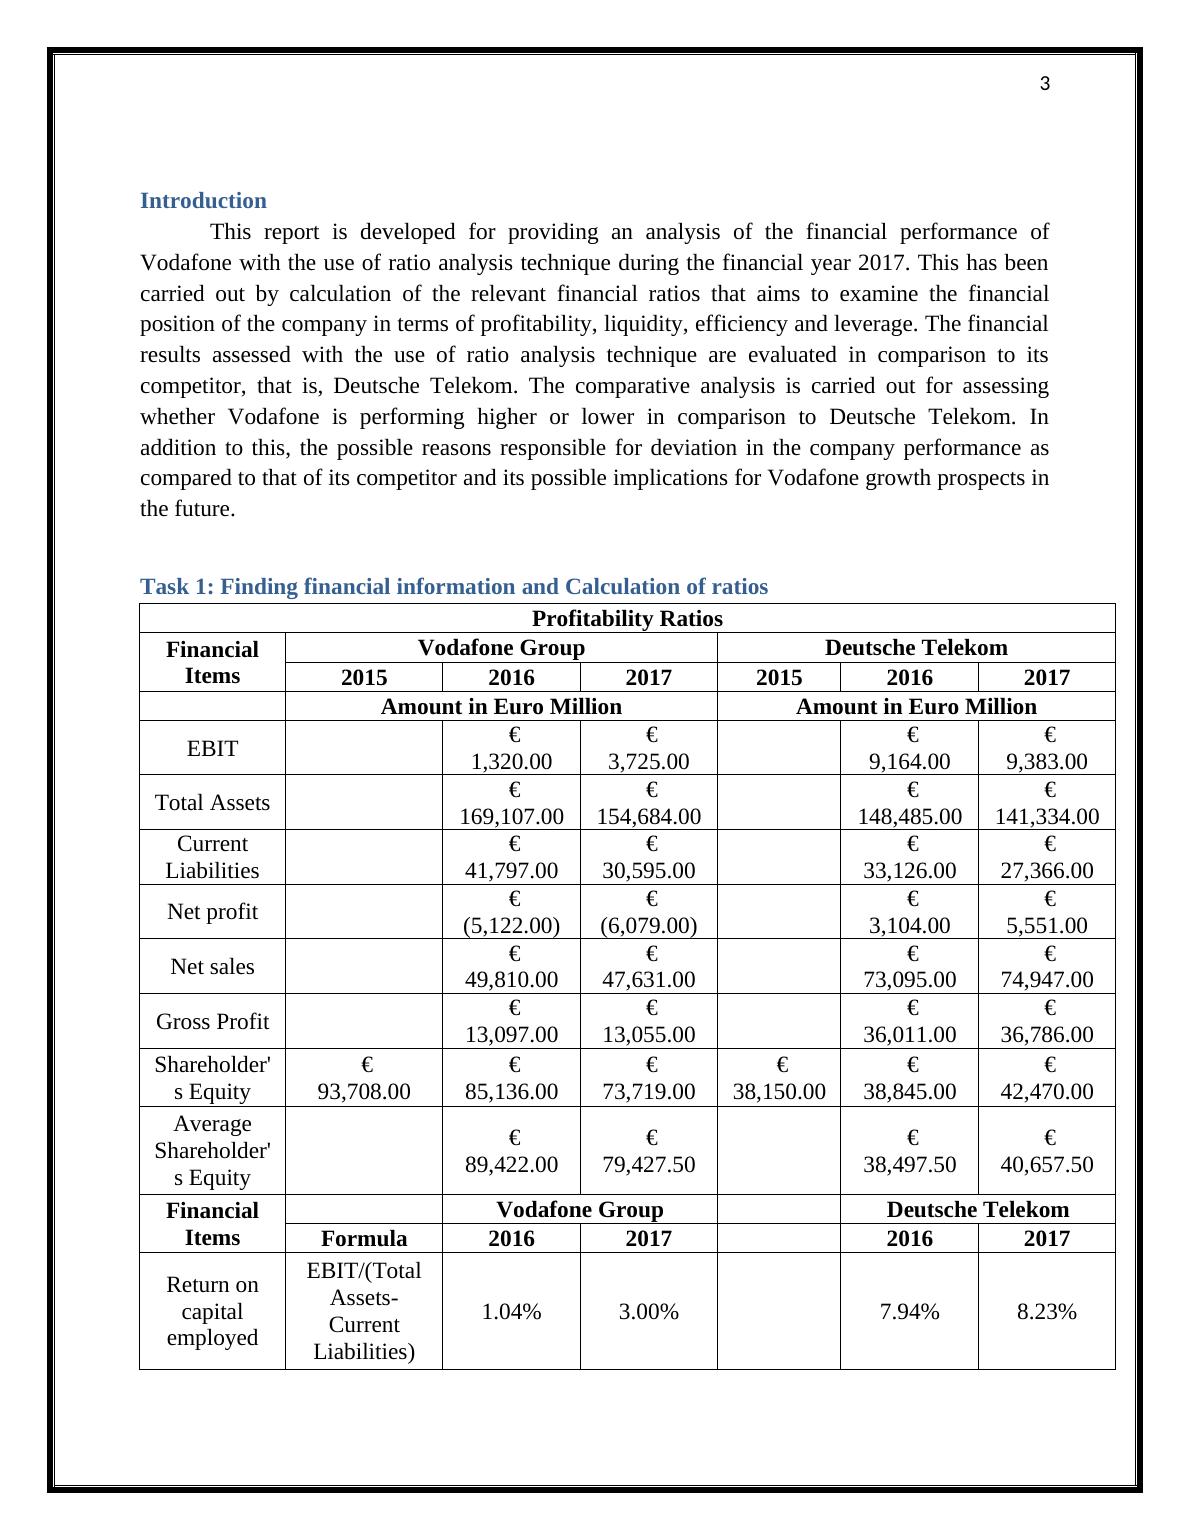
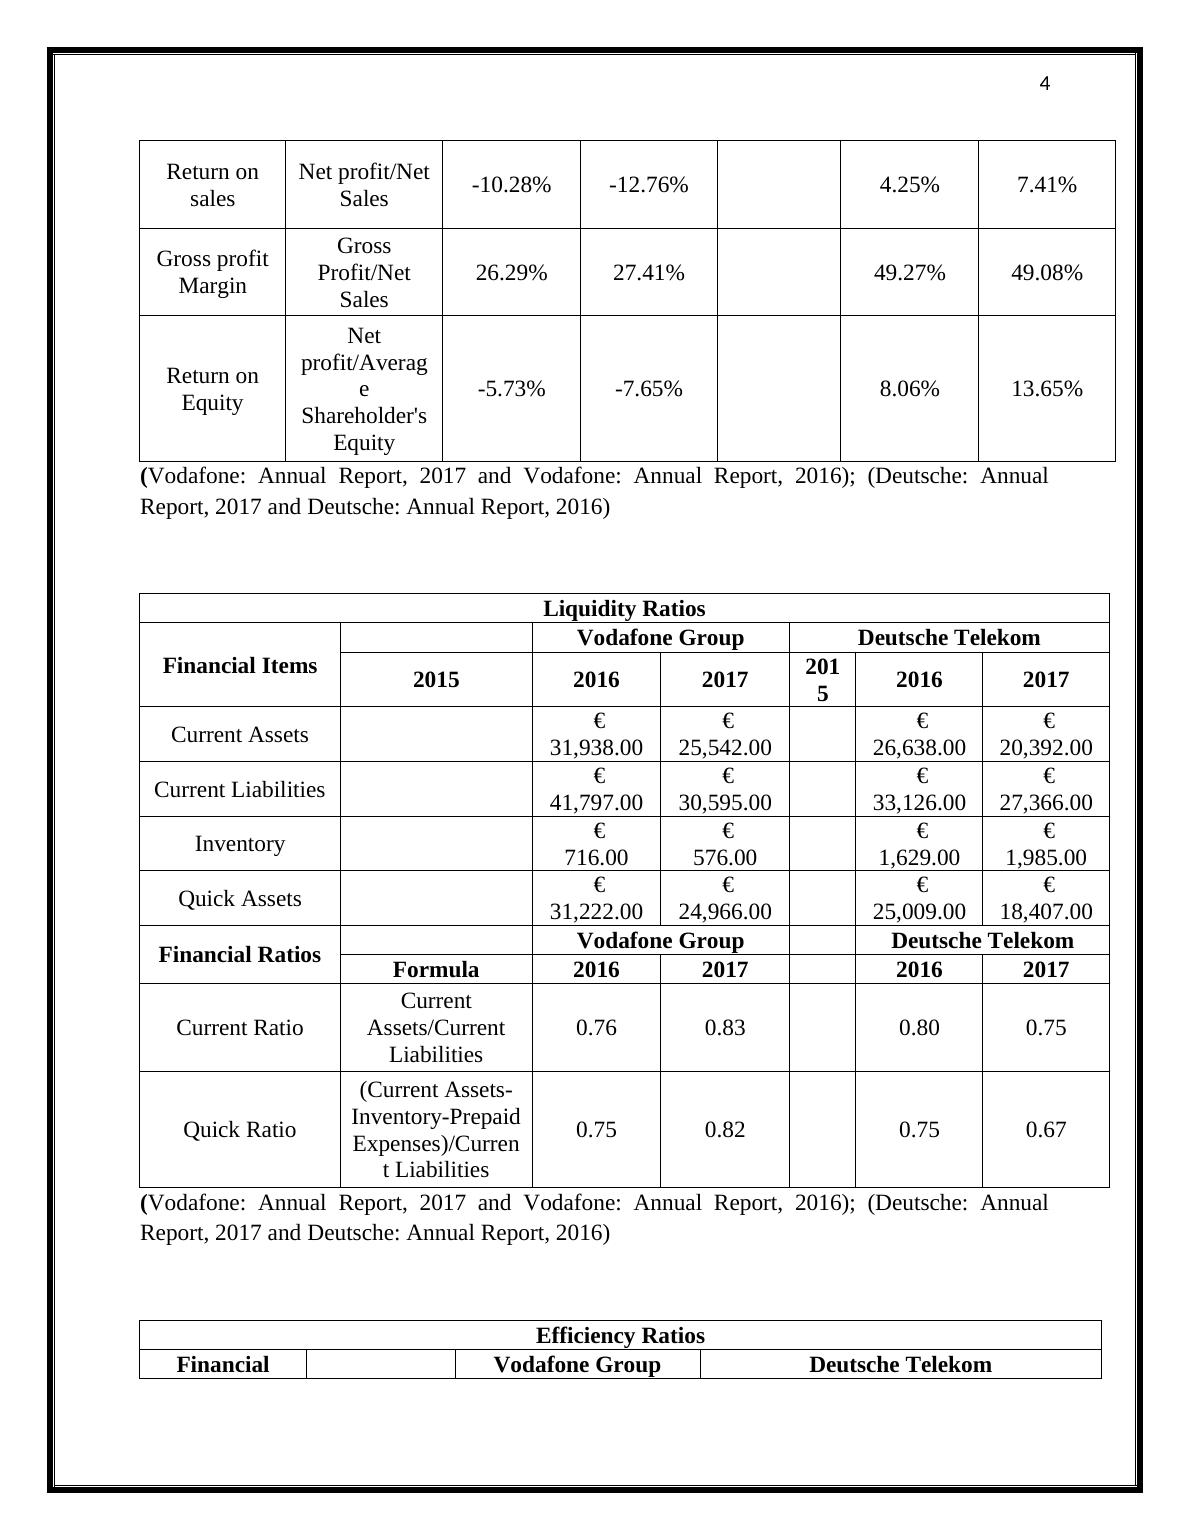
This report provides an analysis of the financial performance of Vodafone with the use of ratio analysis technique during the financial year 2017. It includes profitability, liquidity, efficiency and leverage analysis. The results are compared to its competitor, Deutsche Telekom.

Financial Analysis of Vodafone Group

Bharti Airtel Limited's Integrated Report and Annual Accounts for the year 2017-18, Vodafone Group Plc's Annual Report for 2017, Deutsche Telekom's Financial Year 2017 report, and a financial report for an unspecified company for the year 2017.

   Added on 2022-11-25

ShareRelated Documents
1
Financial Analysis of Vodafone Group
Financial Analysis of Vodafone Group_1
2
Contents
Introduction......................................................................................................................................3
Task 1: Finding financial information and Calculation of ratios.....................................................3
Task 2: Financial Performance Analysis of Vodafone as Compared to Deutsche Telekom with
the use of Ratio Analysis.................................................................................................................6
Profitability Analysis.......................................................................................................................6
Return on Capital Employed (ROCE).........................................................................................7
Return on Sales............................................................................................................................8
Gross Profit Margin.....................................................................................................................8
Return on Equity..........................................................................................................................8
Liquidity Analysis...........................................................................................................................9
Current Ratio................................................................................................................................9
Quick Ratio..................................................................................................................................9
Efficiency Analysis........................................................................................................................10
Asset Utilization Ratio...............................................................................................................11
Stock Days.................................................................................................................................11
Current trade receivable days.....................................................................................................11
Current trade payable days.........................................................................................................11
Solvency Analysis.........................................................................................................................12
Gearing Ratio.............................................................................................................................12
Interest Coverage ratio...............................................................................................................12
Overall Assessment of Vodafone Financial Performance as Compared to Deutsche Telecom....13
Conclusion.....................................................................................................................................13
References......................................................................................................................................14
Financial Analysis of Vodafone Group_2
3
Introduction
This report is developed for providing an analysis of the financial performance of
Vodafone with the use of ratio analysis technique during the financial year 2017. This has been
carried out by calculation of the relevant financial ratios that aims to examine the financial
position of the company in terms of profitability, liquidity, efficiency and leverage. The financial
results assessed with the use of ratio analysis technique are evaluated in comparison to its
competitor, that is, Deutsche Telekom. The comparative analysis is carried out for assessing
whether Vodafone is performing higher or lower in comparison to Deutsche Telekom. In
addition to this, the possible reasons responsible for deviation in the company performance as
compared to that of its competitor and its possible implications for Vodafone growth prospects in
the future.
Task 1: Finding financial information and Calculation of ratios
Profitability Ratios
Financial
Items
Vodafone Group Deutsche Telekom
2015 2016 2017 2015 2016 2017
Amount in Euro Million Amount in Euro Million
EBIT
1,320.00

3,725.00

9,164.00

9,383.00
Total Assets
169,107.00

154,684.00

148,485.00

141,334.00
Current
Liabilities

41,797.00

30,595.00

33,126.00

27,366.00
Net profit
(5,122.00)

(6,079.00)

3,104.00

5,551.00
Net sales
49,810.00

47,631.00

73,095.00

74,947.00
Gross Profit
13,097.00

13,055.00

36,011.00

36,786.00
Shareholder'
s Equity

93,708.00

85,136.00

73,719.00

38,150.00

38,845.00

42,470.00
Average
Shareholder'
s Equity

89,422.00

79,427.50

38,497.50

40,657.50
Financial
Items
Vodafone Group Deutsche Telekom
Formula 2016 2017 2016 2017
Return on
capital
employed
EBIT/(Total
Assets-
Current
Liabilities)
1.04% 3.00% 7.94% 8.23%
Financial Analysis of Vodafone Group_3
4
Return on
sales
Net profit/Net
Sales -10.28% -12.76% 4.25% 7.41%
Gross profit
Margin
Gross
Profit/Net
Sales
26.29% 27.41% 49.27% 49.08%
Return on
Equity
Net
profit/Averag
e
Shareholder's
Equity
-5.73% -7.65% 8.06% 13.65%
(Vodafone: Annual Report, 2017 and Vodafone: Annual Report, 2016); (Deutsche: Annual
Report, 2017 and Deutsche: Annual Report, 2016)
Liquidity Ratios
Financial Items
Vodafone Group Deutsche Telekom
2015 2016 2017 201
5 2016 2017
Current Assets
31,938.00

25,542.00

26,638.00

20,392.00
Current Liabilities
41,797.00

30,595.00

33,126.00

27,366.00
Inventory
716.00

576.00

1,629.00

1,985.00
Quick Assets
31,222.00

24,966.00

25,009.00

18,407.00
Financial Ratios Vodafone Group Deutsche Telekom
Formula 2016 2017 2016 2017
Current Ratio
Current
Assets/Current
Liabilities
0.76 0.83 0.80 0.75
Quick Ratio
(Current Assets-
Inventory-Prepaid
Expenses)/Curren
t Liabilities
0.75 0.82 0.75 0.67
(Vodafone: Annual Report, 2017 and Vodafone: Annual Report, 2016); (Deutsche: Annual
Report, 2017 and Deutsche: Annual Report, 2016)
Efficiency Ratios
Financial Vodafone Group Deutsche Telekom
Financial Analysis of Vodafone Group_4

End of preview

Want to access all the pages? Upload your documents or become a member.

Related Documents
Financial Statement Analysis of Vodafone Group
|14
|2946
|44

Financial Analysis of Vodafone and Comparison with Deutsche Telekom
|14
|2428
|226

Managing Financial Resources and Performance
|12
|3096
|20

Managing Financial Resources and Performance
|12
|2242
|250

Principle of Finance: Income Statement, Balance Sheet, Ratio Analysis
|7
|939
|32

Trend Analysis of JB Hi-Fi Limited: Financial Performance and Ratios
|25
|4703
|203