PSY 101: Psychological and Institutional Statistics Assignment

Verified

Added on  2019/09/16

|4
|431
|415
Homework Assignment
AI Summary
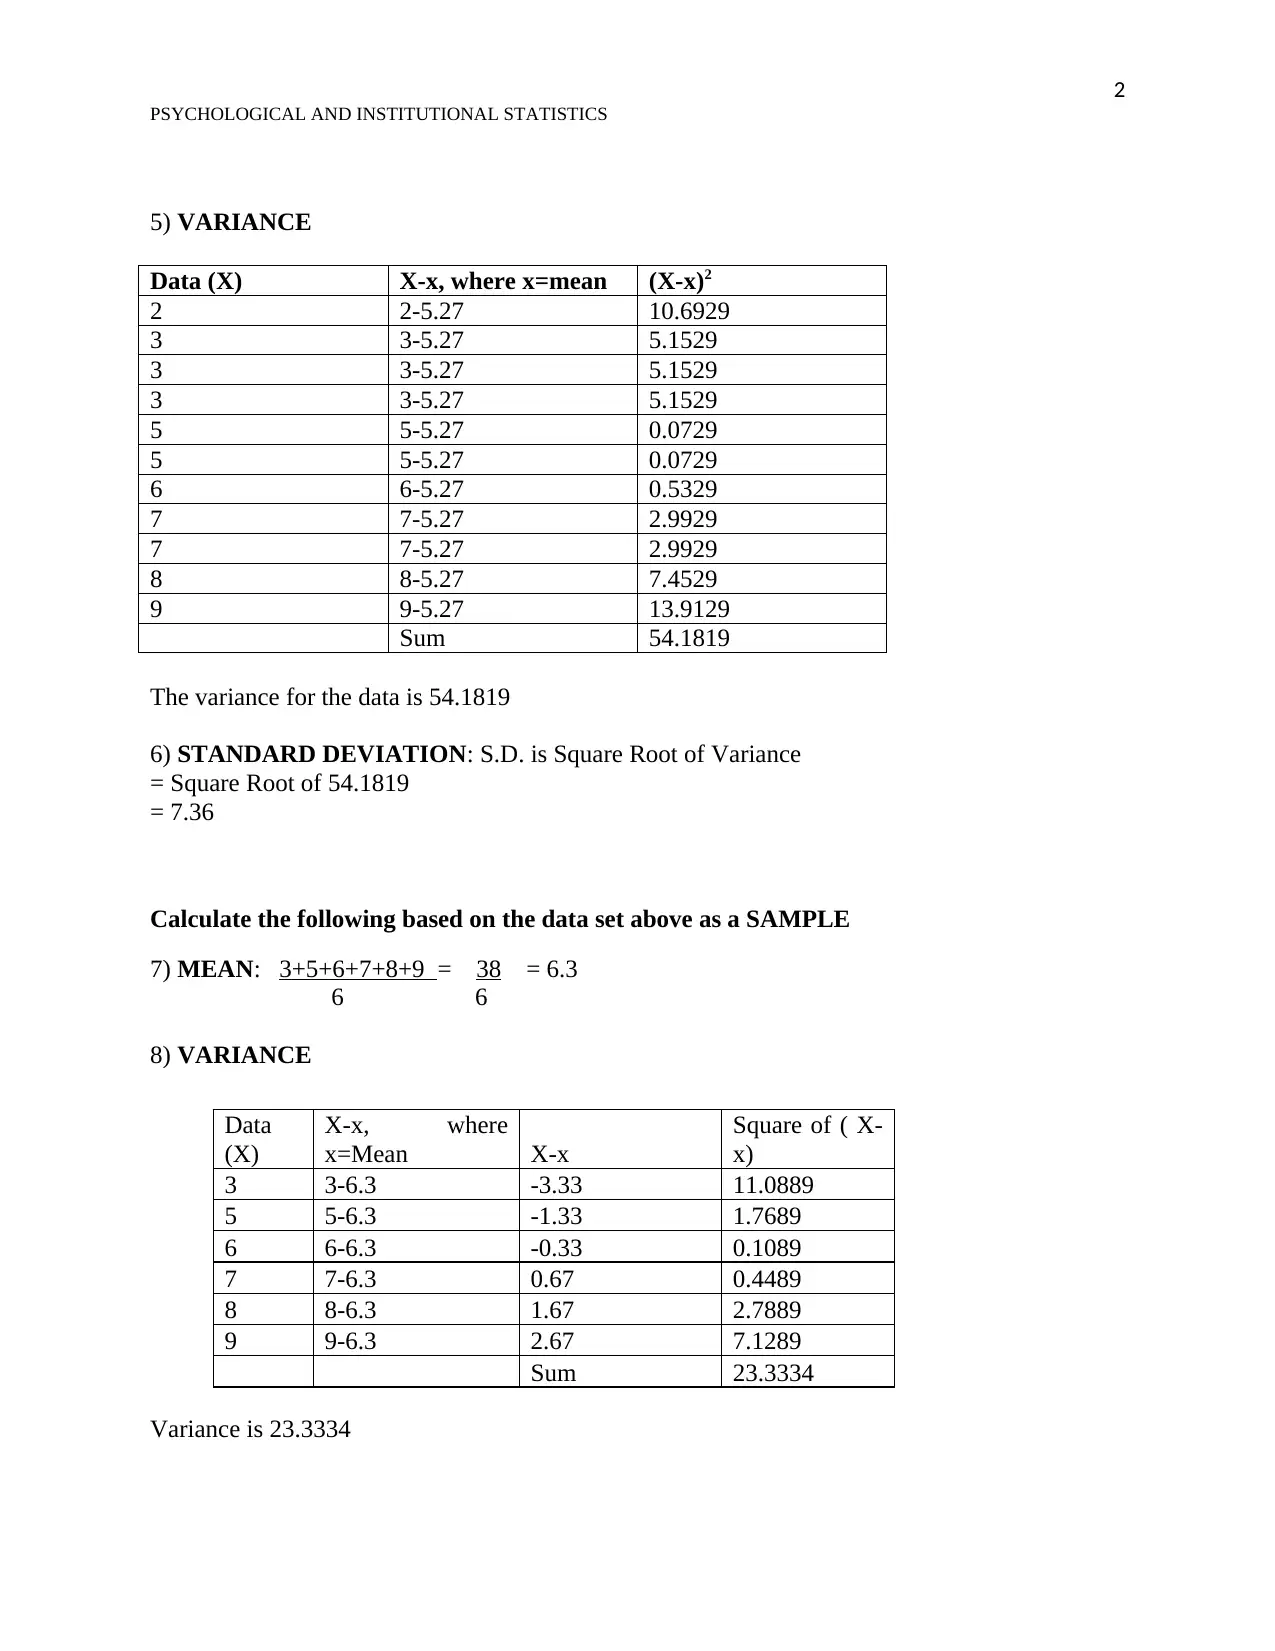
This document presents a solved homework assignment focused on psychological and institutional statistics. The assignment includes detailed calculations for various statistical measures, such as mean, median, and mode, providing step-by-step solutions for each. Furthermore, the assignment covers the calculation of the sum of squares, variance, and standard deviation for a given dataset, demonstrating the application of these concepts. The solution also includes the calculation of these measures for a sample dataset. Finally, the assignment concludes with the calculation of the cumulative percentage for a specific data point, illustrating the practical application of these statistical methods. This resource is designed to aid students in understanding and mastering statistical concepts within a psychological context.
Document Page
Running head: PSYCHOLOGICAL AND INSTITUTIONAL STATISTICS
PSYCHOLOGICAL AND INSTITUTIONAL STATISTICS
[Document subtitle]
[DATE]
[Company name]
[Company address]
tabler-icon-diamond-filled.svg

Paraphrase This Document

Need a fresh take? Get an instant paraphrase of this document with our AI Paraphraser
Document Page
1
PSYCHOLOGICAL AND INSTITUTIONAL STATISTICS
1) MEAN: 3+8+5+9+6+3+5+2+7+7+3 = 58 = 5.27
11 11
2) MEDIAN: Median is the middle value of the series when arranged in ascending order.
The middle value in this series is- 5.
Therefore Median is 5
3) MODE: Mode is the number that is most repeated in a set of population. Therefore, in the
given series 3 is repeated mostly. Mode of the series is: 3
4) SUM OF SQUARES
Data
(x)
Square of
x
2 4
3 9
3 9
3 9
5 25
5 25
6 36
7 49
7 49
8 64
9 81
Sum 360
Data
(X)
2
3
3
3
5
5
6
7
7
8
9
Document Page
2
PSYCHOLOGICAL AND INSTITUTIONAL STATISTICS
5) VARIANCE
Data (X) X-x, where x=mean (X-x)2
2 2-5.27 10.6929
3 3-5.27 5.1529
3 3-5.27 5.1529
3 3-5.27 5.1529
5 5-5.27 0.0729
5 5-5.27 0.0729
6 6-5.27 0.5329
7 7-5.27 2.9929
7 7-5.27 2.9929
8 8-5.27 7.4529
9 9-5.27 13.9129
Sum 54.1819
The variance for the data is 54.1819
6) STANDARD DEVIATION: S.D. is Square Root of Variance
= Square Root of 54.1819
= 7.36
Calculate the following based on the data set above as a SAMPLE
7) MEAN: 3+5+6+7+8+9 = 38 = 6.3
6 6
8) VARIANCE
Variance is 23.3334
Data
(X)
X-x, where
x=Mean X-x
Square of ( X-
x)
3 3-6.3 -3.33 11.0889
5 5-6.3 -1.33 1.7689
6 6-6.3 -0.33 0.1089
7 7-6.3 0.67 0.4489
8 8-6.3 1.67 2.7889
9 9-6.3 2.67 7.1289
Sum 23.3334
Document Page
3
PSYCHOLOGICAL AND INSTITUTIONAL STATISTICS
9) STANDARD DEVIATION
: S.D. is Square Root of Variance
= Square Root of 23.3334
= 4.83
10) For the following data set calculate the cumulative percentage for X=4
Answer
Data
(X)
Cumulative
Frequency (X/33)*100
Cumulative
Percentage
4 4 (4/33)*100 12.12121212
5 9 (9/33)*100 27.27272727
5 14 (14/33)*100 42.42424242
4 18 (18/33)*100 54.54545455
3 21 (21/33)*100 63.63636364
4 25 (25/33)*100 75.75757576
1 26 (26/33)*100 78.78787879
2 28 (28/33)*100 84.84848485
4 32 (32/33)*100 96.96969697
1 33 (33/33)*100 100
chevron_up_icon
1 out of 4
circle_padding
hide_on_mobile
zoom_out_icon
[object Object]