Profit Analysis and Customer Attribute Study of Nike: Unit ID
VerifiedAdded on 2021/06/18
|31
|4227
|37
Report
AI Summary
This report presents a comprehensive analysis of Nike's profit and customer attributes, exploring various aspects of its business performance. The study investigates customer segmentation based on usage, gender, and personality traits, utilizing techniques such as ANOVA and Chi-square tests to identify significant differences. The report further delves into profit analysis, examining the best and worst-selling products, the impact of different payment methods (PayPal vs. credit card) on sales, and the relationship between Cost of Goods Sold (COGS) and profit levels. The analysis includes the use of classification trees, box plots, and t-tests to draw conclusions about product performance, payment preferences, and monthly profit trends. Key findings include the identification of top-performing product categories, the impact of payment methods on sales, and the influence of customer attributes on purchasing behavior. The report concludes with a discussion of the findings and provides recommendations based on the analysis.
1
Profit Analysis with Customer Attribute
Study of Nike
Student Name: Student ID:
Unit Name: Unit ID:
Date Due: Professor Name:
Word Limit:
Profit Analysis with Customer Attribute
Study of Nike
Student Name: Student ID:
Unit Name: Unit ID:
Date Due: Professor Name:
Word Limit:
Paraphrase This Document
Need a fresh take? Get an instant paraphrase of this document with our AI Paraphraser
2
Contents
Table of Tables............................................................................................................................................2
Table of Figures...........................................................................................................................................3
1.0 Introduction of the Problem..................................................................................................................4
2.0 Classification of Business Problems of Nike...........................................................................................4
3.0 Results of the Analytical and Technical analysis....................................................................................6
3.1 Customer Characteristic Exploration.................................................................................................6
3.11 Do the client perspectives show a separation of three client groups............................................6
3.12 Do the client perspectives show a qualification for two genders..................................................8
3.2 Profit and COGS Analysis.................................................................................................................10
3.21 Which is the best and the most exceedingly worst selling item.................................................10
3.22 Is there any huge distinction in payment strategies....................................................................13
3.23 How was COGS scoring connected item classification.............................................................14
3.24 How are the two payment techniques distinctive for item astute payment.................................16
3.25 What is the level of relationship amongst COGS and net income levels....................................17
3.26 How does profit design change on a monthly basis...................................................................17
3.27 How does profit design change on sex premise.........................................................................19
4.0 Discussion and Proposals.....................................................................................................................21
5.0 References...........................................................................................................................................22
6.0 Appendix..............................................................................................................................................24
Table of Tables
Table 1: Descriptive statistics for personality traits.....................................................................................7
Table 2: Sex-based descriptive value for customer.....................................................................................8
Table 3: Awareness of Nike Cross Tabulation..............................................................................................9
Table 4: Post Hoc results for Nike’s customer attributes...........................................................................24
Table 5: Sex with Product Class Cross tabulation......................................................................................25
Table 6: One-Sample Test for card and Pay pal payment options.............................................................26
Table 7: One-way Descriptive figures for usage groups.............................................................................27
Table 8: ANOVA table for attributes of clients...........................................................................................28
Table 9: Paired Samples t-Test for Pay pal and credit card........................................................................28
Table 10: Pearson’s Correlation between Cost of goods and Profit Total..................................................29
Table 11: Chi-Square Tests for customer attributes..................................................................................29
3
Table of Figures
Figure 1: Gender distributed usage group...................................................................................................9
Figure 2: Annual total profit based on product category...........................................................................10
Figure 3: Identification of best and worst product....................................................................................11
Figure 4: Best and worst selling product category.....................................................................................12
Figure 5: Classification tree for complete product segments....................................................................12
Figure 6: Box Plot for Credit card payment................................................................................................13
Figure 7: Box Plot for Pay Pal payment......................................................................................................14
Figure 8: Classification tree describing entire product segments on COGS...............................................15
Figure 9: Product lines on Pay Pal payment...............................................................................................16
Figure 10: Product lines on Credit Card payment......................................................................................17
Figure 11: Monthly total_ profit distribution bar diagram........................................................................18
Figure 12: Month-wise profit distribution of Nike.....................................................................................19
Figure 13: Gender-wise profit distribution................................................................................................19
Figure 14: Classification tree for profit......................................................................................................20
Figure 15: Average profit product item wise.............................................................................................26
⊘ This is a preview!⊘
Do you want full access?
Subscribe today to unlock all pages.
Trusted by 1+ million students worldwide
4
1.0 Introduction of the Problem
When it comes to sports apparel, the first name that comes to mind is NIKE’. The leader in the
sportswear segment with its trademark and quality magnetizes the customers all over the world. It
believes in the motto that, if a person has a healthy body than he/ she can be a worthy
sportsperson for the country. There are few competitors and this very cause drives the company
towards the invention of new product lines for both the sexes. The association takes after by their
principle objective of giving inventive sportswear to all contenders around the world. The
witticism of reasonability and great modernization has made an amazing brand a motivating force
for the clients. Conferred look into the gathering, researchers have manufactured a model which is
controlling Nike to an exponential improvement in thing goes close by general incomes. The
expert environmental approach has added to the brand name and upheld steady improvement at
each edge of the globe. The combination of item offering, each atmosphere wear additional items
has pulled in clients from the whole age areas. The money related experts and accomplices are
enthusiastic about new enthusiasm for the association. The inside organization of the association
has grasped a pilot errand to mull over late examples in shopper steadfastness and profit
examination. The market overview was coordinated in two phases, first for client examination and
a while later for association profit examination in light of picked thing broadens (Babooram,
2014).
2.0 Classification of Business Problems of Nike
The business mainly oriented around two attributes of stakeholders, customer's personality traits
and monthly profit trend from a variety of product lines (Chandra, 2017). The fundamental time
of the work included client contemplation in light of reactions of the clients. The investigation
aggregate gathered data on five fields, they were, item inclination, buy expectation mindfulness
Paraphrase This Document
Need a fresh take? Get an instant paraphrase of this document with our AI Paraphraser
5
about different product offerings, payment level, and unwavering quality of the clients. Clients
were isolated into three classes in perspective of their decision of thing broadens. Overwhelming,
medium and light use class of clients were sorted in view of their sex. Accentuation was given on
two unequivocal inquiries related to the assembled data. The examination organized request was
according to the accompanying,
I. Do the client perspectives show a separation of three client groups?
II. Do the client perspectives show a qualification for two genders?
Three client class and sex of the clients were two ordinal factors. Examination of five client
personality characteristics, which were ordinal in nature, was performed for the client class and
their sex. The correct choice of informative procedure for the relationship was considered as
Cross-Tabulation. The inferential conclusion was drawn from Chi-square test.
Profit examination was finished in the second stage which included COGS information of one
year with nine particular item contributions. Edge of the cost of things (COGS) and total profit,
close by payment modes was inspected (Ngai, Xiu & Chau, 2009). As the essential worry of
every industry is a profit, the organization focused on the profit figures, related to thing orders.
For complete conclusion, seven inquiries were composed as underneath,
I. Which is the best and the most exceedingly worst offering item?
II. Is there any huge distinction in payment strategies?
III. How was COGS scoring connected item classification?
IV. How are the two payment techniques distinctive for item astute payment?
V. What is the level of relationship amongst COGS and net income levels?
VI. How does profit design change on a month to month premise?
6
VII. How does profit design change on sex premise?
The connecting with measures for every investigation question was found in perspective of
nature of the data, and the legitimate inferential genuine measure was taken to set up the
instances of illustrative characteristics. The chi-square test, t-test, one path investigation of
fluctuation, the connection was used with the
3.0 Results of the Analytical and Technical analysis
3.1 Customer Characteristic Exploration
3.11 Do the client perspectives show a separation of three client groups
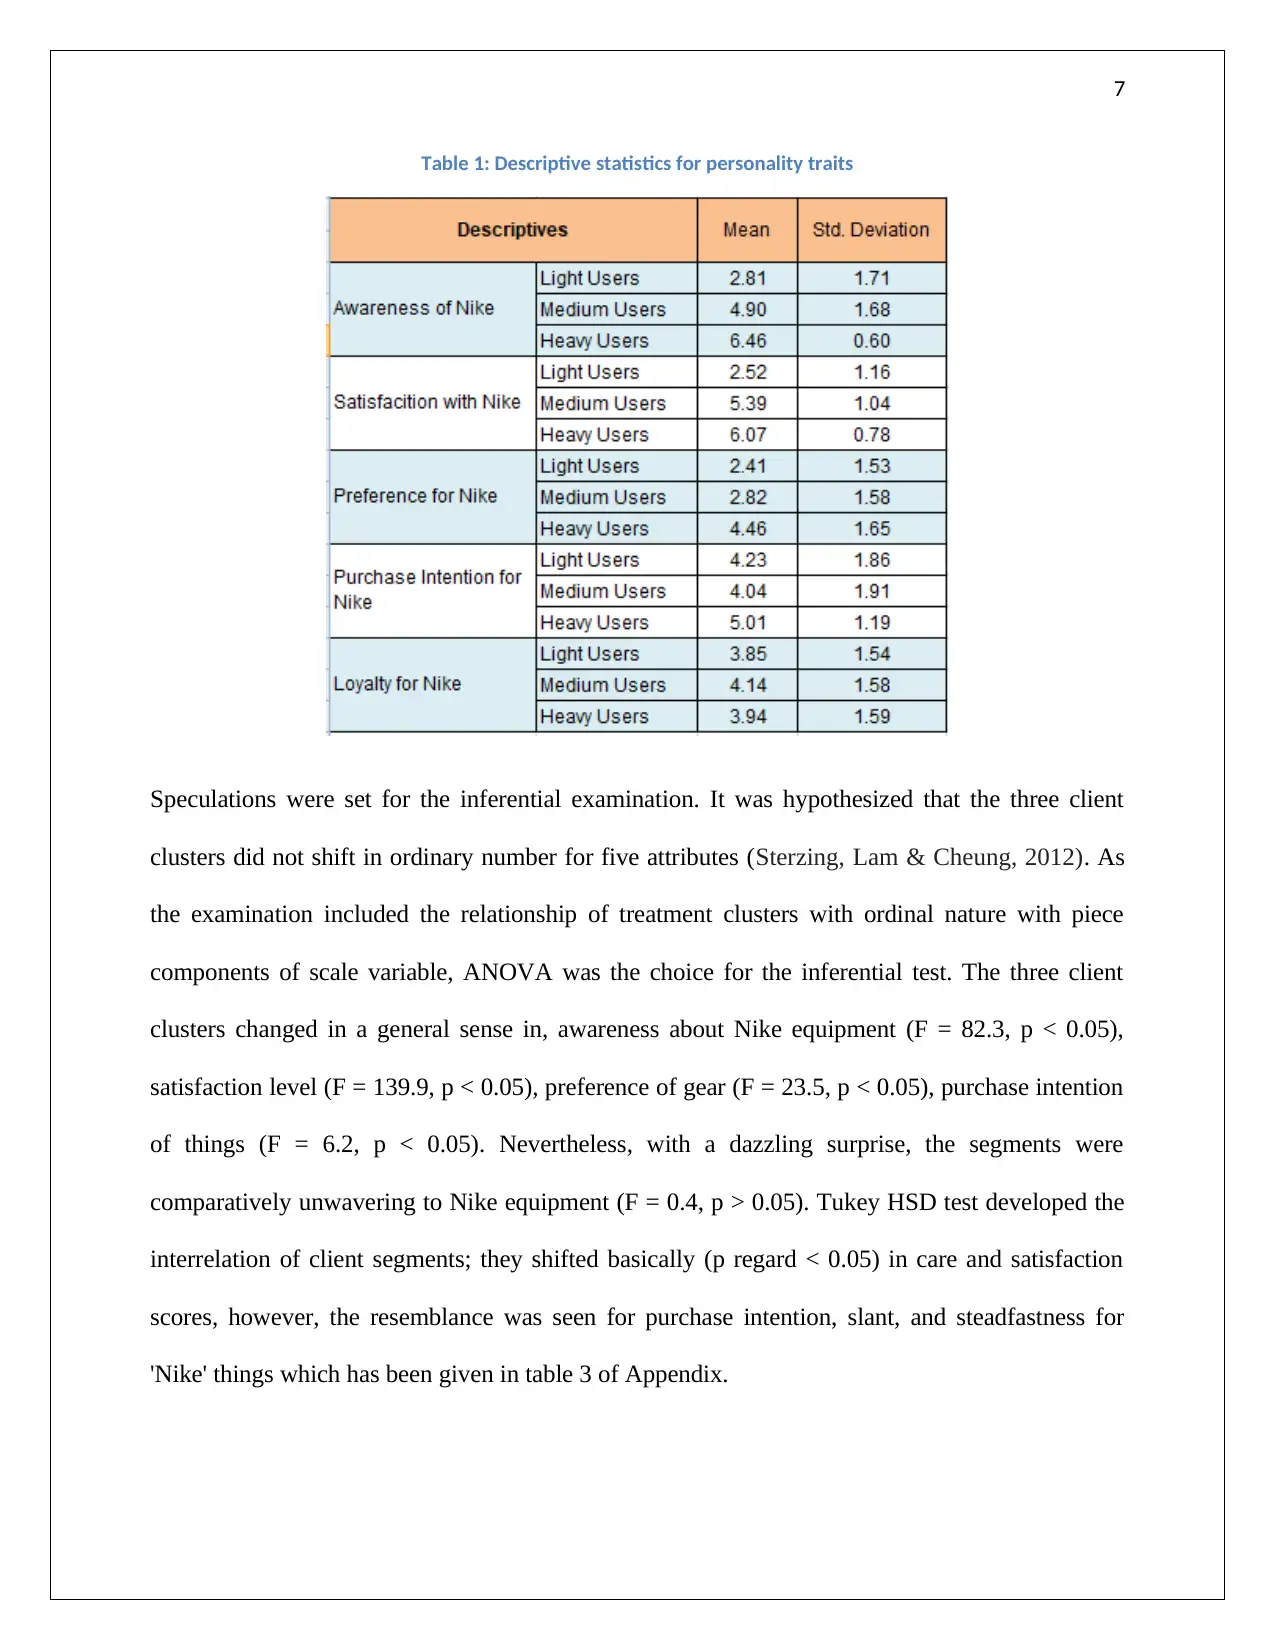
In the customer user groups, twenty-seven customers were identified as light sportswear user. The
medium user group consisted of fifty-one customers and the heavy sportswear was the highest in
number with seventy-two customers. Table 1 consists of the average and root mean square
deviation of the scenario.
VII. How does profit design change on sex premise?
The connecting with measures for every investigation question was found in perspective of
nature of the data, and the legitimate inferential genuine measure was taken to set up the
instances of illustrative characteristics. The chi-square test, t-test, one path investigation of
fluctuation, the connection was used with the
3.0 Results of the Analytical and Technical analysis
3.1 Customer Characteristic Exploration
3.11 Do the client perspectives show a separation of three client groups
In the customer user groups, twenty-seven customers were identified as light sportswear user. The
medium user group consisted of fifty-one customers and the heavy sportswear was the highest in
number with seventy-two customers. Table 1 consists of the average and root mean square
deviation of the scenario.
⊘ This is a preview!⊘
Do you want full access?
Subscribe today to unlock all pages.
Trusted by 1+ million students worldwide
7
Table 1: Descriptive statistics for personality traits
Speculations were set for the inferential examination. It was hypothesized that the three client
clusters did not shift in ordinary number for five attributes (Sterzing, Lam & Cheung, 2012). As
the examination included the relationship of treatment clusters with ordinal nature with piece
components of scale variable, ANOVA was the choice for the inferential test. The three client
clusters changed in a general sense in, awareness about Nike equipment (F = 82.3, p < 0.05),
satisfaction level (F = 139.9, p < 0.05), preference of gear (F = 23.5, p < 0.05), purchase intention
of things (F = 6.2, p < 0.05). Nevertheless, with a dazzling surprise, the segments were
comparatively unwavering to Nike equipment (F = 0.4, p > 0.05). Tukey HSD test developed the
interrelation of client segments; they shifted basically (p regard < 0.05) in care and satisfaction
scores, however, the resemblance was seen for purchase intention, slant, and steadfastness for
'Nike' things which has been given in table 3 of Appendix.
Paraphrase This Document
Need a fresh take? Get an instant paraphrase of this document with our AI Paraphraser
8
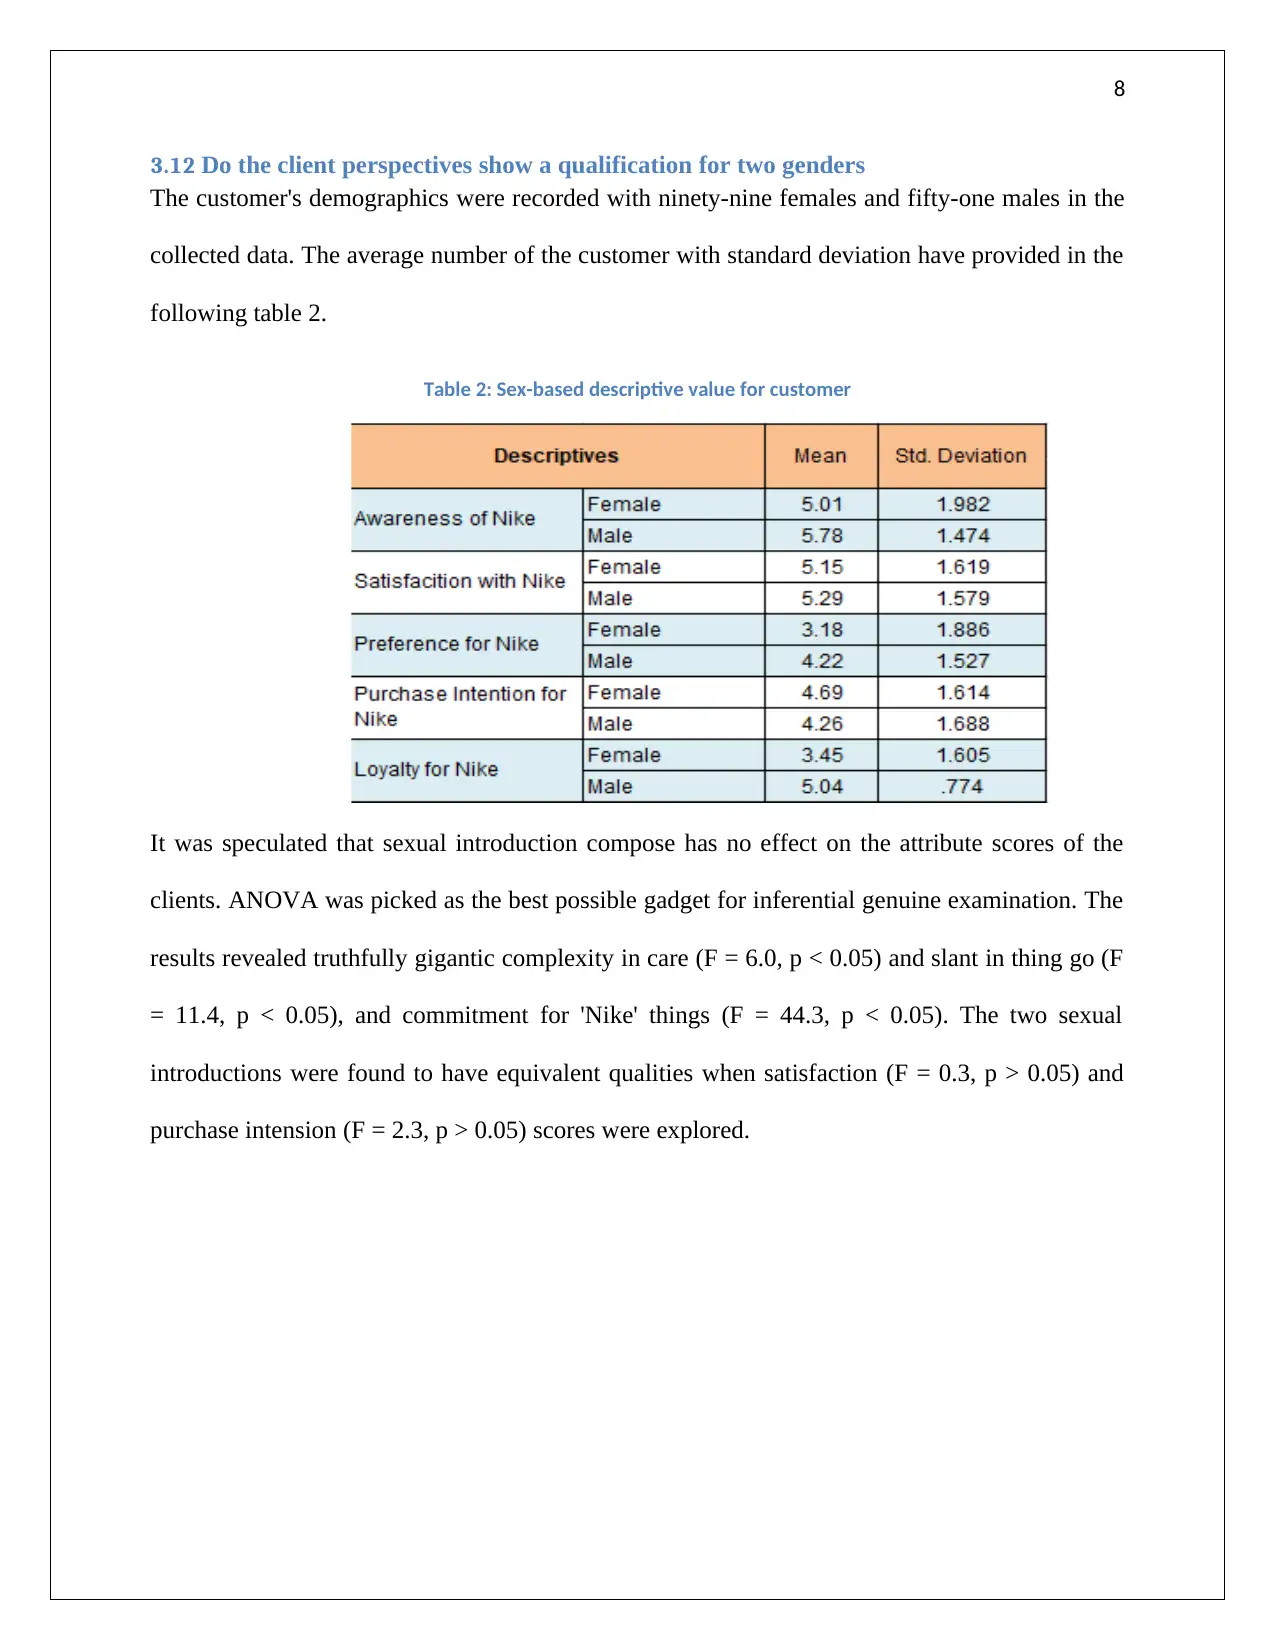
3.12 Do the client perspectives show a qualification for two genders
The customer's demographics were recorded with ninety-nine females and fifty-one males in the
collected data. The average number of the customer with standard deviation have provided in the
following table 2.
Table 2: Sex-based descriptive value for customer
It was speculated that sexual introduction compose has no effect on the attribute scores of the
clients. ANOVA was picked as the best possible gadget for inferential genuine examination. The
results revealed truthfully gigantic complexity in care (F = 6.0, p < 0.05) and slant in thing go (F
= 11.4, p < 0.05), and commitment for 'Nike' things (F = 44.3, p < 0.05). The two sexual
introductions were found to have equivalent qualities when satisfaction (F = 0.3, p > 0.05) and
purchase intension (F = 2.3, p > 0.05) scores were explored.
9
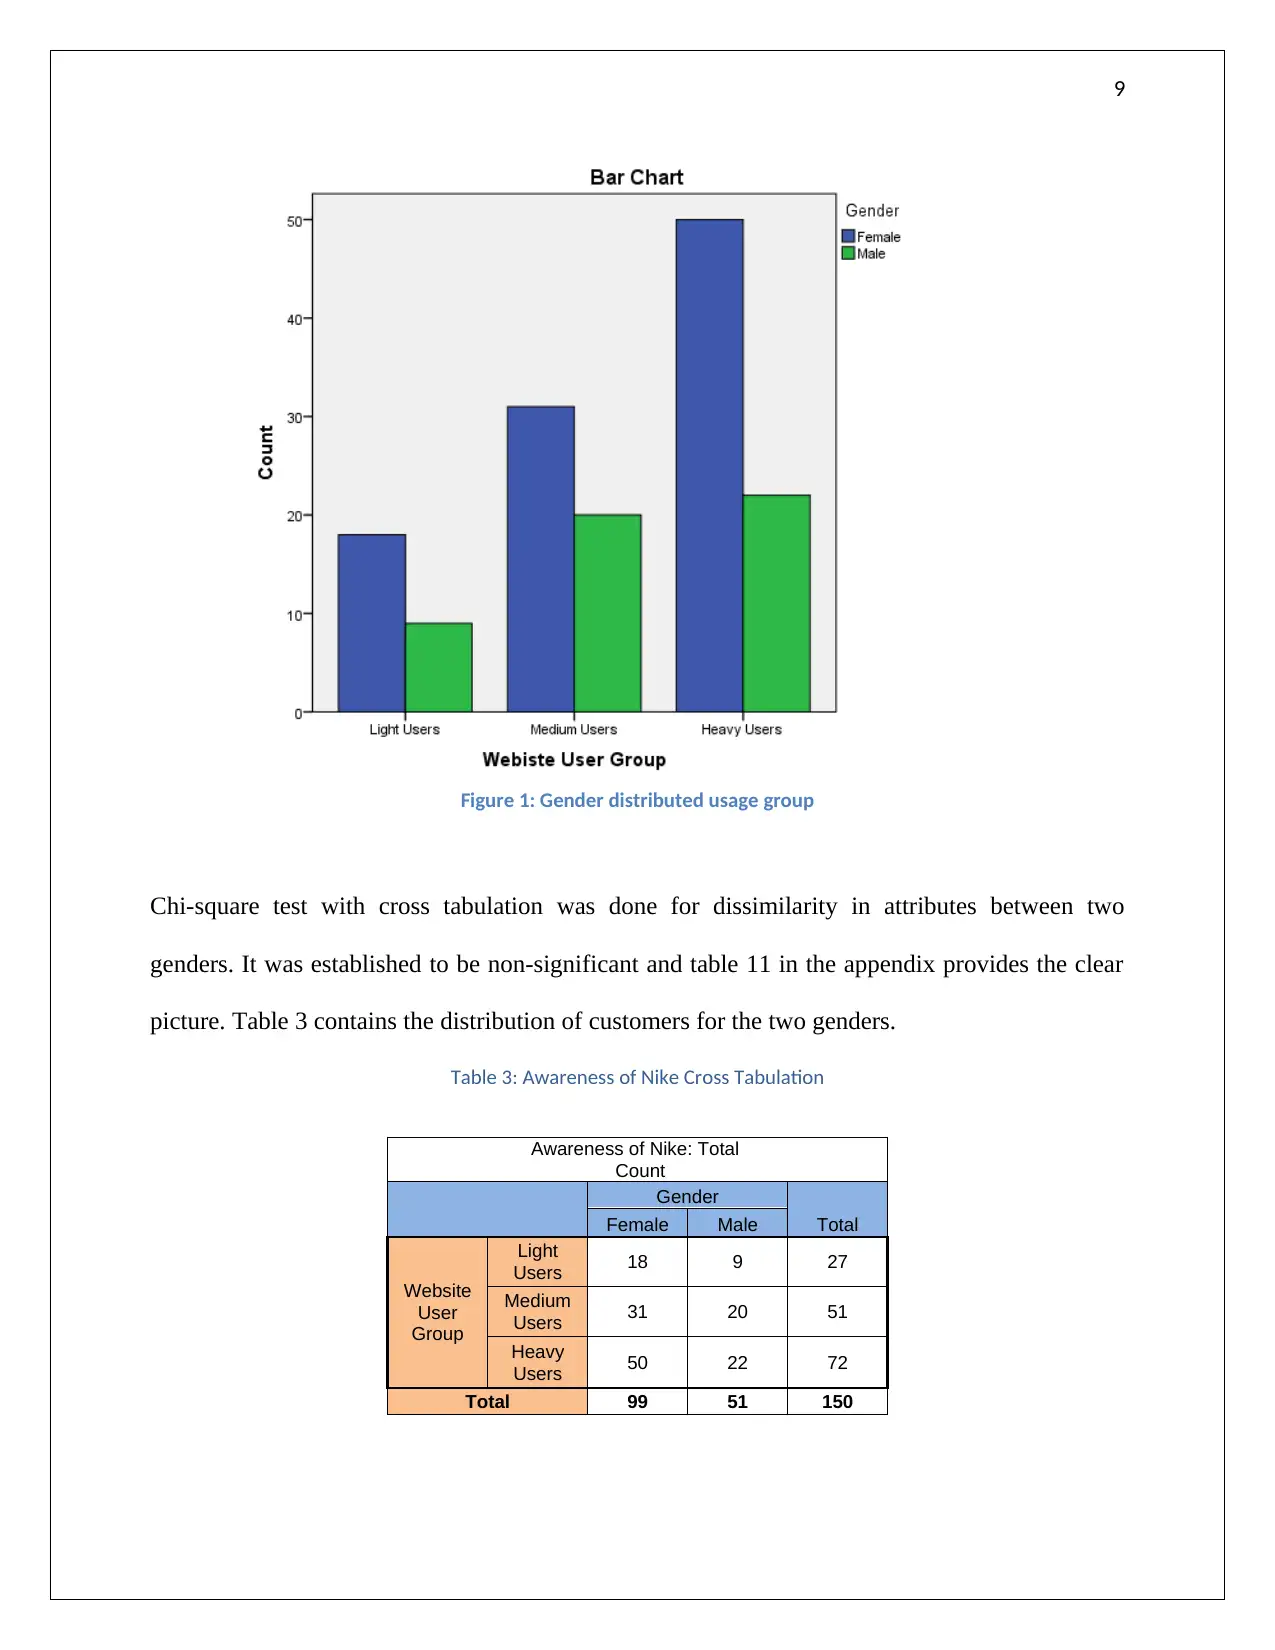
Figure 1: Gender distributed usage group
Chi-square test with cross tabulation was done for dissimilarity in attributes between two
genders. It was established to be non-significant and table 11 in the appendix provides the clear
picture. Table 3 contains the distribution of customers for the two genders.
Table 3: Awareness of Nike Cross Tabulation
Awareness of Nike: Total
Count
Gender
TotalFemale Male
Website
User
Group
Light
Users 18 9 27
Medium
Users 31 20 51
Heavy
Users 50 22 72
Total 99 51 150
⊘ This is a preview!⊘
Do you want full access?
Subscribe today to unlock all pages.
Trusted by 1+ million students worldwide
10
3.2 Profit and COGS Analysis
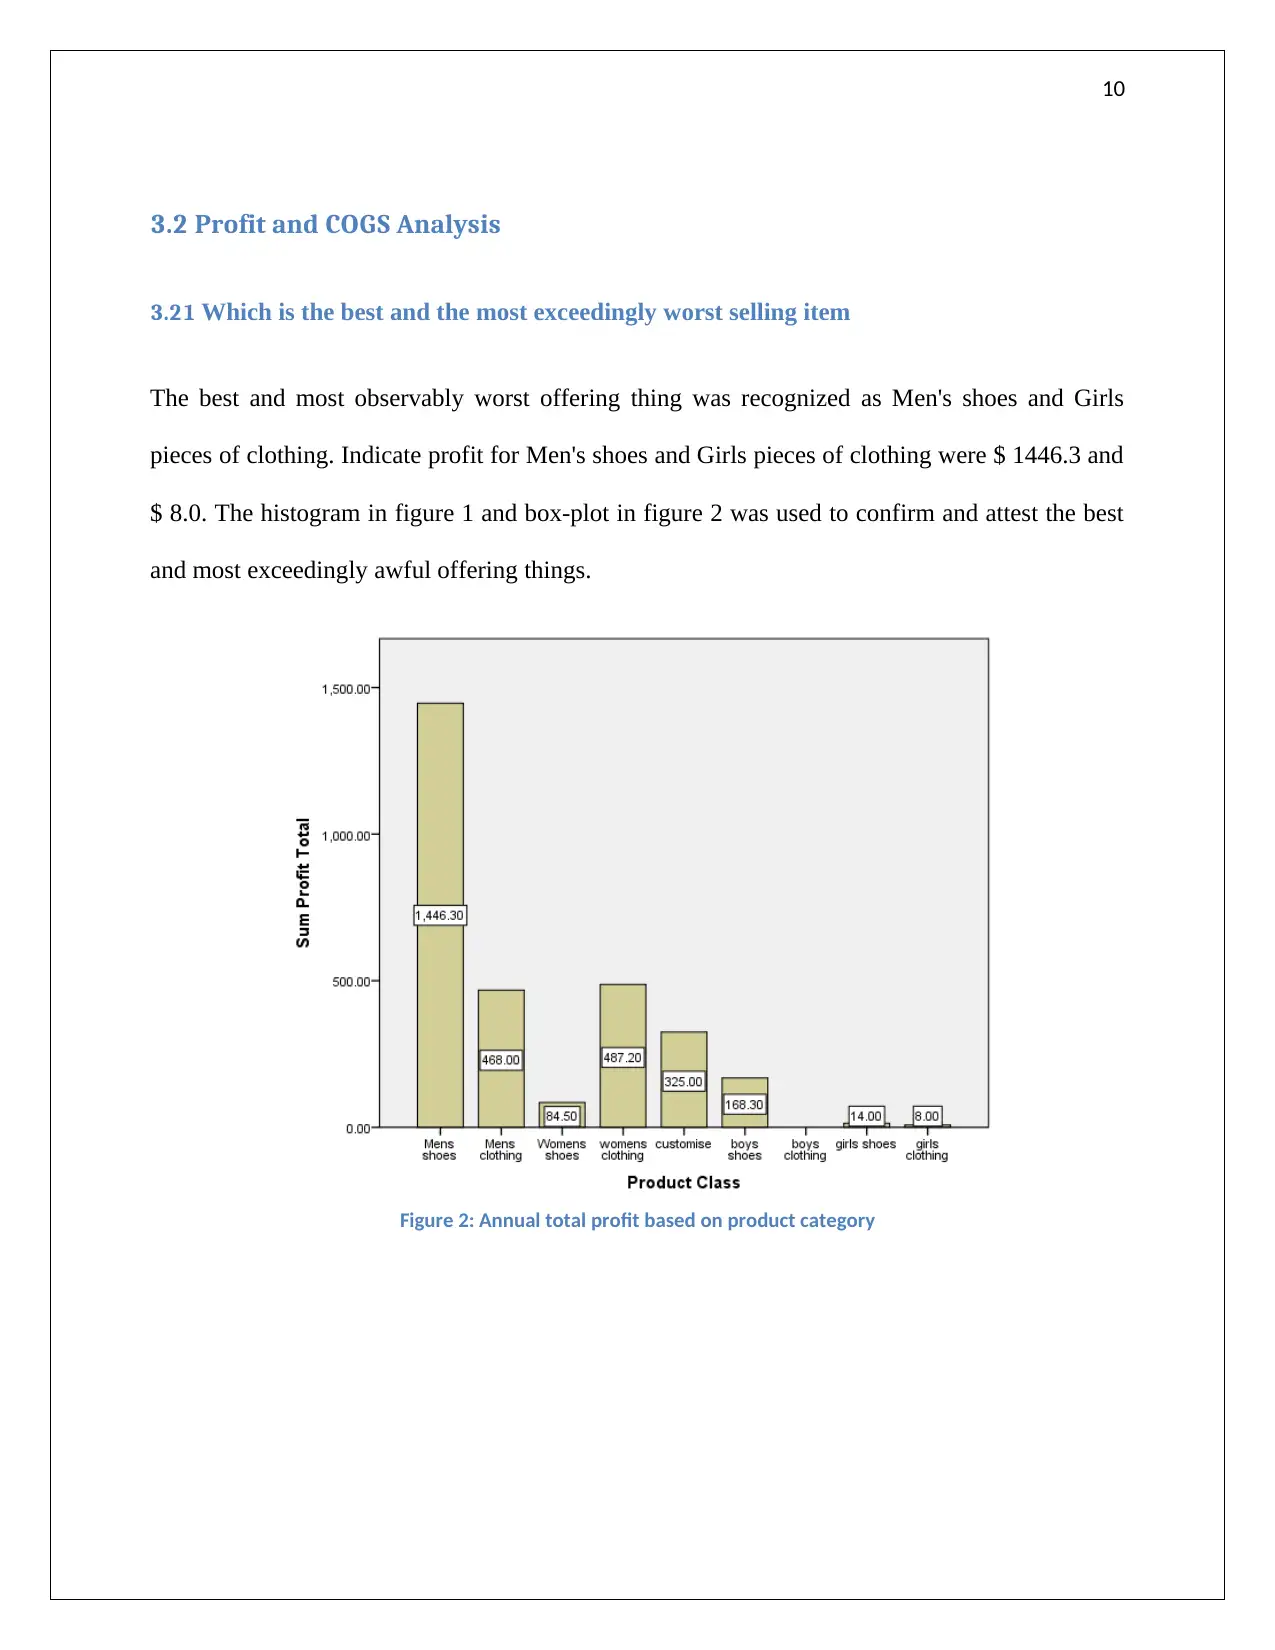
3.21 Which is the best and the most exceedingly worst selling item
The best and most observably worst offering thing was recognized as Men's shoes and Girls
pieces of clothing. Indicate profit for Men's shoes and Girls pieces of clothing were $ 1446.3 and
$ 8.0. The histogram in figure 1 and box-plot in figure 2 was used to confirm and attest the best
and most exceedingly awful offering things.
Figure 2: Annual total profit based on product category
3.2 Profit and COGS Analysis
3.21 Which is the best and the most exceedingly worst selling item
The best and most observably worst offering thing was recognized as Men's shoes and Girls
pieces of clothing. Indicate profit for Men's shoes and Girls pieces of clothing were $ 1446.3 and
$ 8.0. The histogram in figure 1 and box-plot in figure 2 was used to confirm and attest the best
and most exceedingly awful offering things.
Figure 2: Annual total profit based on product category
Paraphrase This Document
Need a fresh take? Get an instant paraphrase of this document with our AI Paraphraser
11
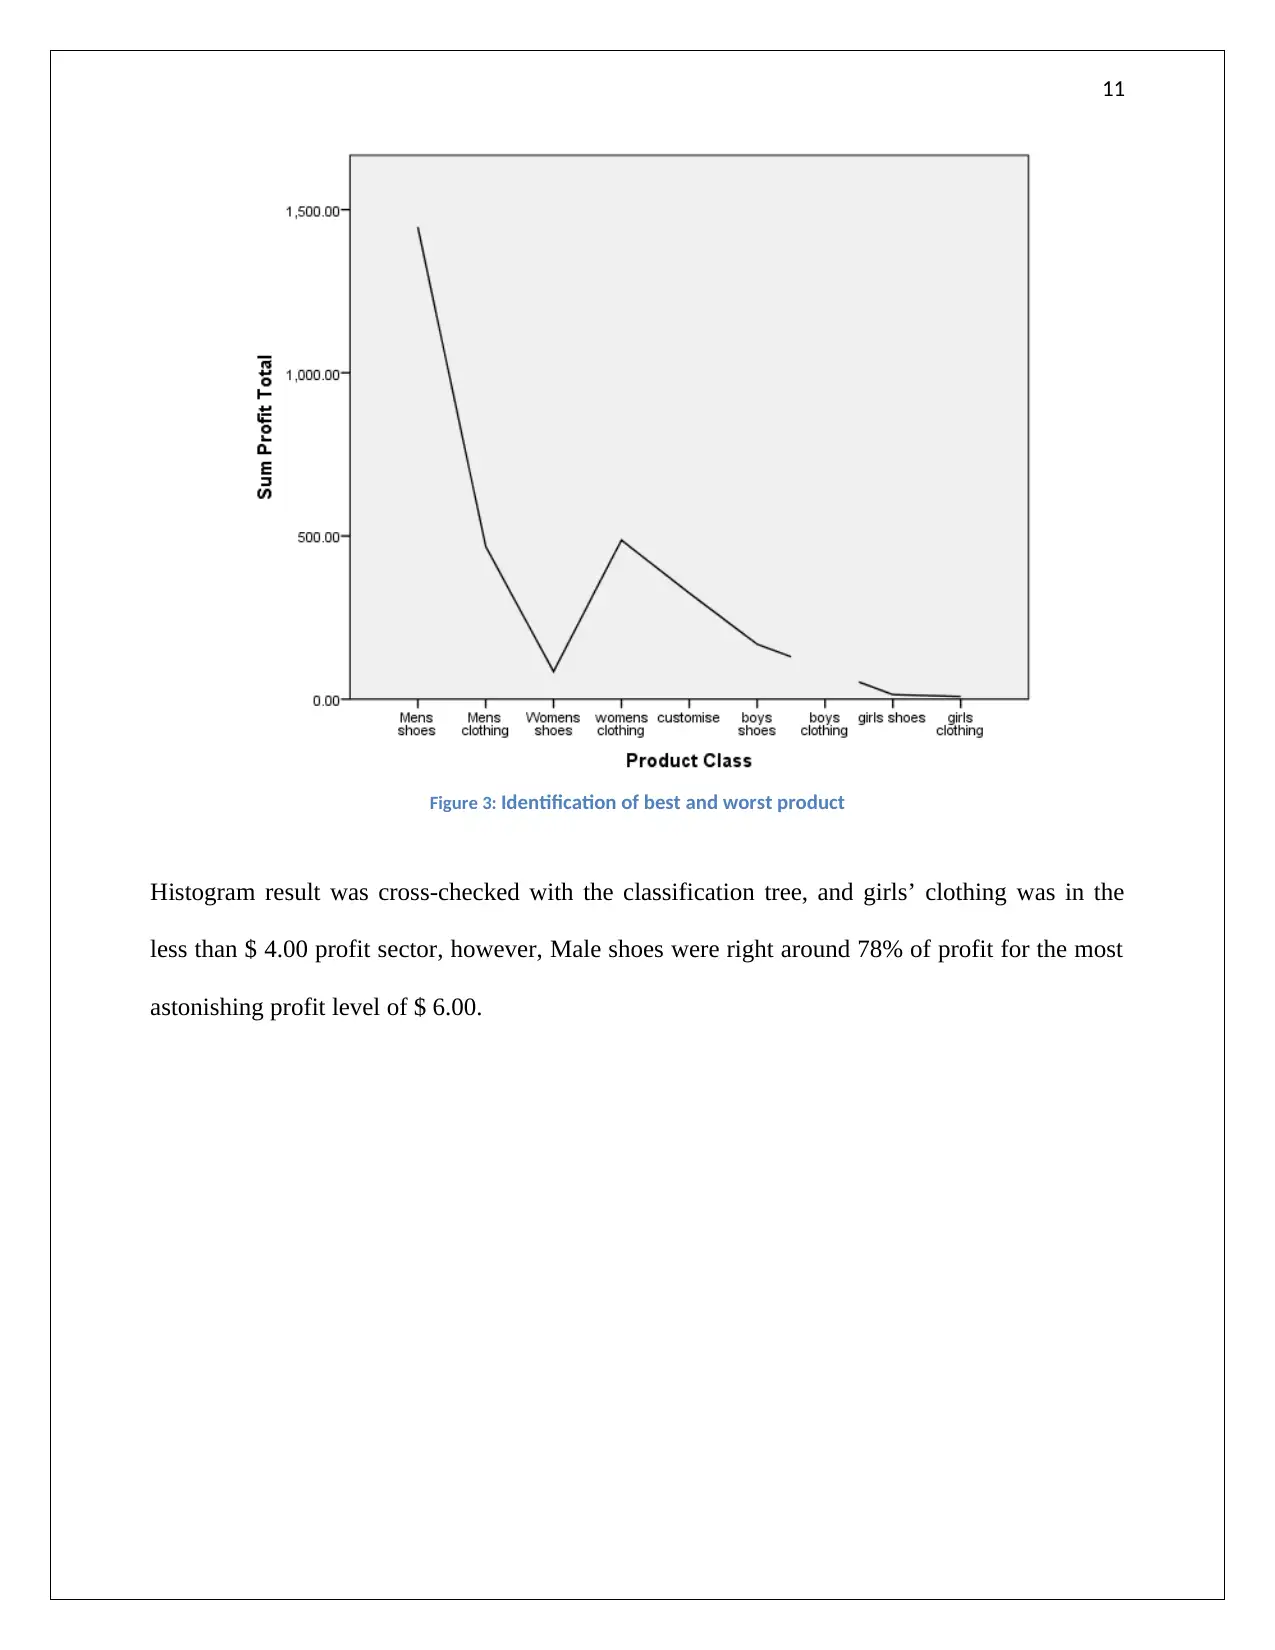
Figure 3: Identification of best and worst product
Histogram result was cross-checked with the classification tree, and girls’ clothing was in the
less than $ 4.00 profit sector, however, Male shoes were right around 78% of profit for the most
astonishing profit level of $ 6.00.
Figure 3: Identification of best and worst product
Histogram result was cross-checked with the classification tree, and girls’ clothing was in the
less than $ 4.00 profit sector, however, Male shoes were right around 78% of profit for the most
astonishing profit level of $ 6.00.
12
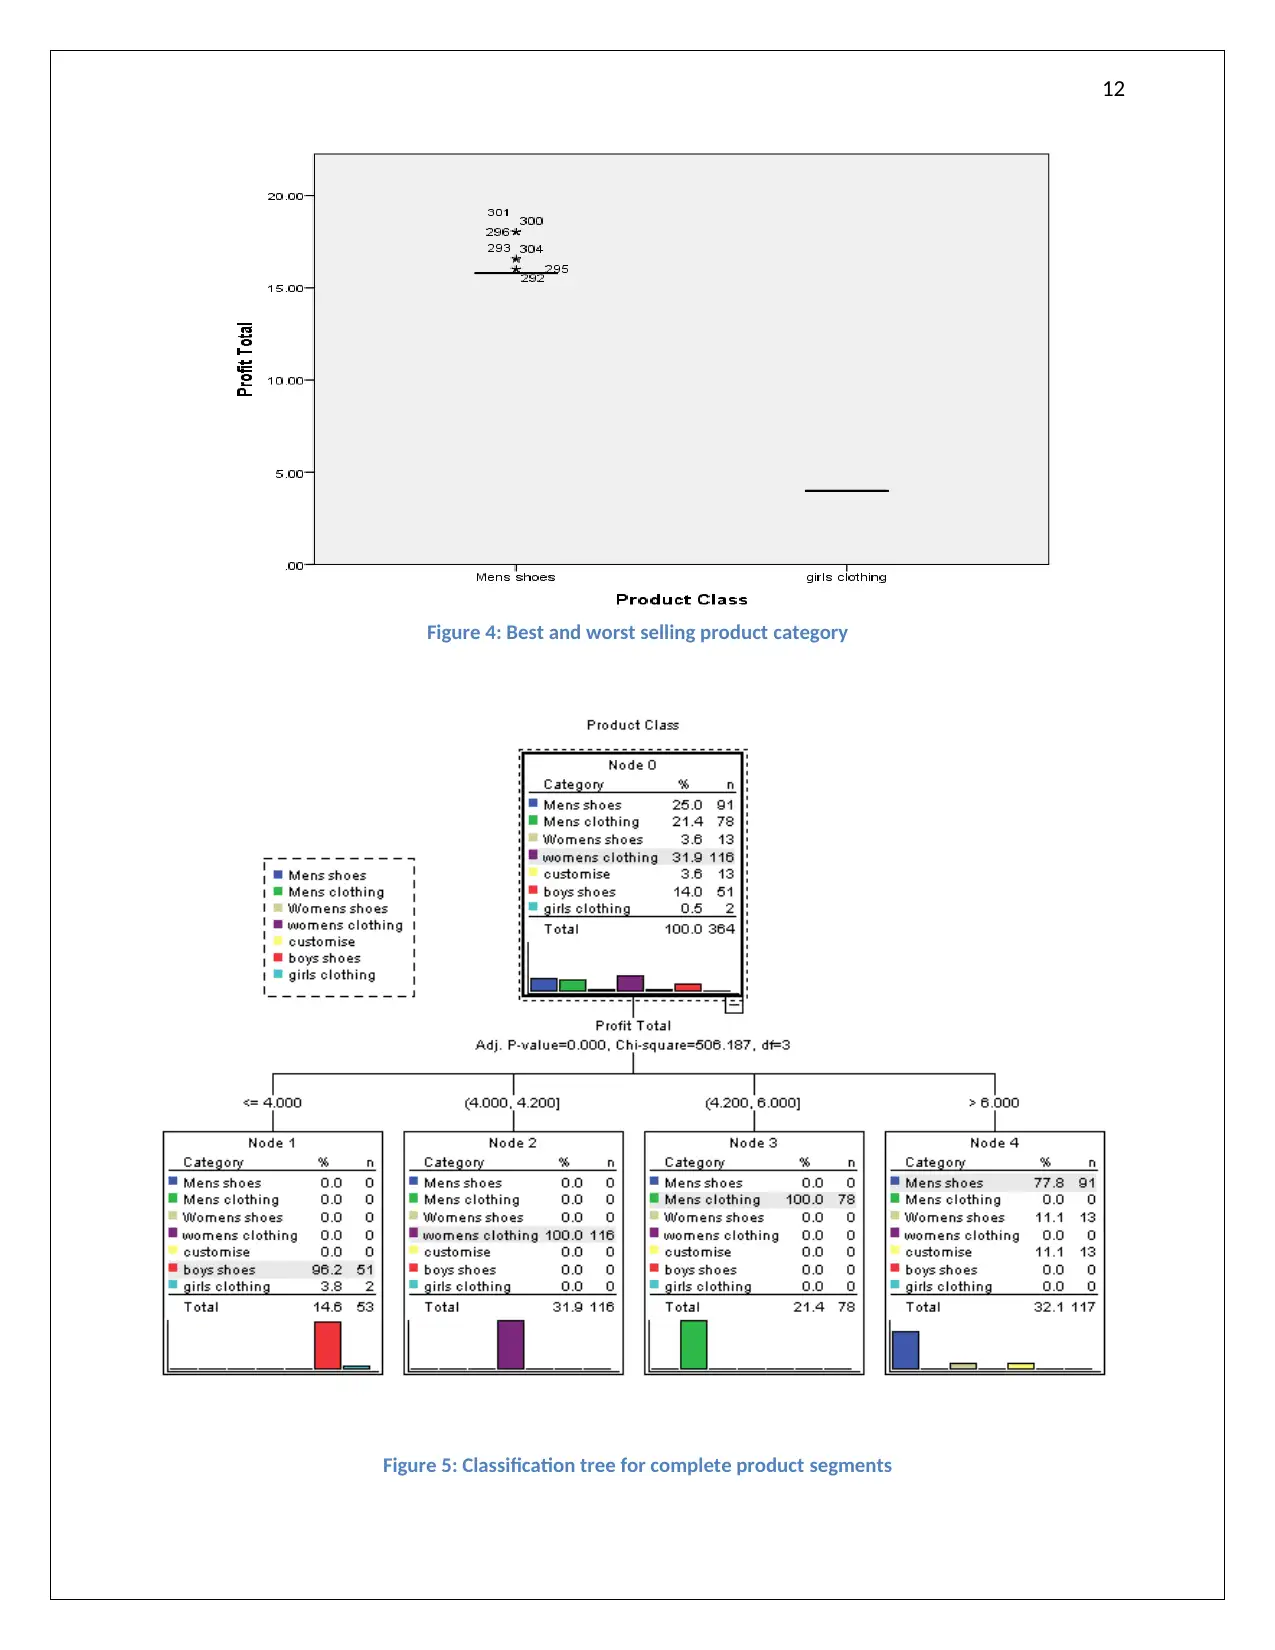
Figure 4: Best and worst selling product category
Figure 5: Classification tree for complete product segments
Figure 4: Best and worst selling product category
Figure 5: Classification tree for complete product segments
⊘ This is a preview!⊘
Do you want full access?
Subscribe today to unlock all pages.
Trusted by 1+ million students worldwide
1 out of 31