The Impact of Financial Metrics on Earnings Quality in Nigerian Banks
VerifiedAdded on 2021/10/27
|12
|2086
|475
Report
AI Summary
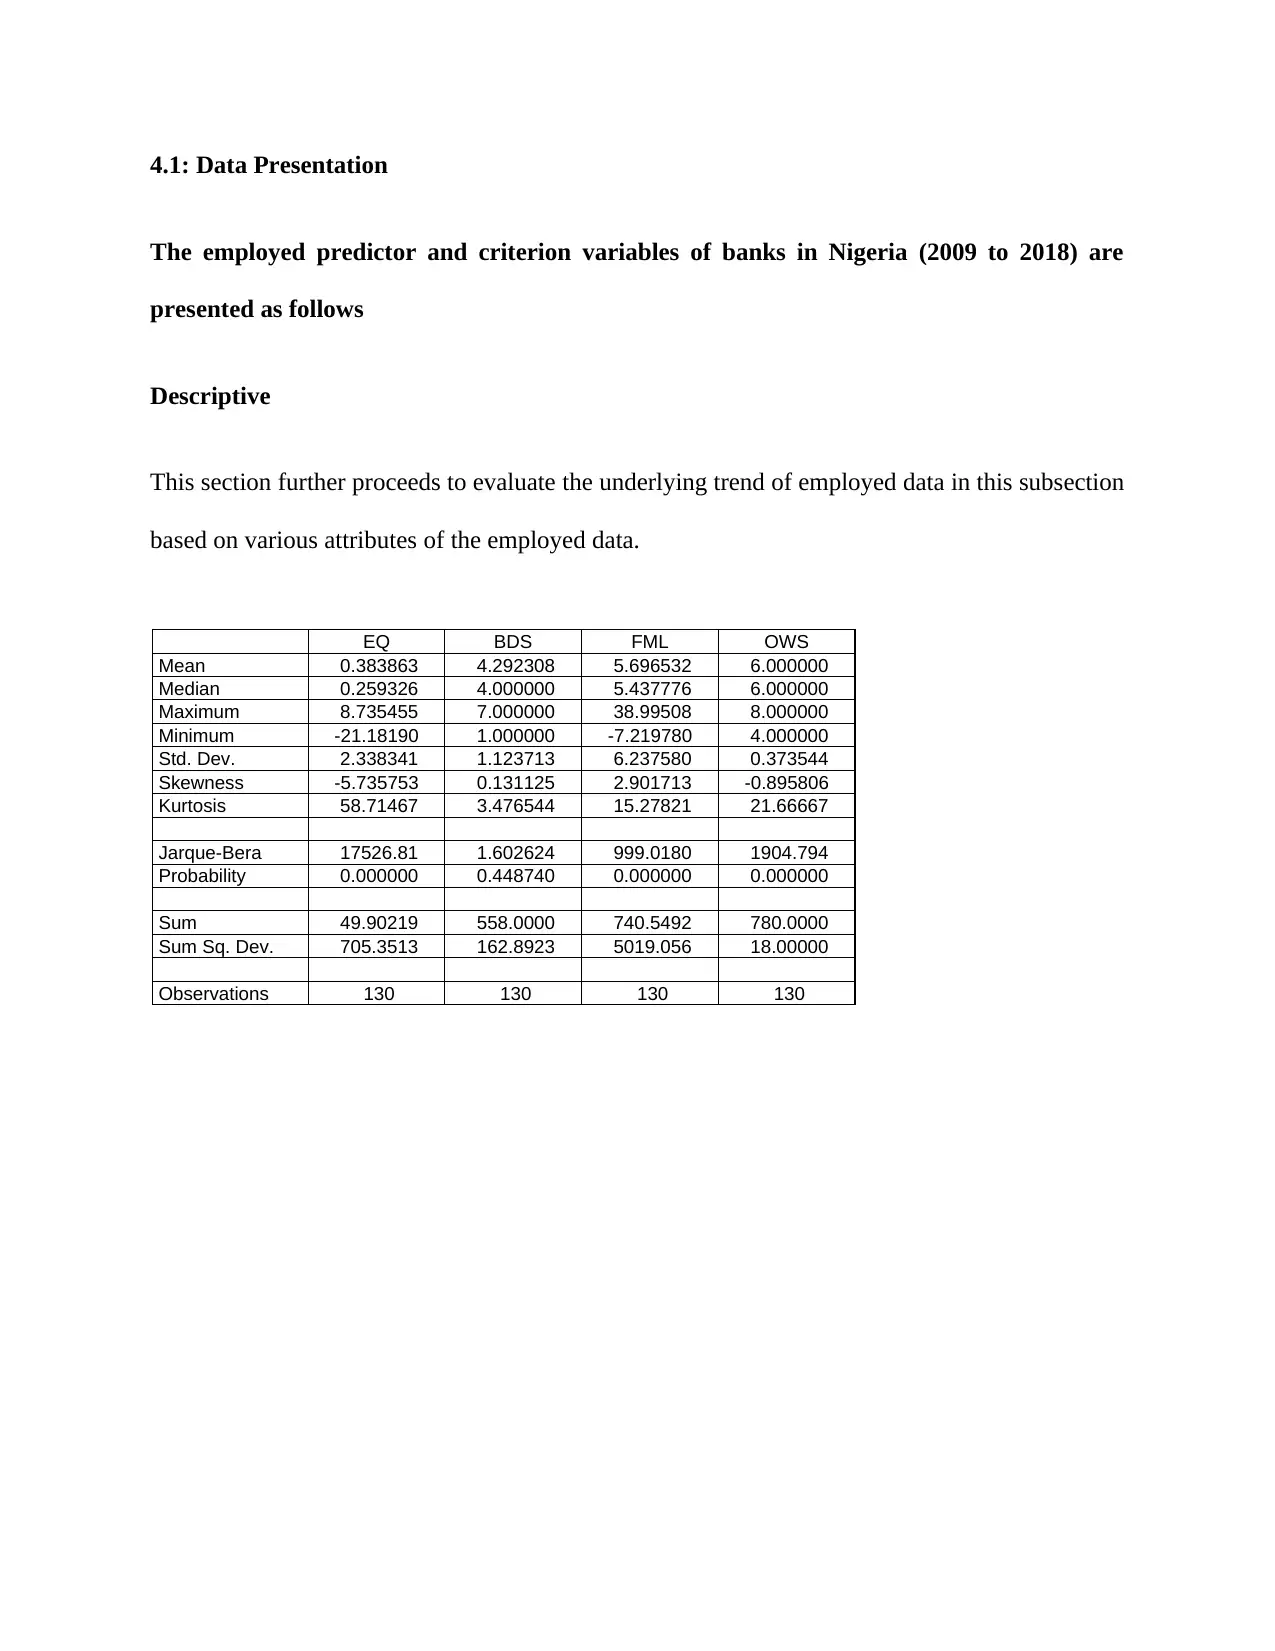
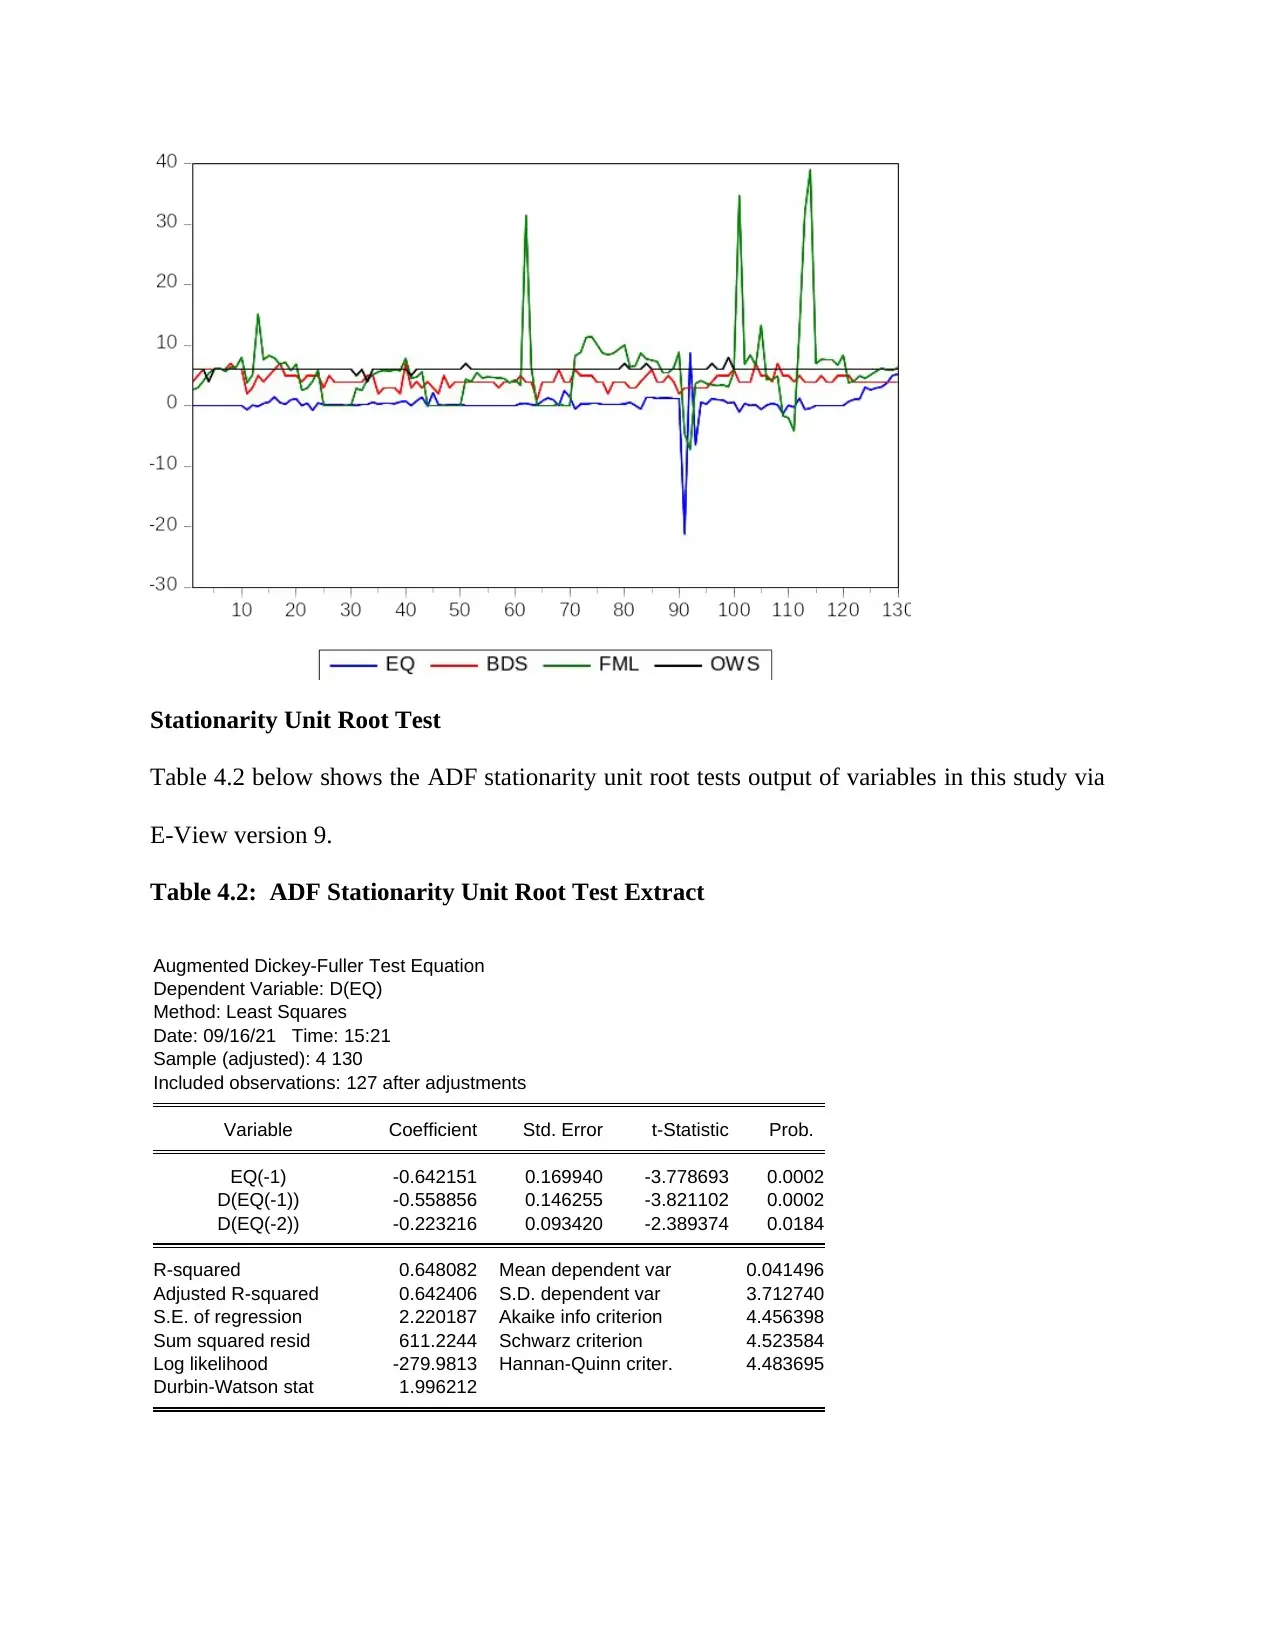
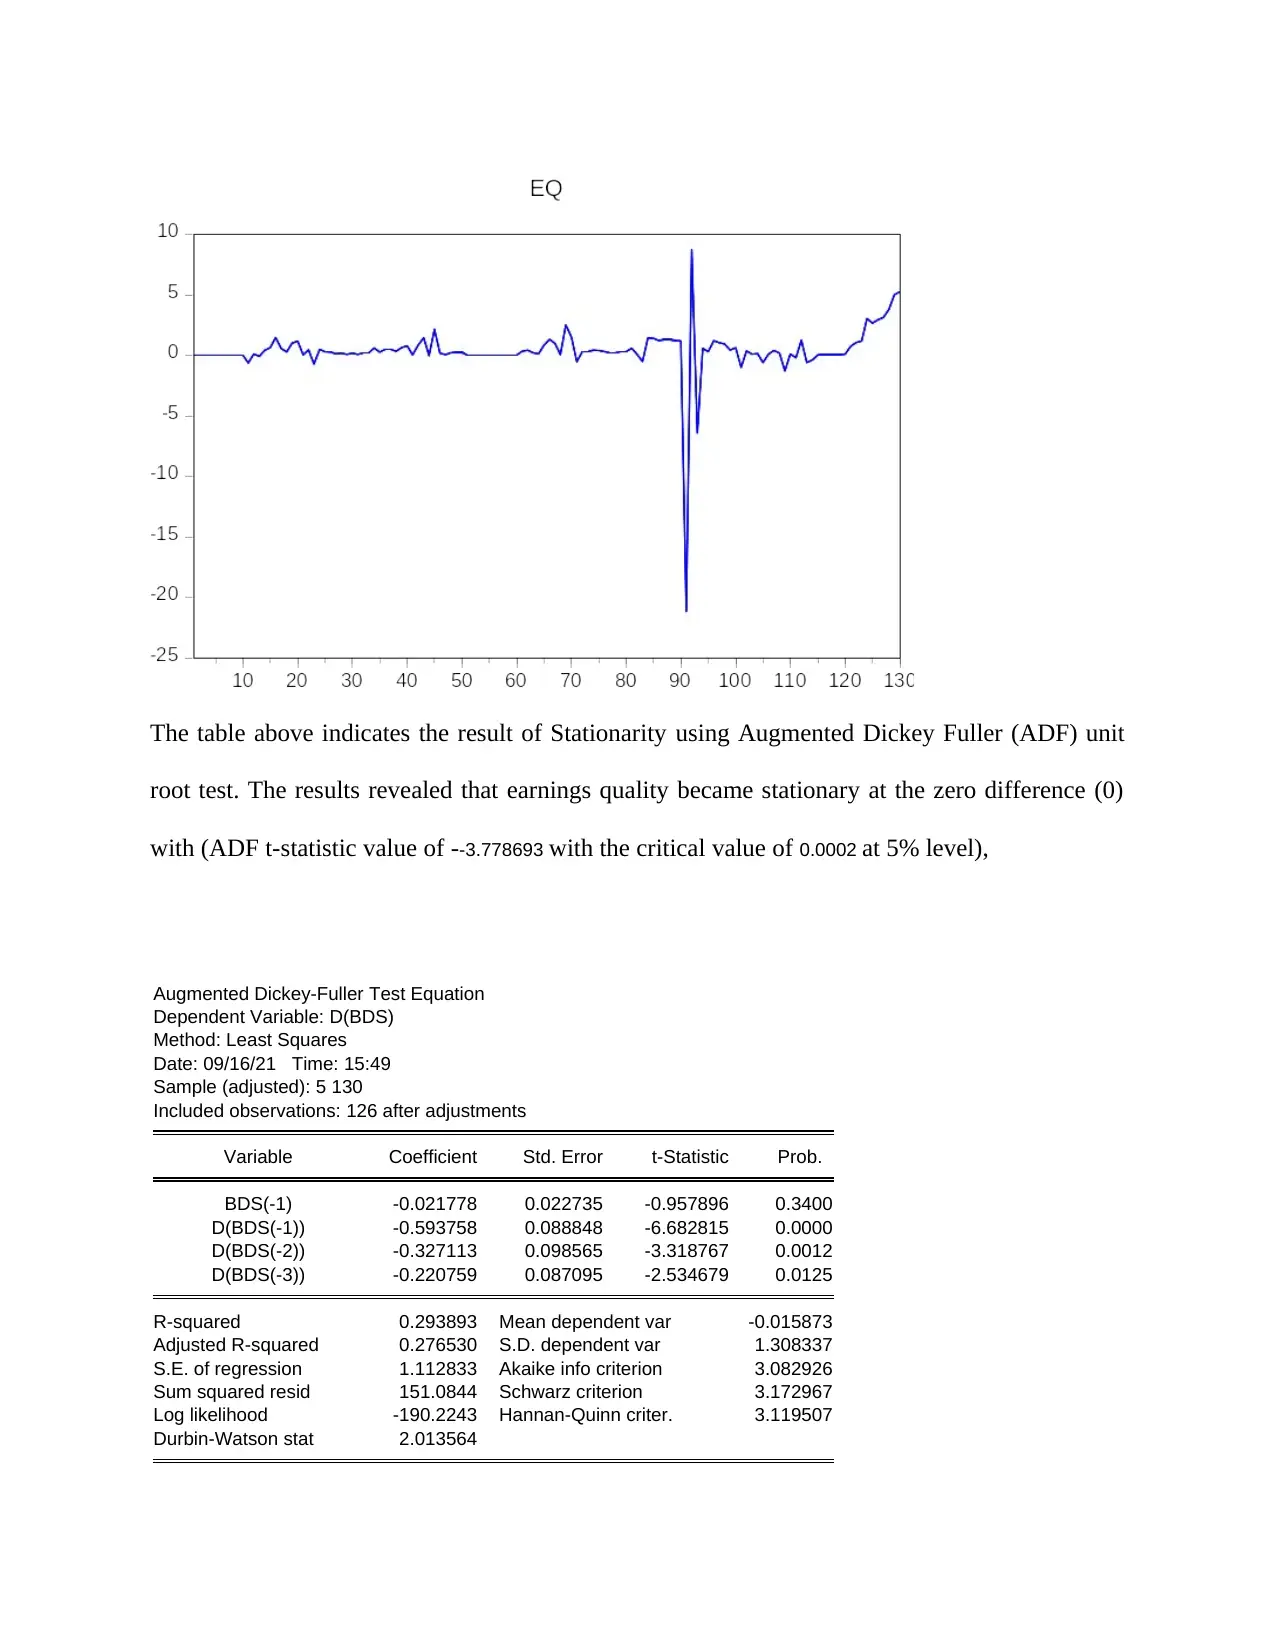
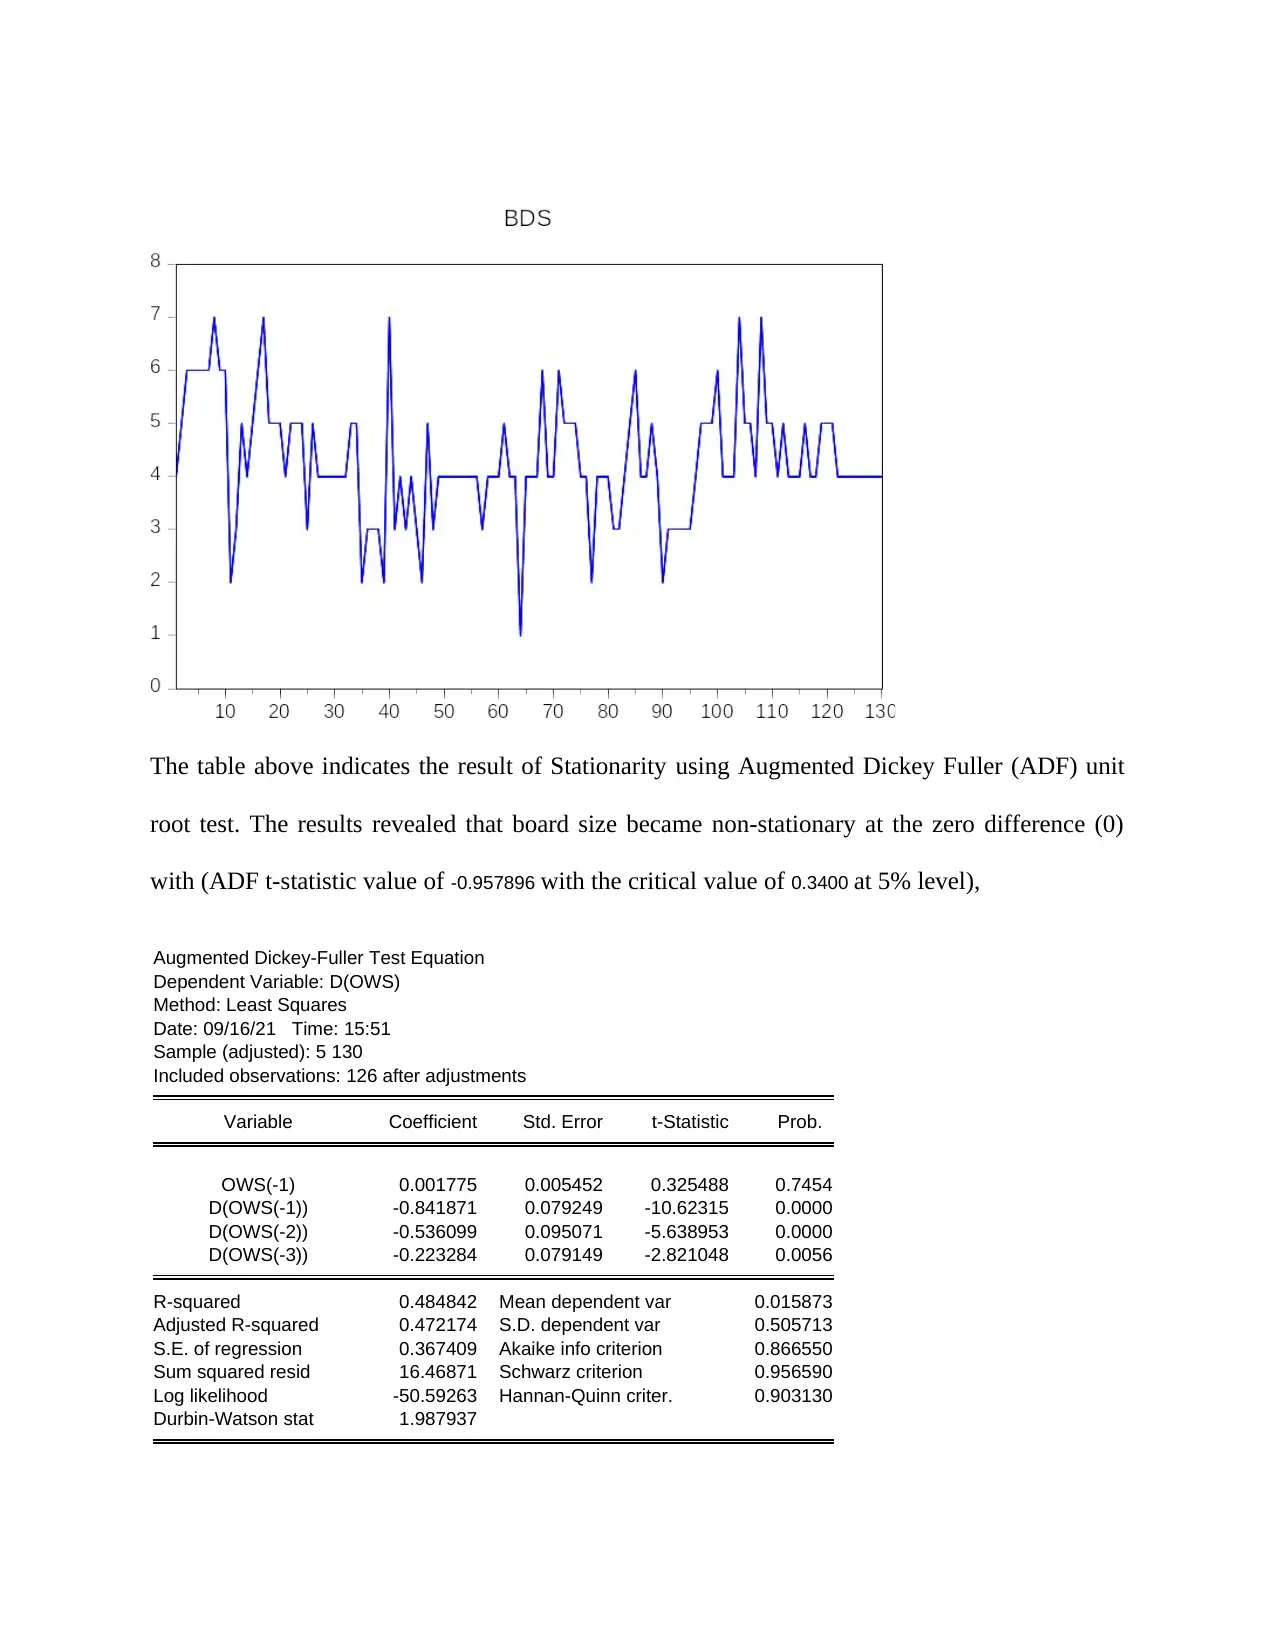
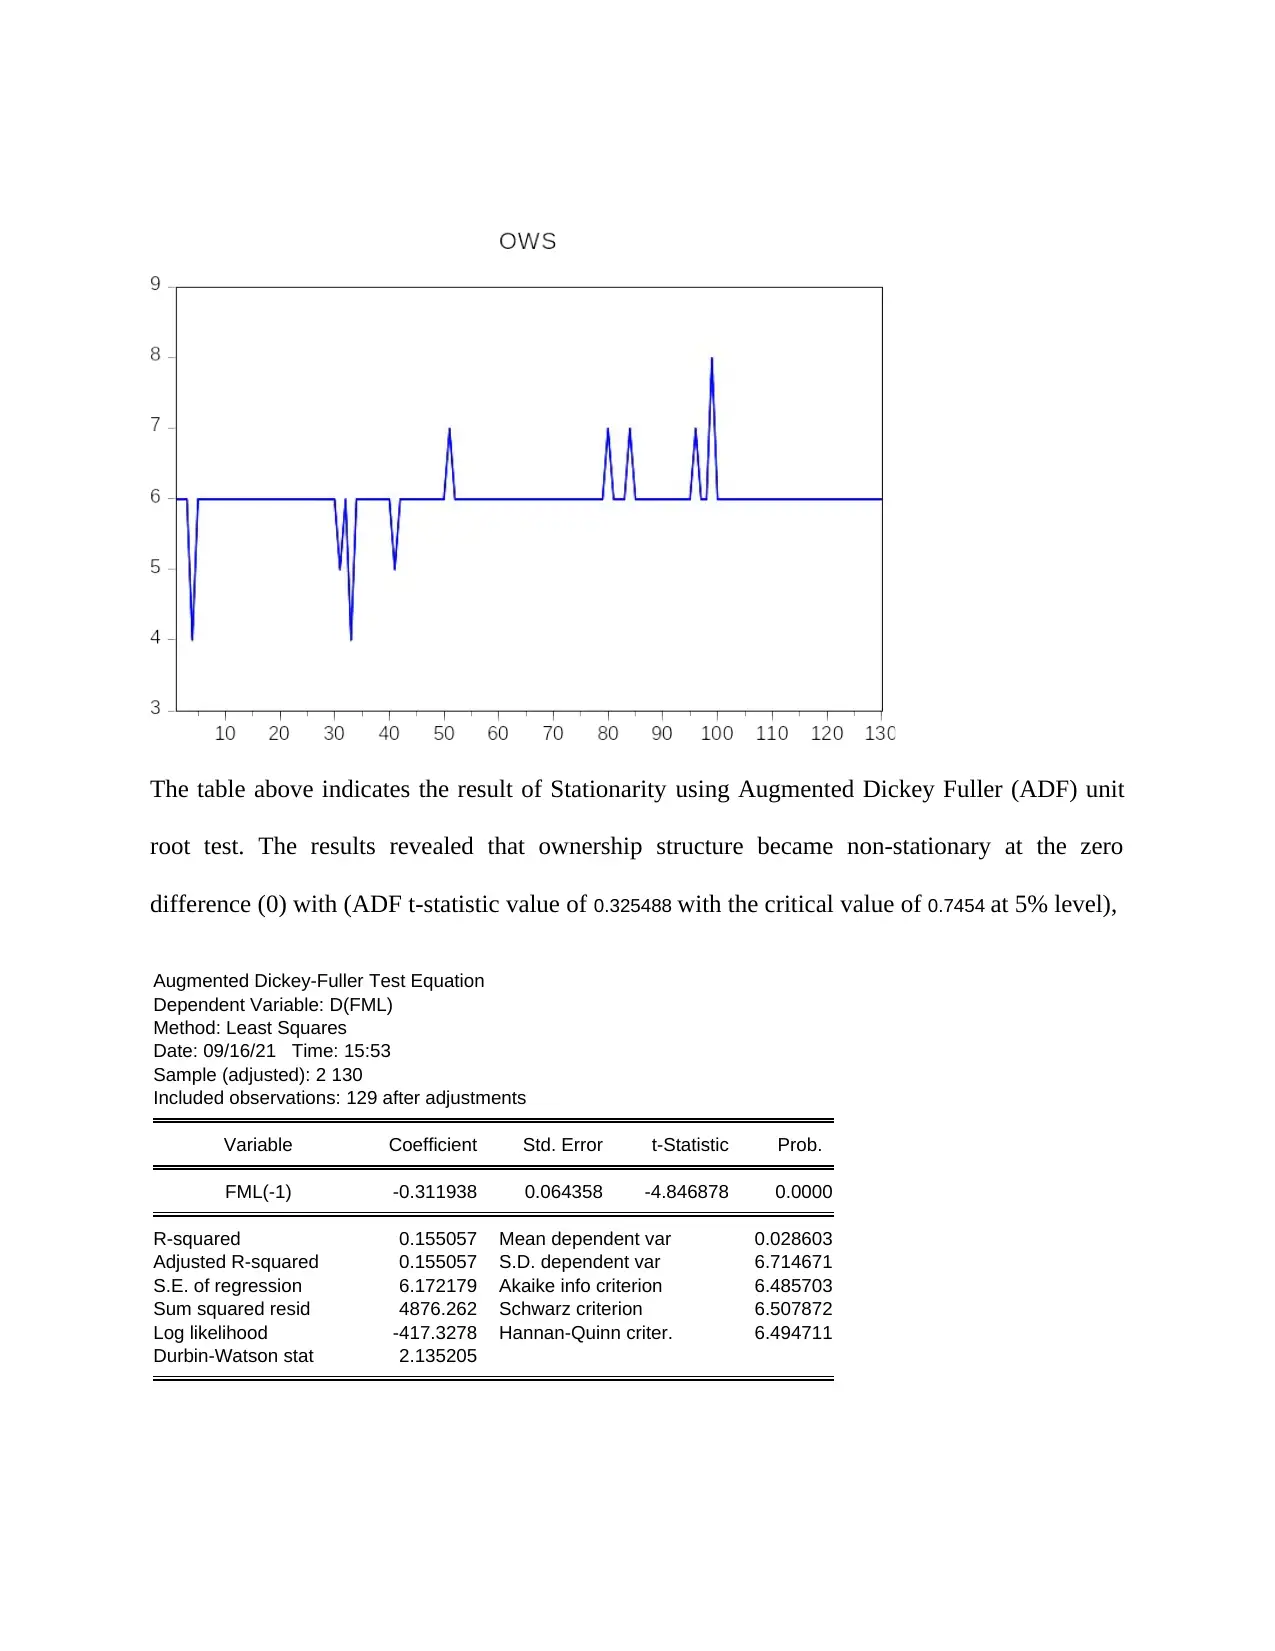
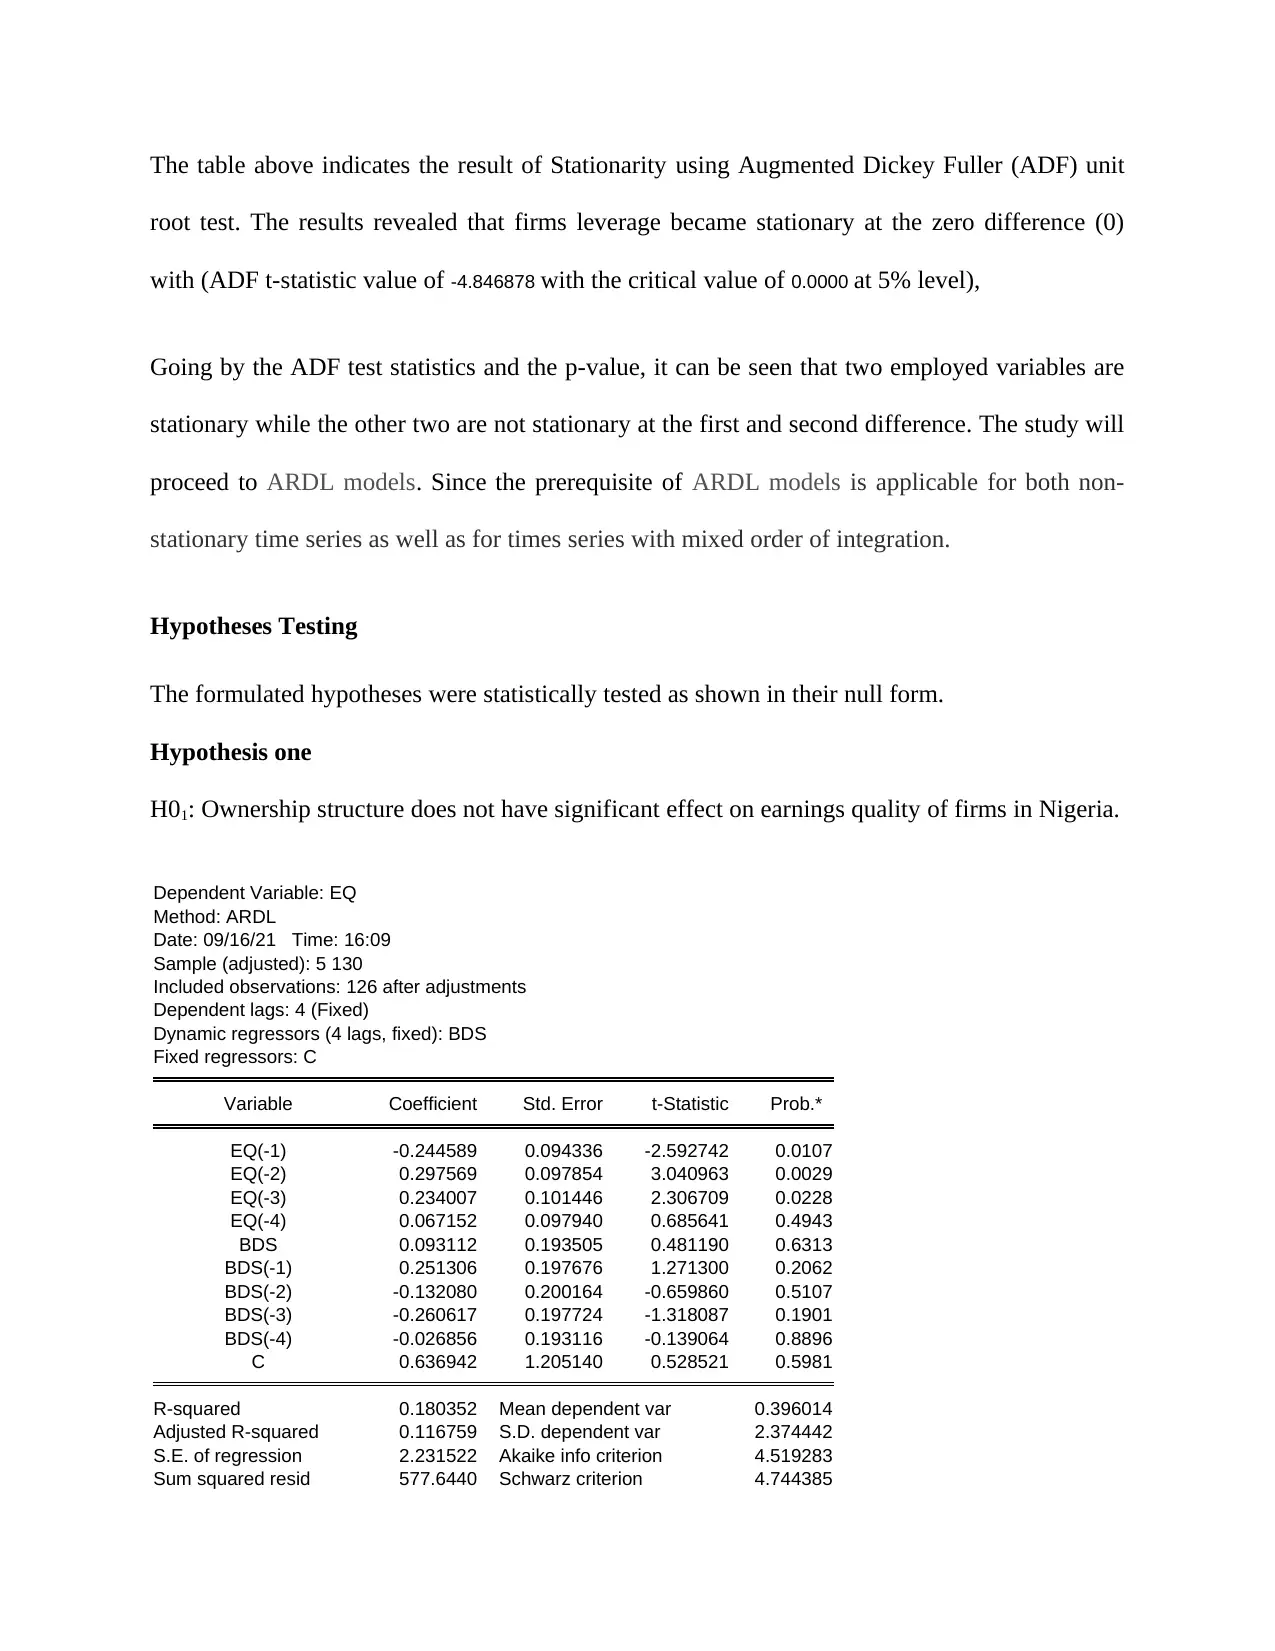
This report presents an analysis of earnings quality in Nigerian banks from 2009 to 2018. It begins with descriptive statistics of key variables like earnings quality (EQ), board size (BDS), firm leverage (FML), and ownership structure (OWS). The study employs Augmented Dickey-Fuller (ADF) tests to assess stationarity, revealing that EQ and FML are stationary at the zero difference. The study then proceeds to utilize ARDL models to test the hypotheses. The findings indicate a significant relationship between board size, ownership structure, firms leverage, and earnings quality. The results indicate that board size, ownership structure, and firm leverage significantly influence earnings quality. The report concludes by discussing these findings, attributing the negative relationship between the variables to a lack of regulatory controls, and suggesting further analysis. The analysis suggests that Nigerian banks use board structure, firm leverage, and ownership structure to manipulate earnings quality.

1 out of 12
Related Documents


Your All-in-One AI-Powered Toolkit for Academic Success.
+13062052269
info@desklib.com
Available 24*7 on WhatsApp / Email
![[object Object]](/_next/static/media/star-bottom.7253800d.svg)
Copyright © 2020–2026 A2Z Services. All Rights Reserved. Developed and managed by ZUCOL.