An Analysis of Population, Sampling, and Decision-Making in Business
VerifiedAdded on 2022/12/27
|17
|5195
|32
Homework Assignment
AI Summary
This assignment explores the critical concepts of population and sampling within the context of business research, emphasizing their importance in research design and data analysis. It delves into various qualitative research methods, including phenomenology, ethnographic research, and grounded theory, providing organizational examples to illustrate their application. The paper contrasts primary and secondary data sources, outlining their differences, advantages, and disadvantages in data collection. Furthermore, it examines decision-making models, highlighting the concerns that arise during the decision-making process and offering organizational examples. The assignment provides a comprehensive overview of key research methodologies and their practical implications for business development and analysis. The content is designed to help students understand the core principles of business research and apply them in real-world scenarios.
4200
1
1
Paraphrase This Document
Need a fresh take? Get an instant paraphrase of this document with our AI Paraphraser
Table of Contents
Question 1........................................................................................................................................3
The importance of the population................................................................................................3
Sampling is becoming increasingly important.............................................................................3
Organizational illustrations of pertinent models, concepts, and hypotheses...............................4
Theories and Research According to Phenomenology................................................................4
Theoretical and applied aspects of qualitative ethnographic research.........................................5
Grounded theories........................................................................................................................5
Question 2........................................................................................................................................7
The contrasts between primary and secondary sources of information.......................................7
Information obtained from primary resources.............................................................................8
Data derived from Secondary sources.........................................................................................9
Question 3......................................................................................................................................11
Qualitative Measures..................................................................................................................11
Question 4......................................................................................................................................13
Concerns that crop up at various points during the process of making a decision....................14
Decision-making Definitions of the Models, Illustrated with Examples from Organizations...14
References......................................................................................................................................17
2
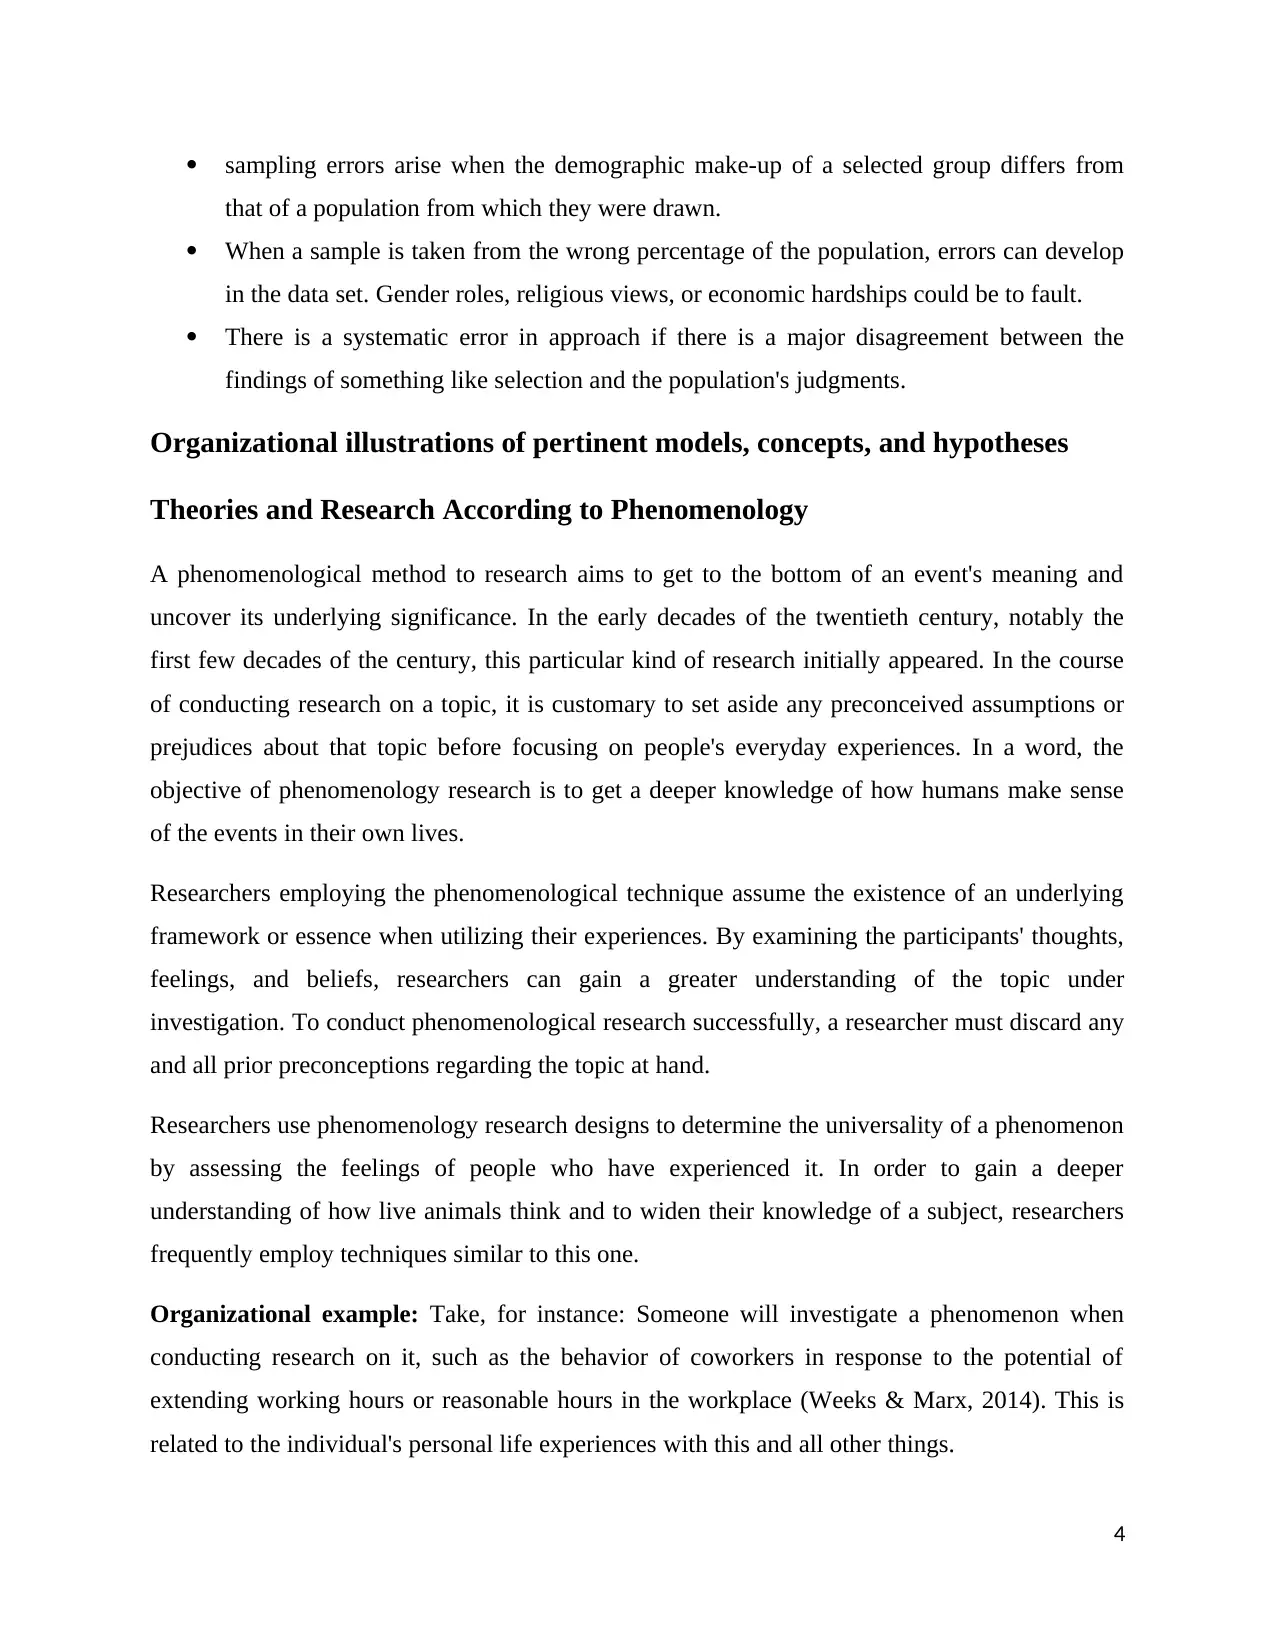
Question 1
When planning a new piece of research, the terms "population" and "sampling" are of critical
importance in the design process. A group of people who share a number of characteristics is
known as a set. A representative cross-section of a broader population or demographic category
is referred to as a sample size. The term "sample size" refers to the number of individuals that are
included in a standard random sample (Hunt, 2018). When scholars have accessibility to a
sample size that has been more precisely calculated, they are able to have a greater measure of
trust in the findings that they draw.
The importance of the population
During an investigation or experiment, the phrase "population" is used to describe a group of
connected entities or occurrences that are being studied. Either a true group of things or an
anticipated, theoretically infinite group of people who are imagined as a generalization based on
previous experience should be the basis for a reaction rate. It doesn't matter if the members of a
demographic make up a whole region or a group of people who share a common attribute; the
demographic is still its own distinct group of individuals. According to statistics, a population is
a generic group of people from which a quantitative population can be selected (Kotler & Gary,
2018). The term "population" is used in statistics to refer to the entire list of all possible
observations, and this list is referred to as the "population." As an illustration, if a study were to
be conducted on the height of adult women, then the subgroup would include the accumulation
of masses for all women on the planet. Researchers employ a parameter known as the p-value to
determine whether or not such a finding is statistically significant. If the p-value is lower than the
significance level at which it was analyzed, the result is considered statistically significant. The
p-value is calculated using the mean and standard deviation of the data samples as the inputs.
Sampling is becoming increasingly important.
This investigation would not have been possible without the results of the sampling. The inherent
discrepancies between the overall population and the sample that is representative of that
population make sampling errors likely. Consequently, it is imperative to adopt an example
method that is both more relevant and also more advantageous. Errors fall into three broad types,
with the most common three being:
3
⊘ This is a preview!⊘
Do you want full access?
Subscribe today to unlock all pages.
Trusted by 1+ million students worldwide
sampling errors arise when the demographic make-up of a selected group differs from
that of a population from which they were drawn.
When a sample is taken from the wrong percentage of the population, errors can develop
in the data set. Gender roles, religious views, or economic hardships could be to fault.
There is a systematic error in approach if there is a major disagreement between the
findings of something like selection and the population's judgments.
Organizational illustrations of pertinent models, concepts, and hypotheses
Theories and Research According to Phenomenology
A phenomenological method to research aims to get to the bottom of an event's meaning and
uncover its underlying significance. In the early decades of the twentieth century, notably the
first few decades of the century, this particular kind of research initially appeared. In the course
of conducting research on a topic, it is customary to set aside any preconceived assumptions or
prejudices about that topic before focusing on people's everyday experiences. In a word, the
objective of phenomenology research is to get a deeper knowledge of how humans make sense
of the events in their own lives.
Researchers employing the phenomenological technique assume the existence of an underlying
framework or essence when utilizing their experiences. By examining the participants' thoughts,
feelings, and beliefs, researchers can gain a greater understanding of the topic under
investigation. To conduct phenomenological research successfully, a researcher must discard any
and all prior preconceptions regarding the topic at hand.
Researchers use phenomenology research designs to determine the universality of a phenomenon
by assessing the feelings of people who have experienced it. In order to gain a deeper
understanding of how live animals think and to widen their knowledge of a subject, researchers
frequently employ techniques similar to this one.
Organizational example: Take, for instance: Someone will investigate a phenomenon when
conducting research on it, such as the behavior of coworkers in response to the potential of
extending working hours or reasonable hours in the workplace (Weeks & Marx, 2014). This is
related to the individual's personal life experiences with this and all other things.
4
Paraphrase This Document
Need a fresh take? Get an instant paraphrase of this document with our AI Paraphraser
Theoretical and applied aspects of qualitative ethnographic research
By going in depth in a group and observing the behavioral patterns of its members, one can
conduct research. Participant observation describes this form of observation. This is another
definition of hypocrisy: an ethno is a data analysis prepared by that of the ethnomusicologist
upon the conclusion of the study. As a flexible research method, ethnography provides a
comprehensive grasp of the norms, morals, and trends of groups. There are still many physical
and moral difficulties to be overcome.
Ethnography has the benefit of enabling scholars to explore the practices and traditions of a
specific community. It is a wonderful opportunity to observe people's behavior in a given
situation. Rather of carrying out interviews with an economic expert, one can learn so much
about a topic and observe their dynamics by immersing oneself in a social context. Due to the
absence of a social environment, it was unable to openly question the topic. However, the
adaptability and accessibility of ethnographic make it a useful tool. This book contains no overall
theory, but rather a comprehensive examination of a particular subculture. On this basis, they
will be able to examine a vast array of individuals & environmental factors.
There are numerous time-consuming issues that must be resolved. Anthropology is a time-
consuming endeavor. To obtain a thorough awareness of the present, it is essential for the
individual to spend a few months immersed in the location and acquiring solid knowledge.
Therefore, total immersion is a precondition for genuine experience in the environment. Such
long-term commitments necessitate meticulous planning to avoid complications. Observer bias
can be a difficulty in ethnographic research. To write an ethnography, one must be able to
emotionally distance themselves from the group they are investigating, which can be
challenging. Consequently, ethical issues such as how the function is revealed to the organisation
or how sensitive information is identified and reported must typically be considered.
Organizational example: Any study in which participants are interviewed about their
perspectives on the possibilities of extending workdays and employment hours, either in-person
or via webcams installed in their workplaces and homes, is considered ethnographic research.
Grounded theories
5
This kind of qualitative research, known as "theoretical framework," has been widely adopted by
sociologists in recent decades. Methodology refers to the process of collecting and analyzing
data. After this, theories and hypotheses are developed. The development of grounded theory
requires the use of inductive reasoning.
An example from the organizational world: The department of human resources frequently
makes use of well-established theory. As a starting point, it may be worthwhile to look at how
their employees react to the thought of working longer shifts, both during the day and at night, at
Workplace. HR will collect this data, run an analysis, and give their recommendations as a result
of this research.
6
⊘ This is a preview!⊘
Do you want full access?
Subscribe today to unlock all pages.
Trusted by 1+ million students worldwide
Question 2
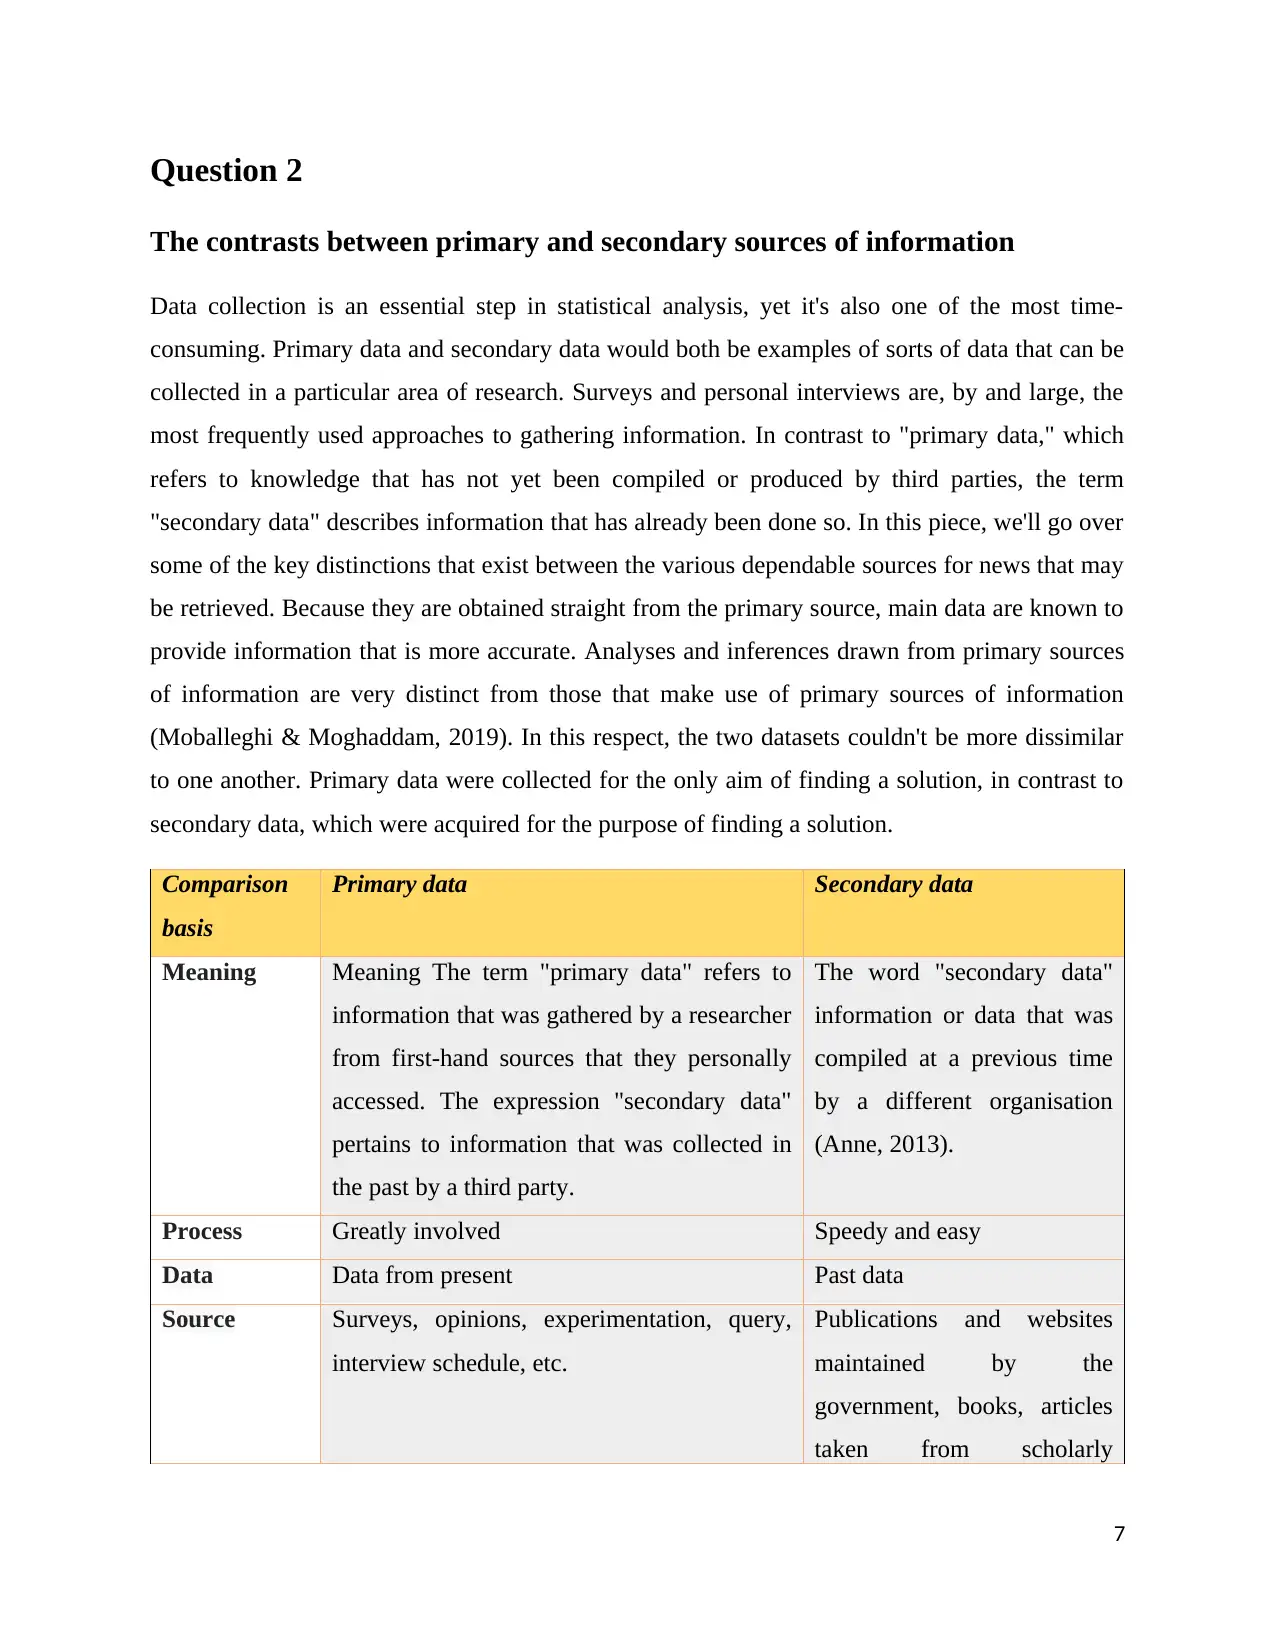
The contrasts between primary and secondary sources of information
Data collection is an essential step in statistical analysis, yet it's also one of the most time-
consuming. Primary data and secondary data would both be examples of sorts of data that can be
collected in a particular area of research. Surveys and personal interviews are, by and large, the
most frequently used approaches to gathering information. In contrast to "primary data," which
refers to knowledge that has not yet been compiled or produced by third parties, the term
"secondary data" describes information that has already been done so. In this piece, we'll go over
some of the key distinctions that exist between the various dependable sources for news that may
be retrieved. Because they are obtained straight from the primary source, main data are known to
provide information that is more accurate. Analyses and inferences drawn from primary sources
of information are very distinct from those that make use of primary sources of information
(Moballeghi & Moghaddam, 2019). In this respect, the two datasets couldn't be more dissimilar
to one another. Primary data were collected for the only aim of finding a solution, in contrast to
secondary data, which were acquired for the purpose of finding a solution.
Comparison
basis
Primary data Secondary data
Meaning Meaning The term "primary data" refers to
information that was gathered by a researcher
from first-hand sources that they personally
accessed. The expression "secondary data"
pertains to information that was collected in
the past by a third party.
The word "secondary data"
information or data that was
compiled at a previous time
by a different organisation
(Anne, 2013).
Process Greatly involved Speedy and easy
Data Data from present Past data
Source Surveys, opinions, experimentation, query,
interview schedule, etc.
Publications and websites
maintained by the
government, books, articles
taken from scholarly
7
Paraphrase This Document
Need a fresh take? Get an instant paraphrase of this document with our AI Paraphraser
journals, internal records, and
other such materials.
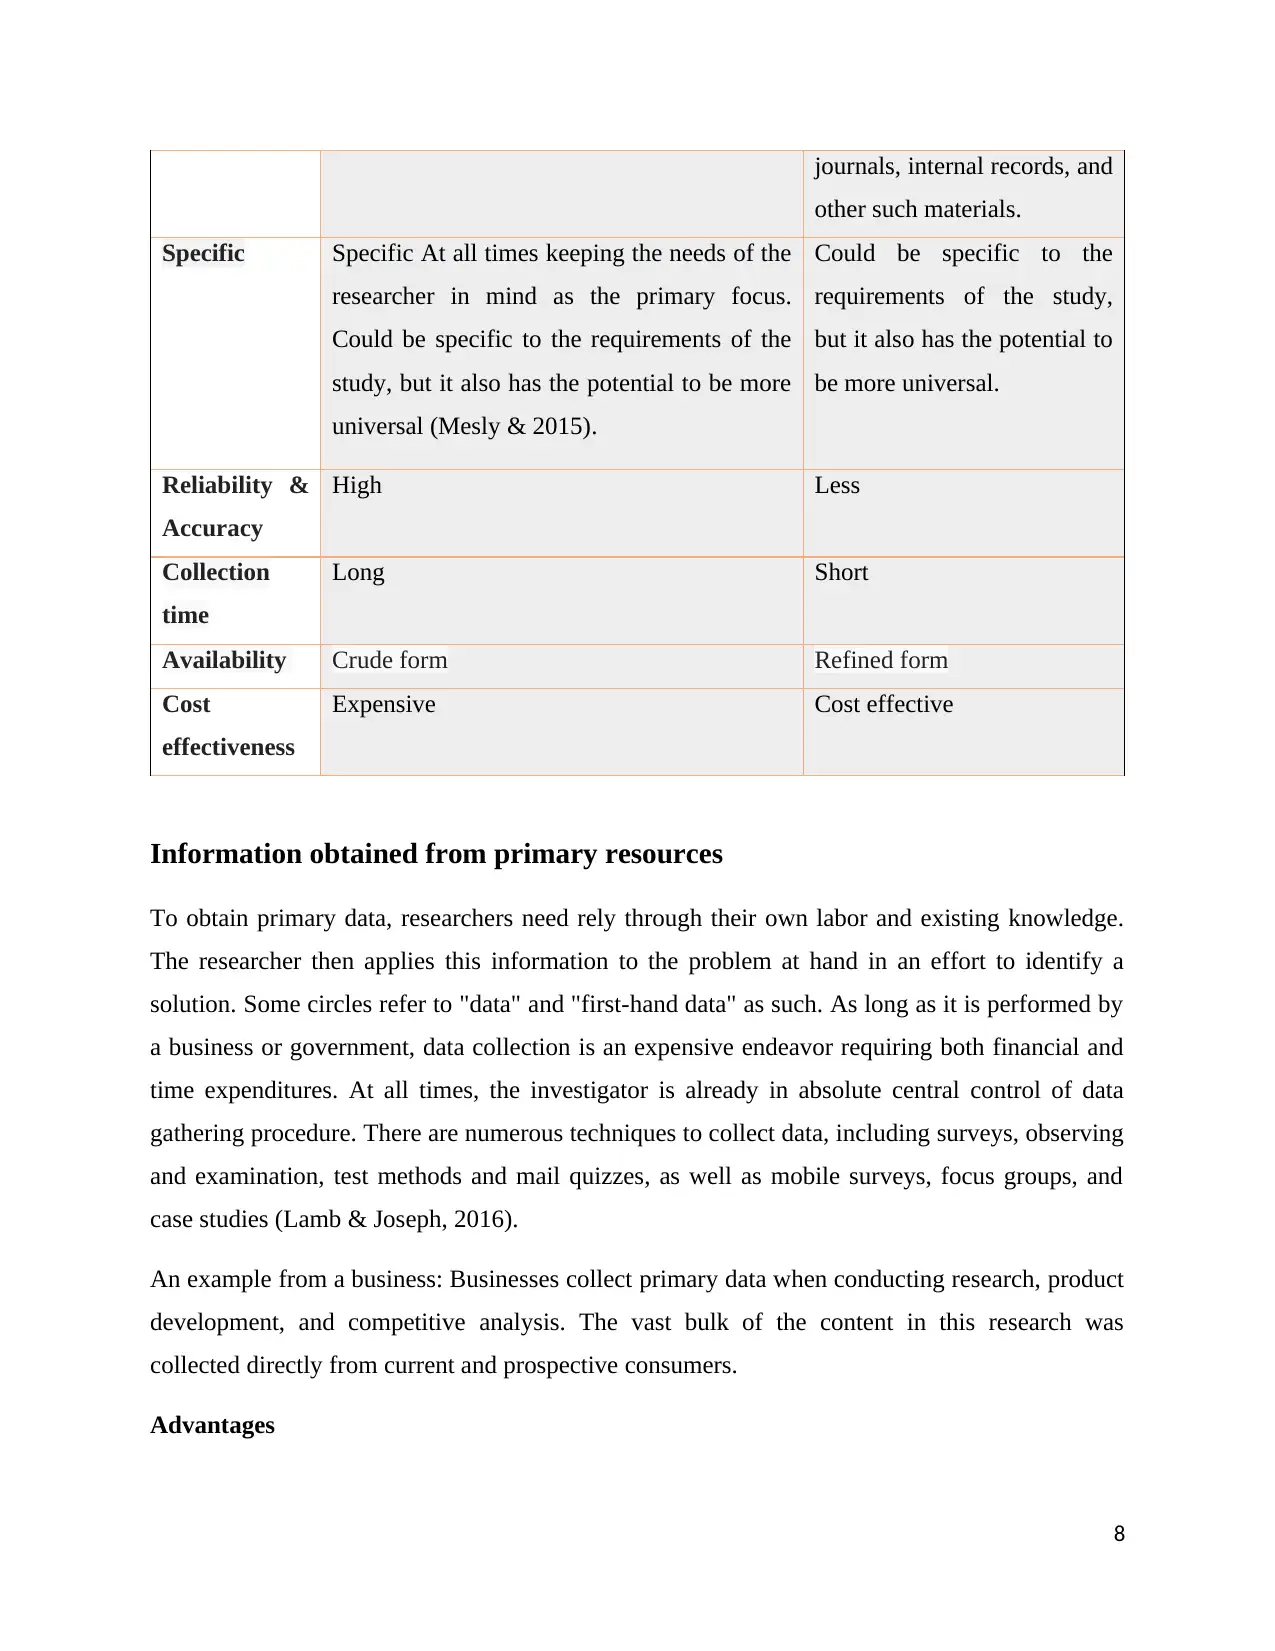
Specific Specific At all times keeping the needs of the
researcher in mind as the primary focus.
Could be specific to the requirements of the
study, but it also has the potential to be more
universal (Mesly & 2015).
Could be specific to the
requirements of the study,
but it also has the potential to
be more universal.
Reliability &
Accuracy
High Less
Collection
time
Long Short
Availability Crude form Refined form
Cost
effectiveness
Expensive Cost effective
Information obtained from primary resources
To obtain primary data, researchers need rely through their own labor and existing knowledge.
The researcher then applies this information to the problem at hand in an effort to identify a
solution. Some circles refer to "data" and "first-hand data" as such. As long as it is performed by
a business or government, data collection is an expensive endeavor requiring both financial and
time expenditures. At all times, the investigator is already in absolute central control of data
gathering procedure. There are numerous techniques to collect data, including surveys, observing
and examination, test methods and mail quizzes, as well as mobile surveys, focus groups, and
case studies (Lamb & Joseph, 2016).
An example from a business: Businesses collect primary data when conducting research, product
development, and competitive analysis. The vast bulk of the content in this research was
collected directly from current and prospective consumers.
Advantages
8
other such materials.
Specific Specific At all times keeping the needs of the
researcher in mind as the primary focus.
Could be specific to the requirements of the
study, but it also has the potential to be more
universal (Mesly & 2015).
Could be specific to the
requirements of the study,
but it also has the potential to
be more universal.
Reliability &
Accuracy
High Less
Collection
time
Long Short
Availability Crude form Refined form
Cost
effectiveness
Expensive Cost effective
Information obtained from primary resources
To obtain primary data, researchers need rely through their own labor and existing knowledge.
The researcher then applies this information to the problem at hand in an effort to identify a
solution. Some circles refer to "data" and "first-hand data" as such. As long as it is performed by
a business or government, data collection is an expensive endeavor requiring both financial and
time expenditures. At all times, the investigator is already in absolute central control of data
gathering procedure. There are numerous techniques to collect data, including surveys, observing
and examination, test methods and mail quizzes, as well as mobile surveys, focus groups, and
case studies (Lamb & Joseph, 2016).
An example from a business: Businesses collect primary data when conducting research, product
development, and competitive analysis. The vast bulk of the content in this research was
collected directly from current and prospective consumers.
Advantages
8
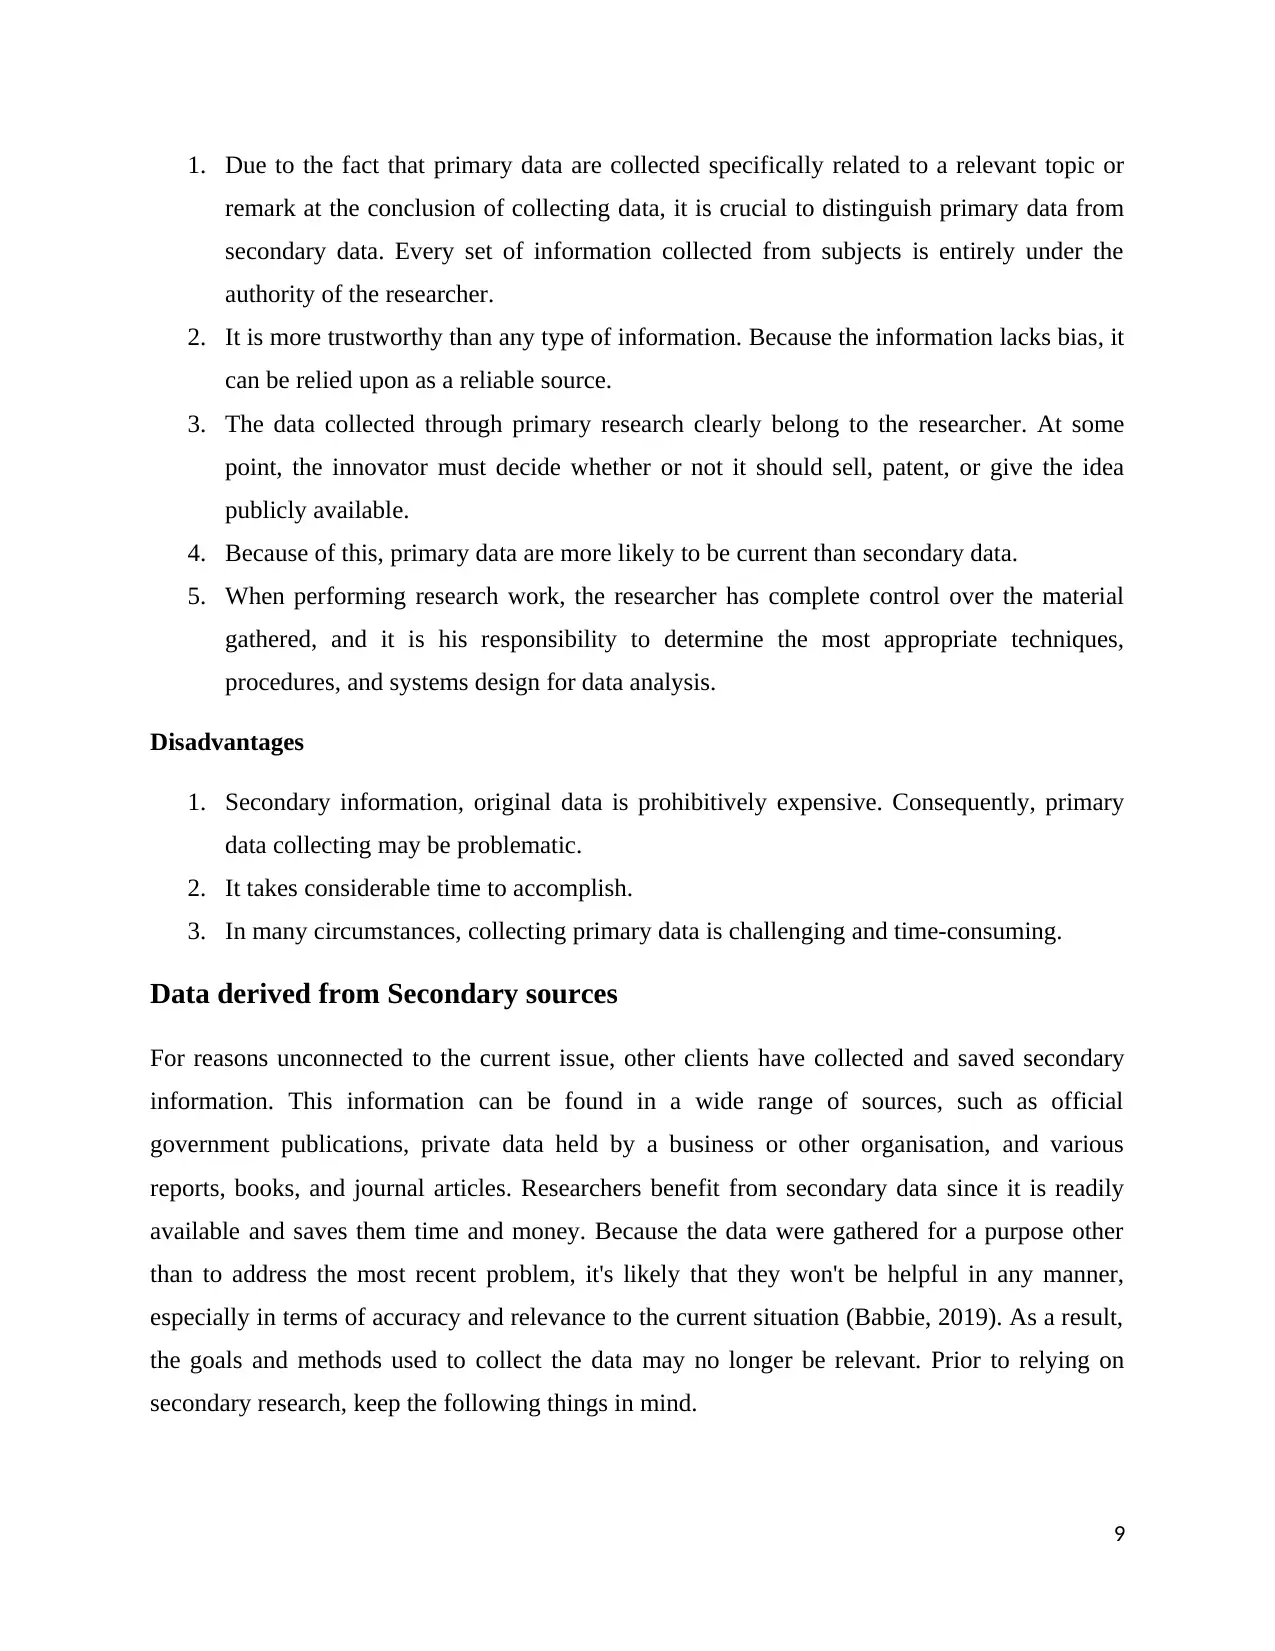
1. Due to the fact that primary data are collected specifically related to a relevant topic or
remark at the conclusion of collecting data, it is crucial to distinguish primary data from
secondary data. Every set of information collected from subjects is entirely under the
authority of the researcher.
2. It is more trustworthy than any type of information. Because the information lacks bias, it
can be relied upon as a reliable source.
3. The data collected through primary research clearly belong to the researcher. At some
point, the innovator must decide whether or not it should sell, patent, or give the idea
publicly available.
4. Because of this, primary data are more likely to be current than secondary data.
5. When performing research work, the researcher has complete control over the material
gathered, and it is his responsibility to determine the most appropriate techniques,
procedures, and systems design for data analysis.
Disadvantages
1. Secondary information, original data is prohibitively expensive. Consequently, primary
data collecting may be problematic.
2. It takes considerable time to accomplish.
3. In many circumstances, collecting primary data is challenging and time-consuming.
Data derived from Secondary sources
For reasons unconnected to the current issue, other clients have collected and saved secondary
information. This information can be found in a wide range of sources, such as official
government publications, private data held by a business or other organisation, and various
reports, books, and journal articles. Researchers benefit from secondary data since it is readily
available and saves them time and money. Because the data were gathered for a purpose other
than to address the most recent problem, it's likely that they won't be helpful in any manner,
especially in terms of accuracy and relevance to the current situation (Babbie, 2019). As a result,
the goals and methods used to collect the data may no longer be relevant. Prior to relying on
secondary research, keep the following things in mind.
9
⊘ This is a preview!⊘
Do you want full access?
Subscribe today to unlock all pages.
Trusted by 1+ million students worldwide
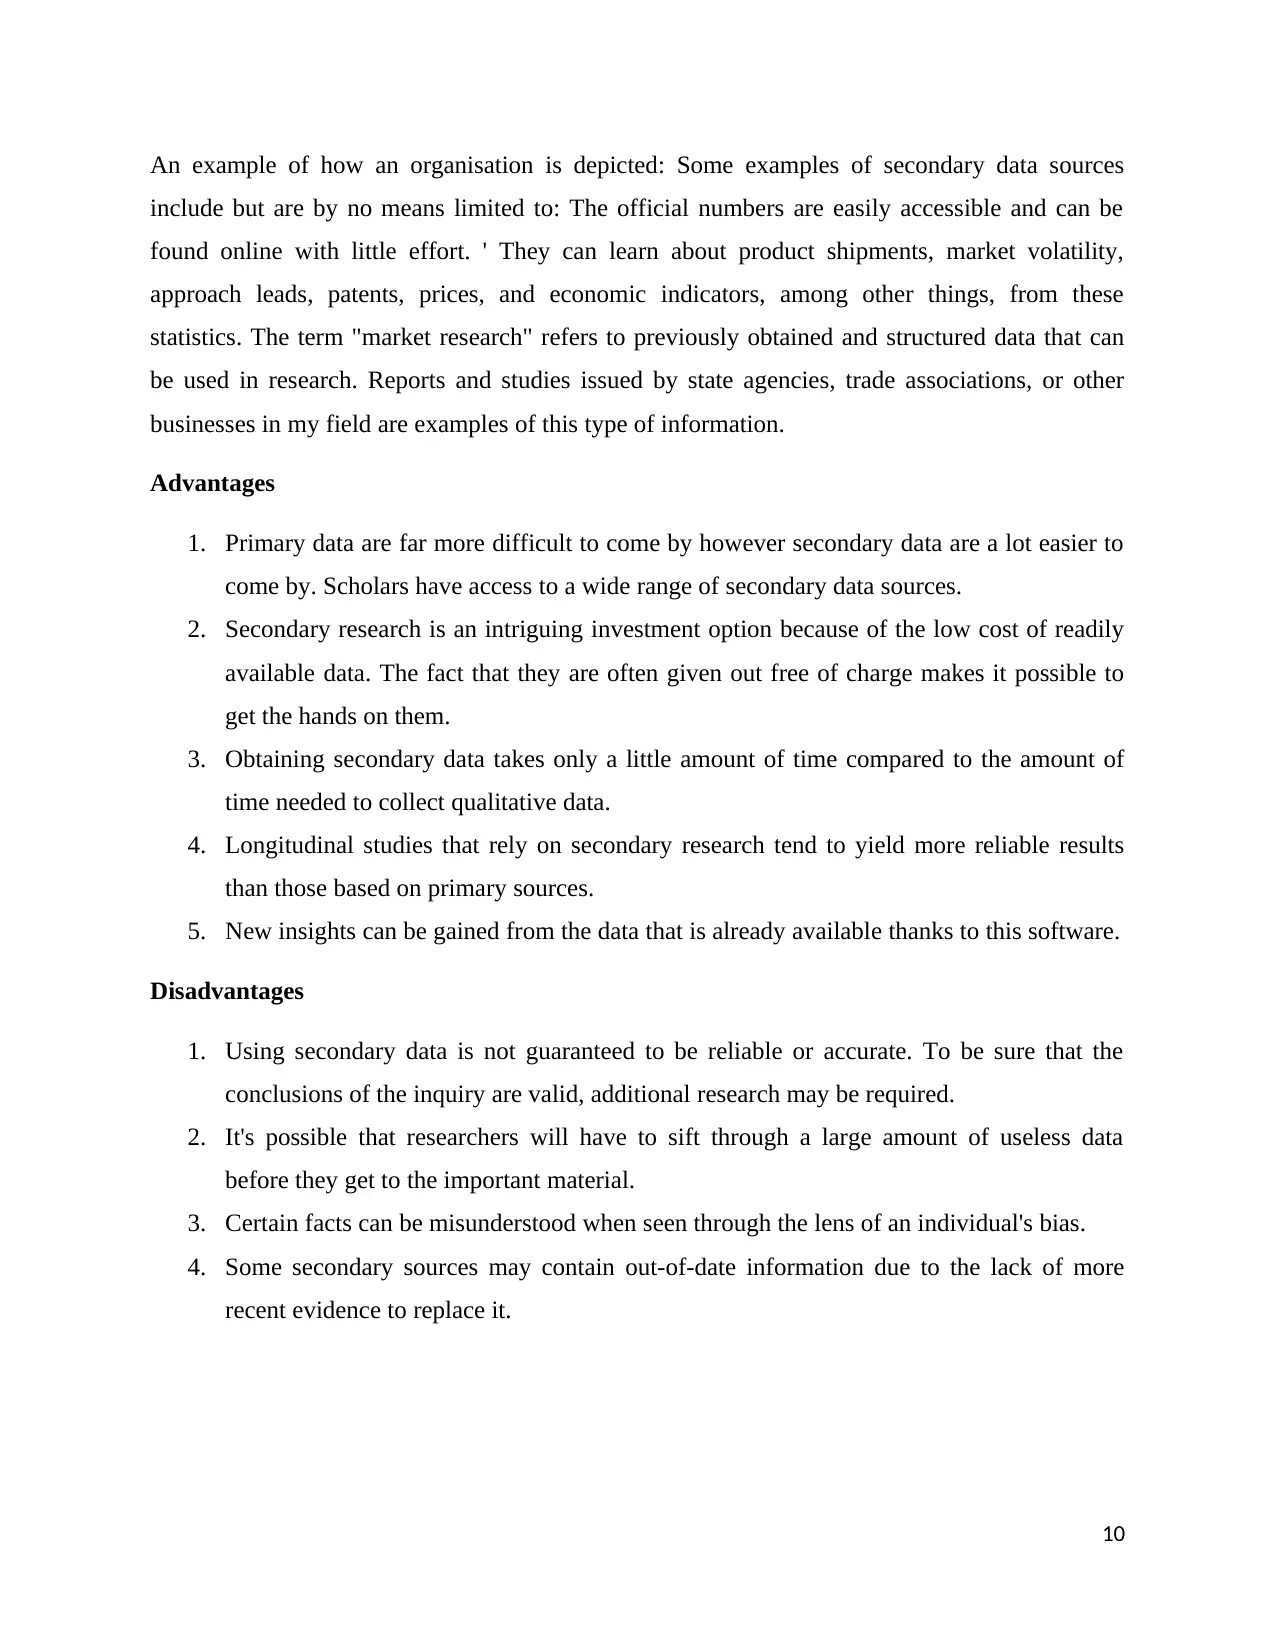
An example of how an organisation is depicted: Some examples of secondary data sources
include but are by no means limited to: The official numbers are easily accessible and can be
found online with little effort. ' They can learn about product shipments, market volatility,
approach leads, patents, prices, and economic indicators, among other things, from these
statistics. The term "market research" refers to previously obtained and structured data that can
be used in research. Reports and studies issued by state agencies, trade associations, or other
businesses in my field are examples of this type of information.
Advantages
1. Primary data are far more difficult to come by however secondary data are a lot easier to
come by. Scholars have access to a wide range of secondary data sources.
2. Secondary research is an intriguing investment option because of the low cost of readily
available data. The fact that they are often given out free of charge makes it possible to
get the hands on them.
3. Obtaining secondary data takes only a little amount of time compared to the amount of
time needed to collect qualitative data.
4. Longitudinal studies that rely on secondary research tend to yield more reliable results
than those based on primary sources.
5. New insights can be gained from the data that is already available thanks to this software.
Disadvantages
1. Using secondary data is not guaranteed to be reliable or accurate. To be sure that the
conclusions of the inquiry are valid, additional research may be required.
2. It's possible that researchers will have to sift through a large amount of useless data
before they get to the important material.
3. Certain facts can be misunderstood when seen through the lens of an individual's bias.
4. Some secondary sources may contain out-of-date information due to the lack of more
recent evidence to replace it.
10
Paraphrase This Document
Need a fresh take? Get an instant paraphrase of this document with our AI Paraphraser
Question 3
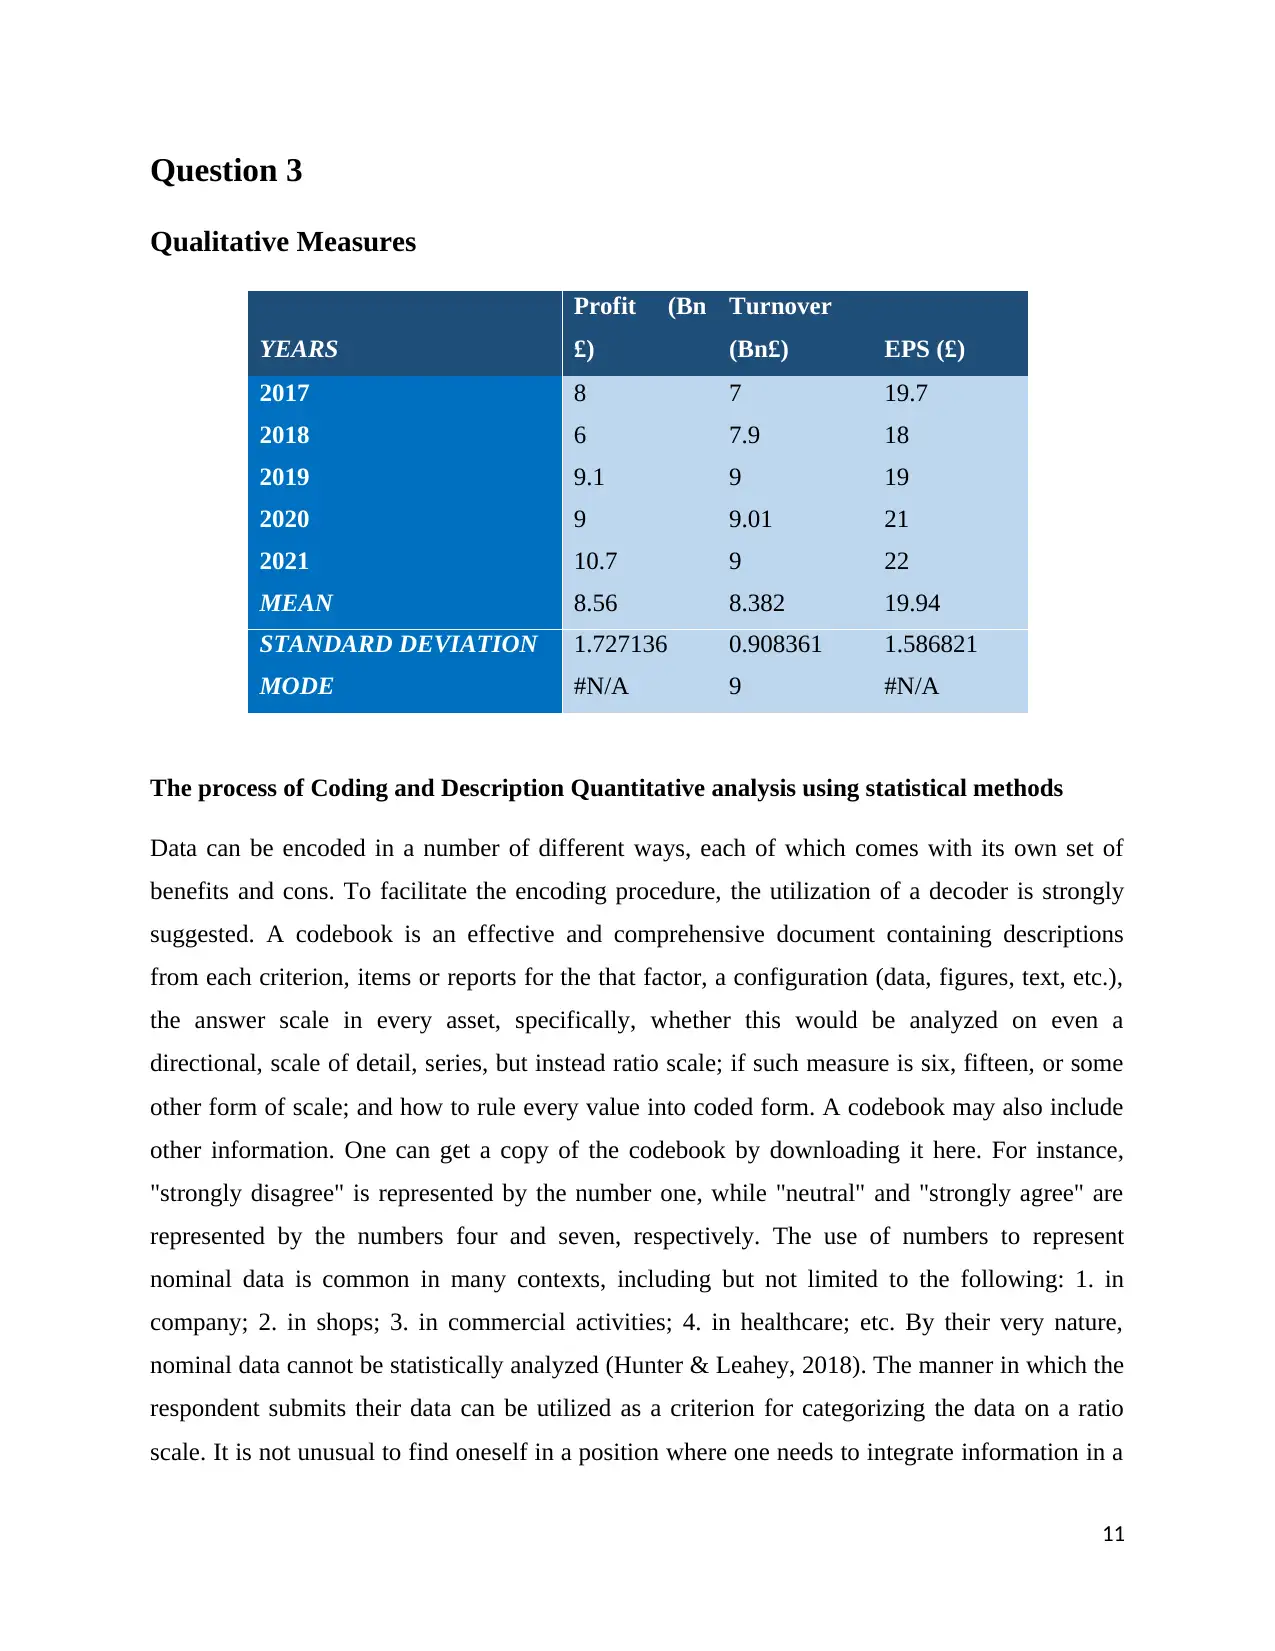
Qualitative Measures
YEARS
Profit (Bn
£)
Turnover
(Bn£) EPS (£)
2017 8 7 19.7
2018 6 7.9 18
2019 9.1 9 19
2020 9 9.01 21
2021 10.7 9 22
MEAN 8.56 8.382 19.94
STANDARD DEVIATION 1.727136 0.908361 1.586821
MODE #N/A 9 #N/A
The process of Coding and Description Quantitative analysis using statistical methods
Data can be encoded in a number of different ways, each of which comes with its own set of
benefits and cons. To facilitate the encoding procedure, the utilization of a decoder is strongly
suggested. A codebook is an effective and comprehensive document containing descriptions
from each criterion, items or reports for the that factor, a configuration (data, figures, text, etc.),
the answer scale in every asset, specifically, whether this would be analyzed on even a
directional, scale of detail, series, but instead ratio scale; if such measure is six, fifteen, or some
other form of scale; and how to rule every value into coded form. A codebook may also include
other information. One can get a copy of the codebook by downloading it here. For instance,
"strongly disagree" is represented by the number one, while "neutral" and "strongly agree" are
represented by the numbers four and seven, respectively. The use of numbers to represent
nominal data is common in many contexts, including but not limited to the following: 1. in
company; 2. in shops; 3. in commercial activities; 4. in healthcare; etc. By their very nature,
nominal data cannot be statistically analyzed (Hunter & Leahey, 2018). The manner in which the
respondent submits their data can be utilized as a criterion for categorizing the data on a ratio
scale. It is not unusual to find oneself in a position where one needs to integrate information in a
11
form that is different from what was utilized to obtain the data. Respondents to a survey can be
asked to select the maximum number of items from a list of advantages from which they can
choose. For instance, to measure the advantages of computers, respondents can indeed be asked
to select the maximum number of items from a list of advantages from which they can choose.
This means that respondents are free to select as many advantages as they see fit. Transcripts of
interviews, for instance, are not suitable for use in statistical analysis due to the fact that they do
not satisfy the criteria. When working with a large number of different parameters and measures,
coding is an extremely useful skill to have. When doing this kind of study, it is standard practice
to have more than one person participate in the coding process. In addition, those who code data,
as well as those who read and analyze coded data, can use this as a tool to help them with their
work.
12
⊘ This is a preview!⊘
Do you want full access?
Subscribe today to unlock all pages.
Trusted by 1+ million students worldwide
1 out of 17
Related Documents


Your All-in-One AI-Powered Toolkit for Academic Success.
+13062052269
info@desklib.com
Available 24*7 on WhatsApp / Email
![[object Object]](/_next/static/media/star-bottom.7253800d.svg)
Unlock your academic potential
Copyright © 2020–2026 A2Z Services. All Rights Reserved. Developed and managed by ZUCOL.