Catchment Modelling for Blackwattle Bay
VerifiedAdded on 2022/10/04
|16
|3259
|65
AI Summary
This document provides a detailed analysis of catchment modelling for Blackwattle Bay, including rainfall estimation, runoff estimation, and hydraulic modelling. It also includes information on sewer flow modelling, overland flow modelling, and hydraulic roughness.
Contribute Materials
Your contribution can guide someone’s learning journey. Share your
documents today.

49255 CATCHMENT MODELLING 1
49255 CATCHMENT MODELLING
By Name
Course
Instructor
Institution
Location
Date
49255 CATCHMENT MODELLING
By Name
Course
Instructor
Institution
Location
Date
Secure Best Marks with AI Grader
Need help grading? Try our AI Grader for instant feedback on your assignments.

49255 CATCHMENT MODELLING 2
Catchment Details:
The catchment area of the Blackwattle bay is situated in Sydney´s inner city suburbs.
This area covers 315 hectares and it also have other 50 hectares of land which drains directly into
Blackwattle Bay. The other section is draining to the Sydney water´s chief stalk drainage system
which is employed to route flows from the upper section of this catchment. The reliability of this
flood relates to the topography nature in this area and also the capacity of service given by the
assets drainage. The catchment slope pattern is stepper in the upper area, it is steep and undulant
in the center section and also flat at the lower section which is closer to Blackwattle Bay.
49255 CATCHMENT MODELLING 3
Table of Contents
Catchment Details:....................................................................................................................................2
Table of Contents........................................................................................................................................3
Introduction:................................................................................................................................................4
Rainfall estimation (Generation).................................................................................................................7
Runoff estimation........................................................................................................................................9
Initial losses.............................................................................................................................................9
Depression storage and surface wetting...............................................................................................9
Interception:.......................................................................................................................................10
Continuing losses:.................................................................................................................................10
Evaporation:......................................................................................................................................10
Infiltration:.........................................................................................................................................11
MODEL BUILD........................................................................................................................................11
Sewer Flow Modeling:..........................................................................................................................11
Overland flow modelling:......................................................................................................................12
Hydraulic Modelling (Transport)...........................................................................................................12
Bridges and Culverts.........................................................................................................................12
Hydraulic Roughness.........................................................................................................................13
Modelling of Flow Obstructions in the Floodplain............................................................................13
Bibliography...............................................................................................................................................16

49255 CATCHMENT MODELLING 4
Introduction:
For this project we are checking on the impact of the pluvial and fluvial flows in the
catchment areas which are draining into Blackwattle bay. There are two basic issues which
needs to be considered during the conceptual modelling and this modelling should be done in
regards to two scenarios (Kleinman, 2015). Pluvial is a type of flooding that is more linked to its
cause being rainfall. In most cases it occurs due to heavy rainfall, these heavy downpour results
to surface water runoff whose capacity is more than that of the city´s drainage system. It is very
hard to foretell pluvial than other flooding types like fluvial since it occurs in a short span of time
duration and it can also pond before it is a runoff (Blanc, 2012).Basically pluvial flooding
correlates to direct ponding or runoff before going into a system of drainage.
For this project we can use the two phenomena that is watercourse flooding, runoff and
also surcharge which can be employed as pluvial flooding components (Feyen, 2012). All these
three can be connected together and then they are modelled in pluvial flooding section. A part
from the aforementioned three we can as well consider the groundwater such as the fluvial
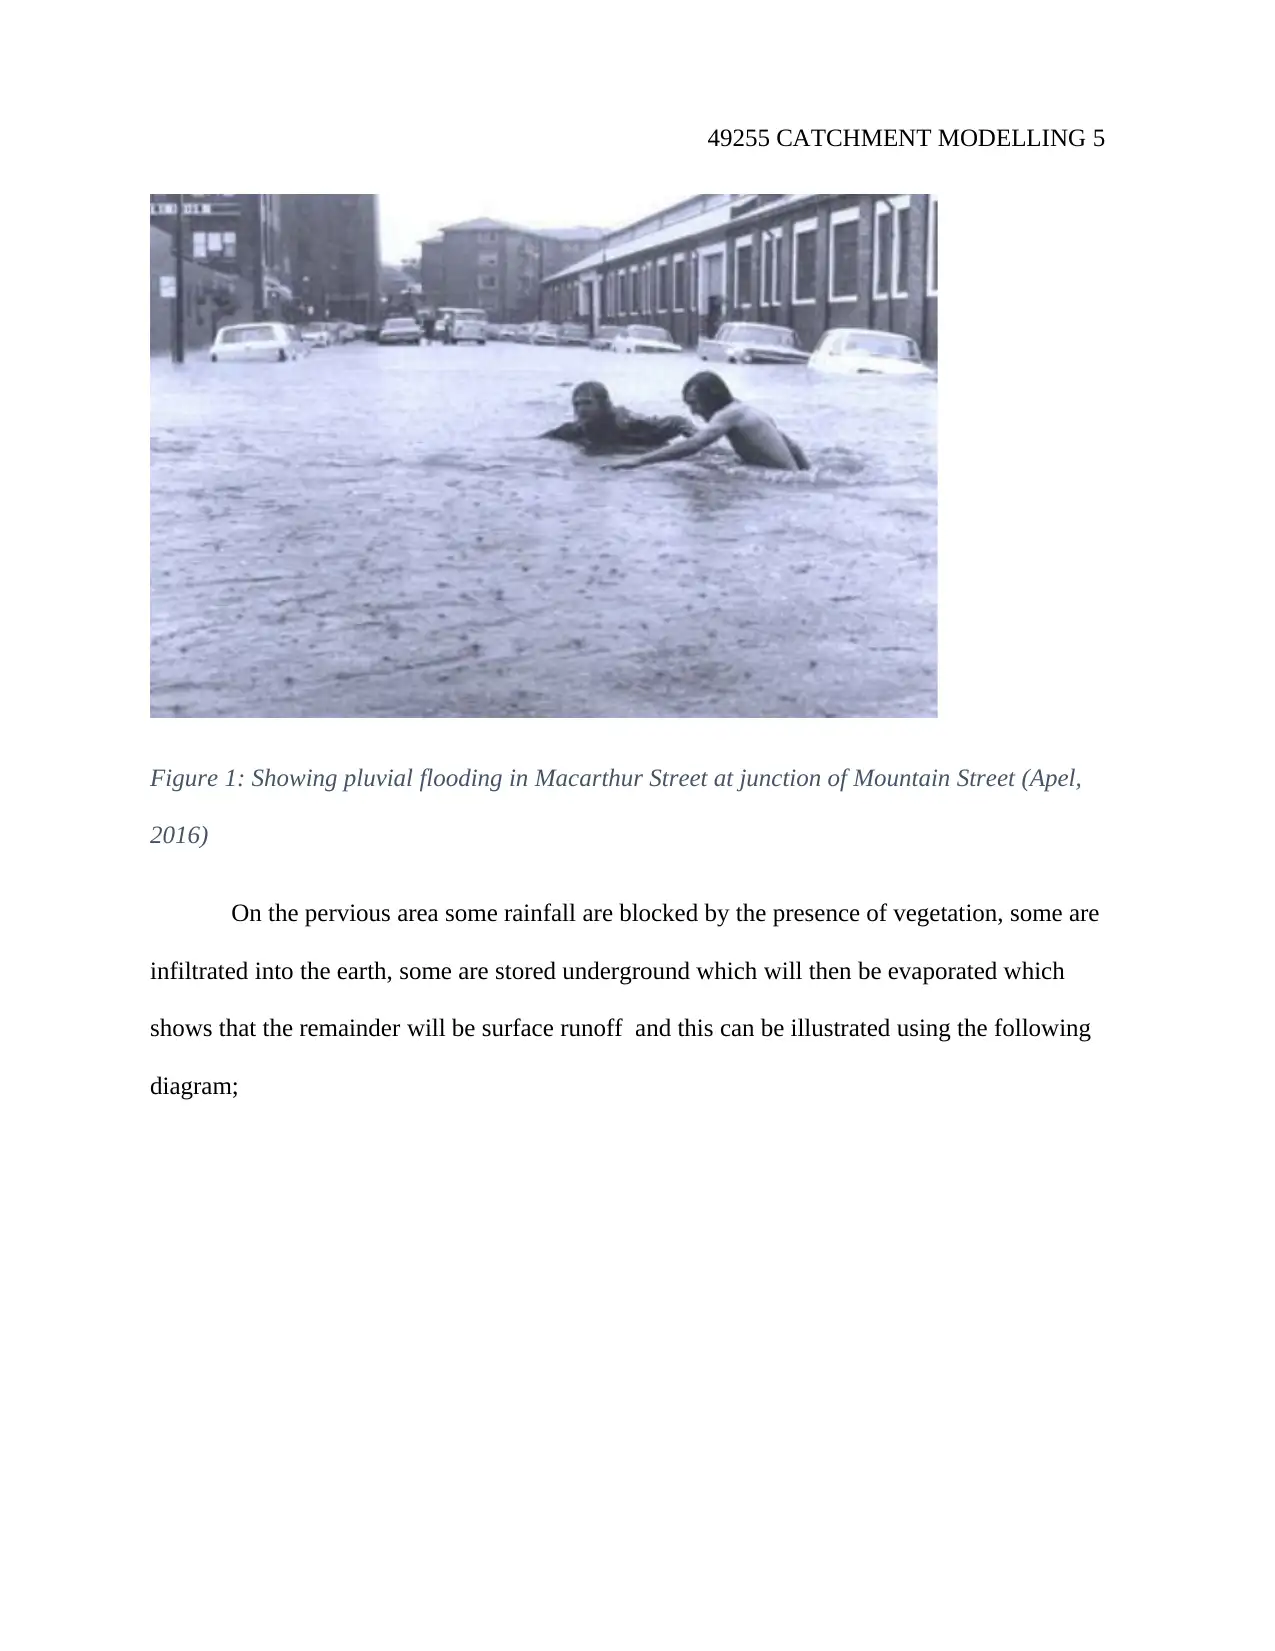
flooding (Apel, 2016). As aforementioned pluvial flooding due to prolonged rainfall which can
fall in areas like gardens, impervious regions like footpaths and streets which is illustrated in the
diagram below which was taken from one of the streets in Blackwattle Bay;
Secure Best Marks with AI Grader
Need help grading? Try our AI Grader for instant feedback on your assignments.
49255 CATCHMENT MODELLING 5
Figure 1: Showing pluvial flooding in Macarthur Street at junction of Mountain Street (Apel,
2016)
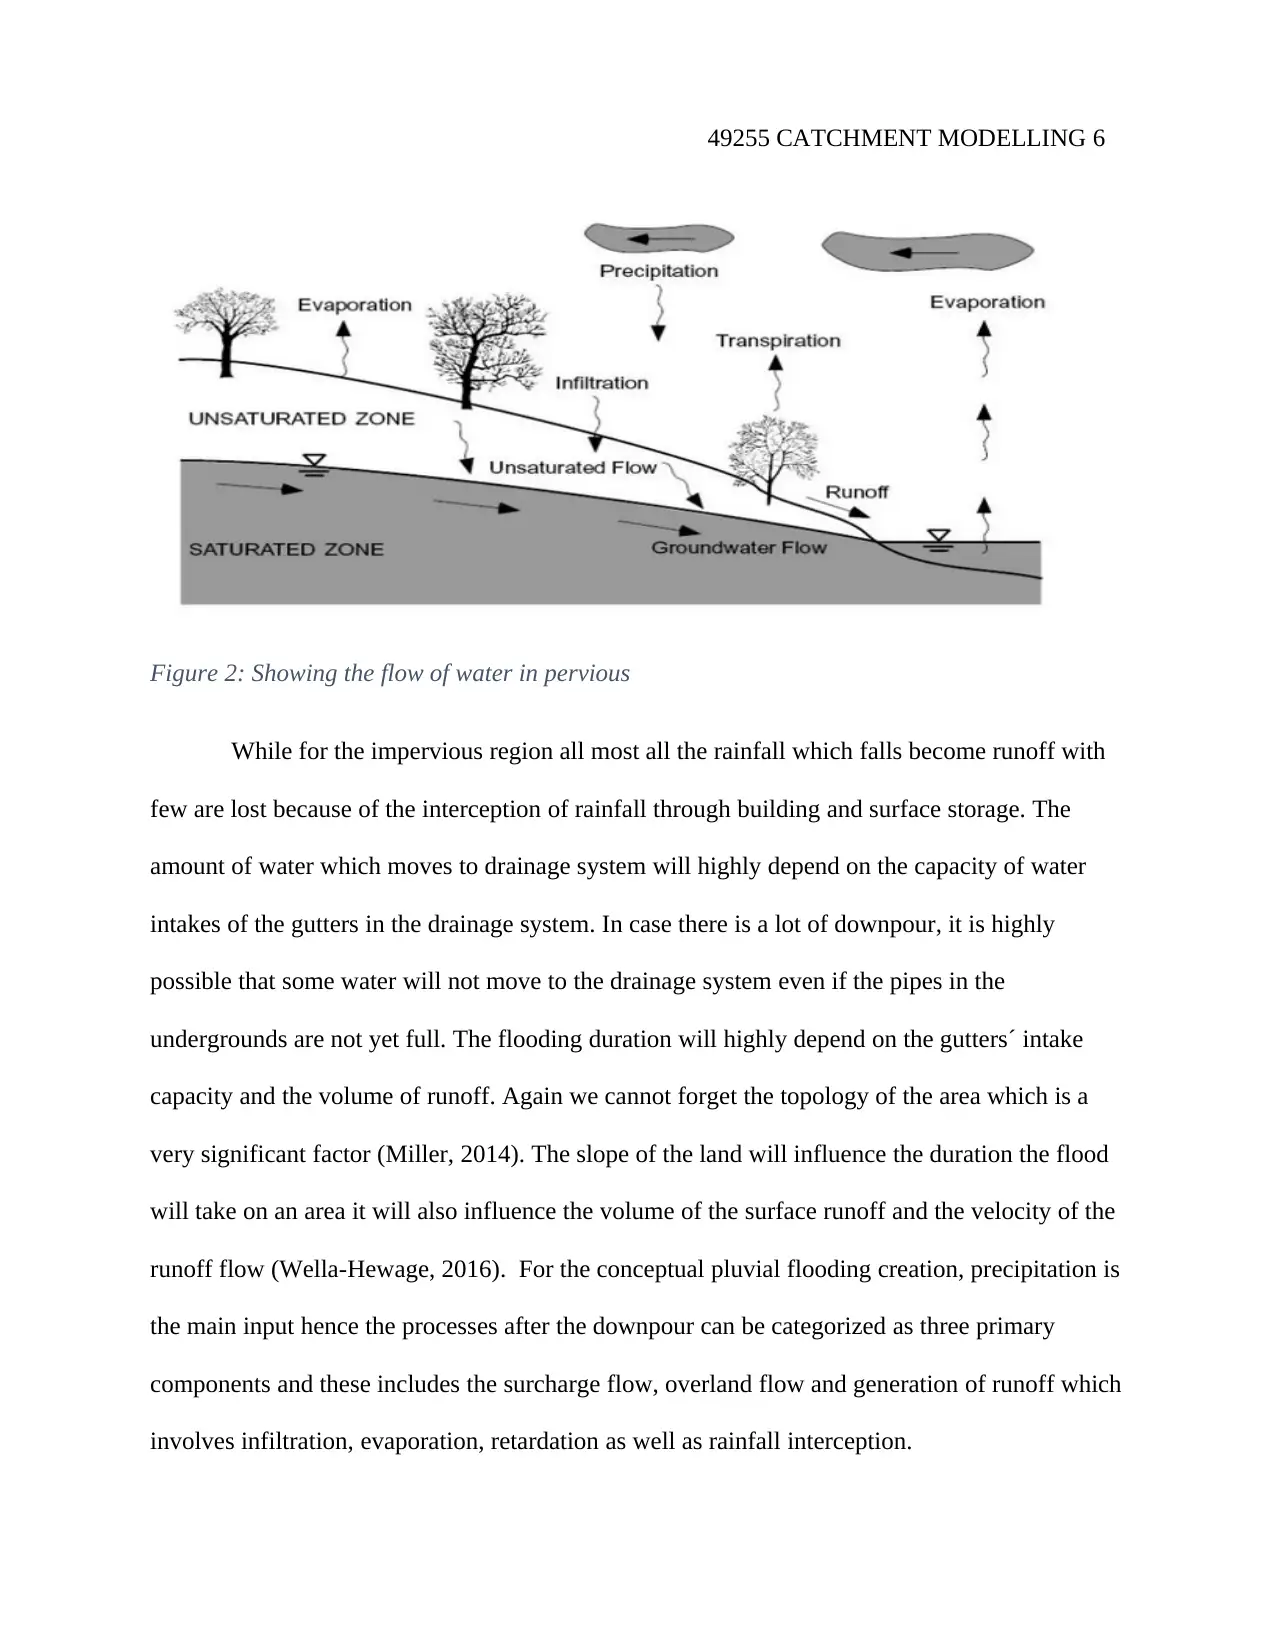
On the pervious area some rainfall are blocked by the presence of vegetation, some are
infiltrated into the earth, some are stored underground which will then be evaporated which
shows that the remainder will be surface runoff and this can be illustrated using the following
diagram;
49255 CATCHMENT MODELLING 6
Figure 2: Showing the flow of water in pervious
While for the impervious region all most all the rainfall which falls become runoff with
few are lost because of the interception of rainfall through building and surface storage. The
amount of water which moves to drainage system will highly depend on the capacity of water
intakes of the gutters in the drainage system. In case there is a lot of downpour, it is highly
possible that some water will not move to the drainage system even if the pipes in the
undergrounds are not yet full. The flooding duration will highly depend on the gutters´ intake
capacity and the volume of runoff. Again we cannot forget the topology of the area which is a
very significant factor (Miller, 2014). The slope of the land will influence the duration the flood
will take on an area it will also influence the volume of the surface runoff and the velocity of the
runoff flow (Wella-Hewage, 2016). For the conceptual pluvial flooding creation, precipitation is
the main input hence the processes after the downpour can be categorized as three primary
components and these includes the surcharge flow, overland flow and generation of runoff which
involves infiltration, evaporation, retardation as well as rainfall interception.
49255 CATCHMENT MODELLING 7
Rainfall estimation (Generation)
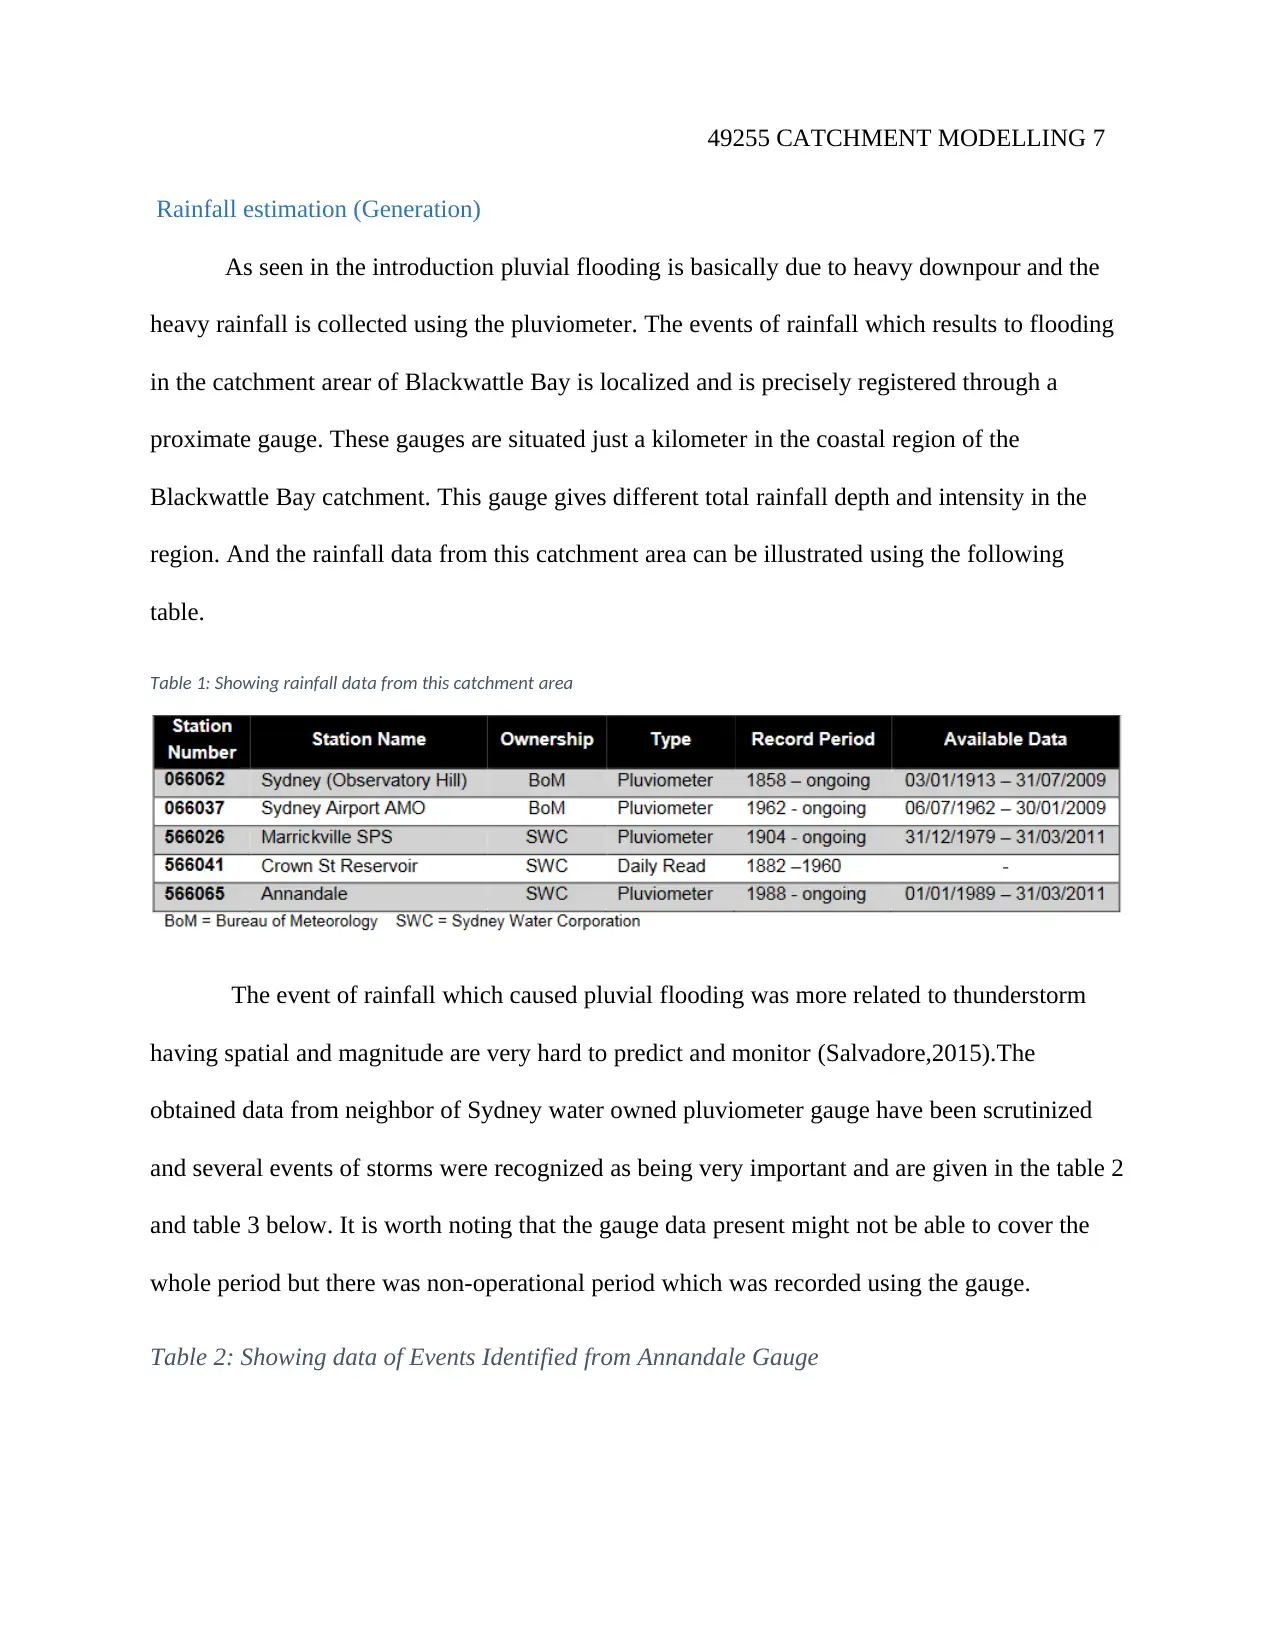
As seen in the introduction pluvial flooding is basically due to heavy downpour and the
heavy rainfall is collected using the pluviometer. The events of rainfall which results to flooding
in the catchment arear of Blackwattle Bay is localized and is precisely registered through a
proximate gauge. These gauges are situated just a kilometer in the coastal region of the
Blackwattle Bay catchment. This gauge gives different total rainfall depth and intensity in the
region. And the rainfall data from this catchment area can be illustrated using the following
table.
Table 1: Showing rainfall data from this catchment area
The event of rainfall which caused pluvial flooding was more related to thunderstorm
having spatial and magnitude are very hard to predict and monitor (Salvadore,2015).The
obtained data from neighbor of Sydney water owned pluviometer gauge have been scrutinized
and several events of storms were recognized as being very important and are given in the table 2
and table 3 below. It is worth noting that the gauge data present might not be able to cover the
whole period but there was non-operational period which was recorded using the gauge.
Table 2: Showing data of Events Identified from Annandale Gauge
Paraphrase This Document
Need a fresh take? Get an instant paraphrase of this document with our AI Paraphraser
49255 CATCHMENT MODELLING 8
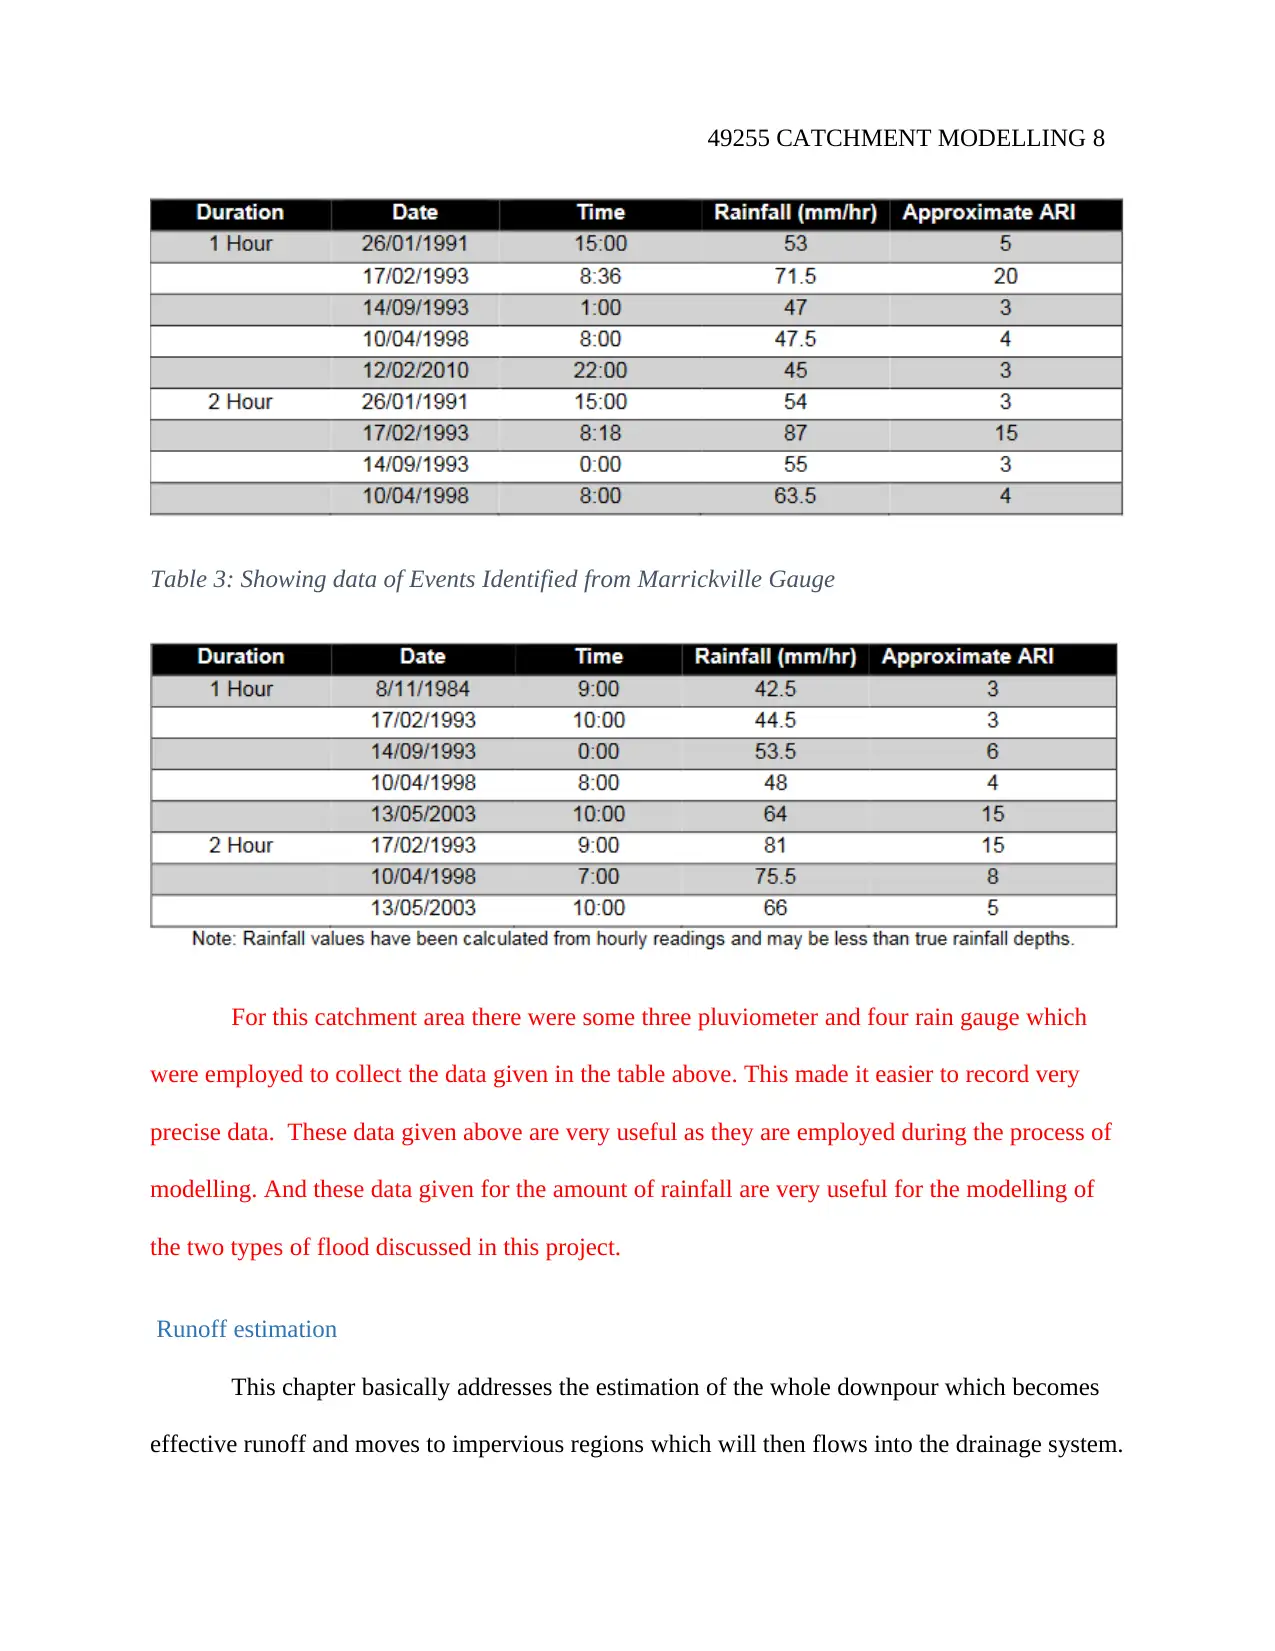
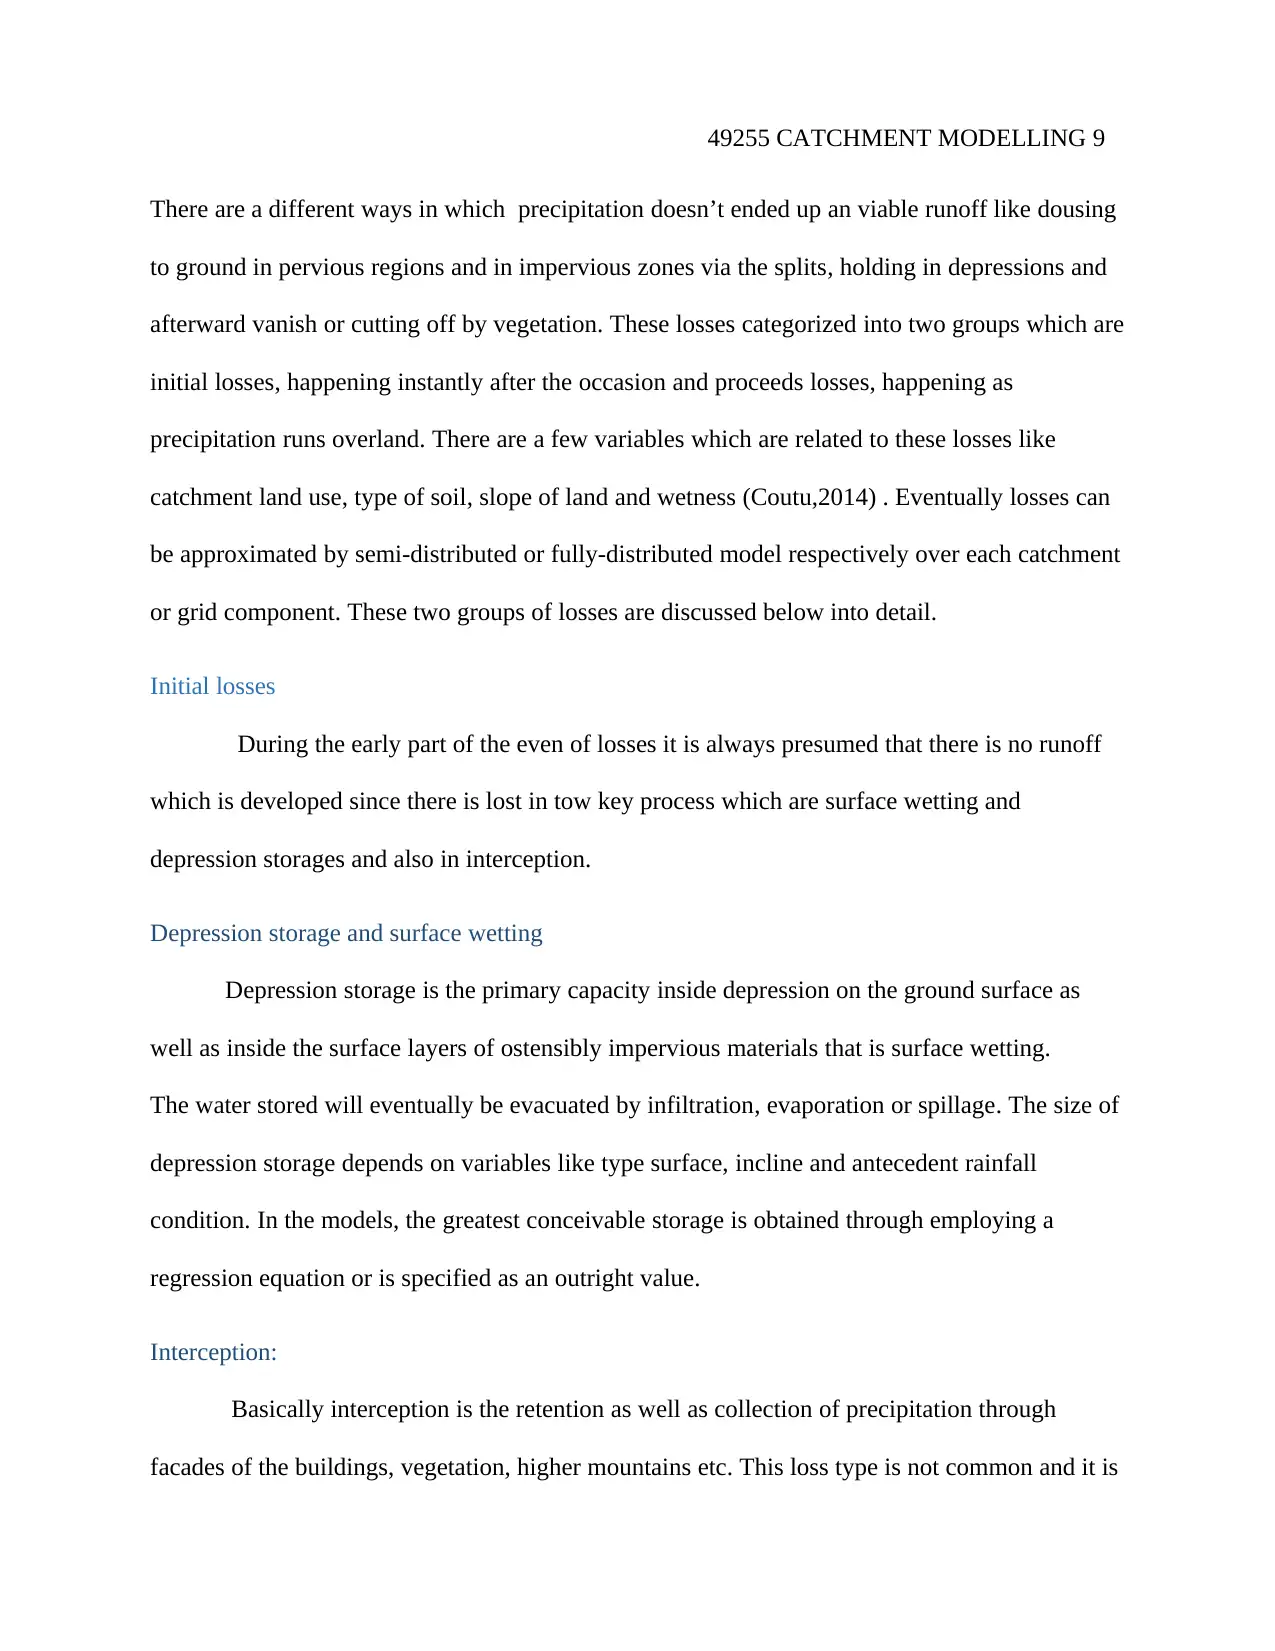
Table 3: Showing data of Events Identified from Marrickville Gauge
For this catchment area there were some three pluviometer and four rain gauge which
were employed to collect the data given in the table above. This made it easier to record very
precise data. These data given above are very useful as they are employed during the process of
modelling. And these data given for the amount of rainfall are very useful for the modelling of
the two types of flood discussed in this project.
Runoff estimation
This chapter basically addresses the estimation of the whole downpour which becomes
effective runoff and moves to impervious regions which will then flows into the drainage system.
49255 CATCHMENT MODELLING 9
There are a different ways in which precipitation doesn’t ended up an viable runoff like dousing
to ground in pervious regions and in impervious zones via the splits, holding in depressions and
afterward vanish or cutting off by vegetation. These losses categorized into two groups which are
initial losses, happening instantly after the occasion and proceeds losses, happening as
precipitation runs overland. There are a few variables which are related to these losses like
catchment land use, type of soil, slope of land and wetness (Coutu,2014) . Eventually losses can
be approximated by semi-distributed or fully-distributed model respectively over each catchment
or grid component. These two groups of losses are discussed below into detail.
Initial losses
During the early part of the even of losses it is always presumed that there is no runoff
which is developed since there is lost in tow key process which are surface wetting and
depression storages and also in interception.
Depression storage and surface wetting
Depression storage is the primary capacity inside depression on the ground surface as
well as inside the surface layers of ostensibly impervious materials that is surface wetting.
The water stored will eventually be evacuated by infiltration, evaporation or spillage. The size of
depression storage depends on variables like type surface, incline and antecedent rainfall
condition. In the models, the greatest conceivable storage is obtained through employing a
regression equation or is specified as an outright value.
Interception:
Basically interception is the retention as well as collection of precipitation through
facades of the buildings, vegetation, higher mountains etc. This loss type is not common and it is
49255 CATCHMENT MODELLING 10
only about 19%-21% for the total precipitation in a densely vegetation region (Jankowfsky,
2014). Nevertheless, it is basically less for the impervious regions and it is always combined
with depression stage for the city drainage models or for some rare occasion it is neglected. For
the Blackwattle Bay catchment the rate of this loss will be less than 20% of total precipitation
because more than half of the region (which is impervious) is anticipated to develop soon.
Continuing losses:
Just as the name suggests, this is a loss which occurs continuously and it includes the
infiltration as well as evaporation. This loss occurs slows but continuously and for one to
approximate the net runoff or precipitation, the correspondent depth of this type of loss is always
subtracted from the hyetograph precipitation when the deduction of the initial losses have been
done. The main two types of this loss is explained below in details;
Evaporation:
This is the process by which water is lost to the atmosphere in form of water vapour, the
rate of evaporation is always expressed as mm/ day and it is always set at a constant value but in
rare occasions it vary with time. It is worth noting that when the evaporation effects in a short
span of time and heavy downpour events such as pluvial flooding is assumed.
Infiltration:
This is the process where rainwater is passed into the soil after rainfall. Blackwattle Bay
catchment infiltration surface will depend on some key factors like hydraulic conductivity, soil
porosity, topography of the land, the volume of water on the soil and the vegetation cover on our
catchment area. The infiltration rate will also depend on ground wetness before the rainfall starts
and this rate always reduce throughout the storm (Marsalek, 2013). When this process begin, the
Secure Best Marks with AI Grader
Need help grading? Try our AI Grader for instant feedback on your assignments.
49255 CATCHMENT MODELLING 11
infiltration starts at the upper layer of the soil the part which is not saturated with water then it
flows deeper into saturated region where there is ground water. Basically for this model we can
consider the infiltration in the upper soil layer because this is the part where effective infiltration
will occur because it is unsaturated, subsequent surface as well as the saturated zones are rarely
modelled hence will be assumed.
MODEL BUILD
For the modelling a program known as the hydrodynamic modelling program TUFLOW
has been employed for both hydraulic and hydrologic processes in Blackwattle Bay catchment
area. This program is able to incorporate 1D element to 2 D element which is one of the major
beneficial factor of TUFLOW. This program allows several modelling which are discussed
below. And from the below modelling linkage of the generic processes that are to be modelled will
vividly come out. The use of TUFLOW model which is a linkage program is employed in the following
generic modelling process.
Sewer Flow Modeling:
This modelling can be conducted in some parts of the word but not in Australian
catchment area which Blackwattle Bay catchment is part. This is because there is different sewer
system which is isolated from the drainage system but it is worth explaining it. The runoff will
flows into the sewer system via gullies manholes and inlets at a rate which is predetermined by
capacity of conveyance of these element connection as well as the system of the sewer. These
systems are isolated in a way that the wastewater flows without storm water (dry weather flows)
or DWF. DWF can be obtained via the flow record analysis during dry weather periods and it
constitute an extra input to the model of sewer joint system.
49255 CATCHMENT MODELLING 12
Overland flow modelling:
TUFLOW can as well be employed to model overland flow, this flow modelling is
basically the flow of runoff water in the city surface after downpour before it either get infiltrated
or gets into the sewer system. The initial stage of the flow is refers to as conveyance or runoff
concentration, this is where the runoff produced till it enters the sewer system. And the second
stage is the sewer flooding and it is where flood water flows from surcharged sewer (Huxley,
2016). These two stages are highly related and always occur simultaneously however, their
modelling are done as they are treated differently.
Hydraulic Modelling (Transport)
For this modelling we have three different modelling which are explained below;
Bridges and Culverts
The information on the pier width, obvert and invert levels, footpath and heights of
railing need to be estimated for both downstream and upstream ends for every structure and input
into the model. As seen above this program can handle both 1D and 2D hence it can be
employed in modelling of culverts and bridges which are modelled in 1 D. They are modelled as
a 1D reach object having a parallel 1D weir object showing the overflow path over the deck
when there is high flow. The foot bridges and rails for hand are presumed to be wholly blocked
in case the spacing between the bars is less than 150 mm (Syme, 2012). After the modelling 1 D,
these models can be converted to 2 D using the TUFLOW program for easier visualization.
Hydraulic Roughness
Hydraulic roughness is key parameter which is very vital to be modelled for Blackwattle
Bay catchment area. From the types of models which TUFLOW can support that is 1D and 2D,

49255 CATCHMENT MODELLING 13
the way of modelling is not the same. 1 D model roughness need to be approximated based on
observation of conditions of in-channel as well as the knowledge of the channel type. The 2D
model is used basically for the roughness values which is based on the use of the land. But the
modelling is commenced with 1 D which will then be converted to 2 D model (Banks, 2014).
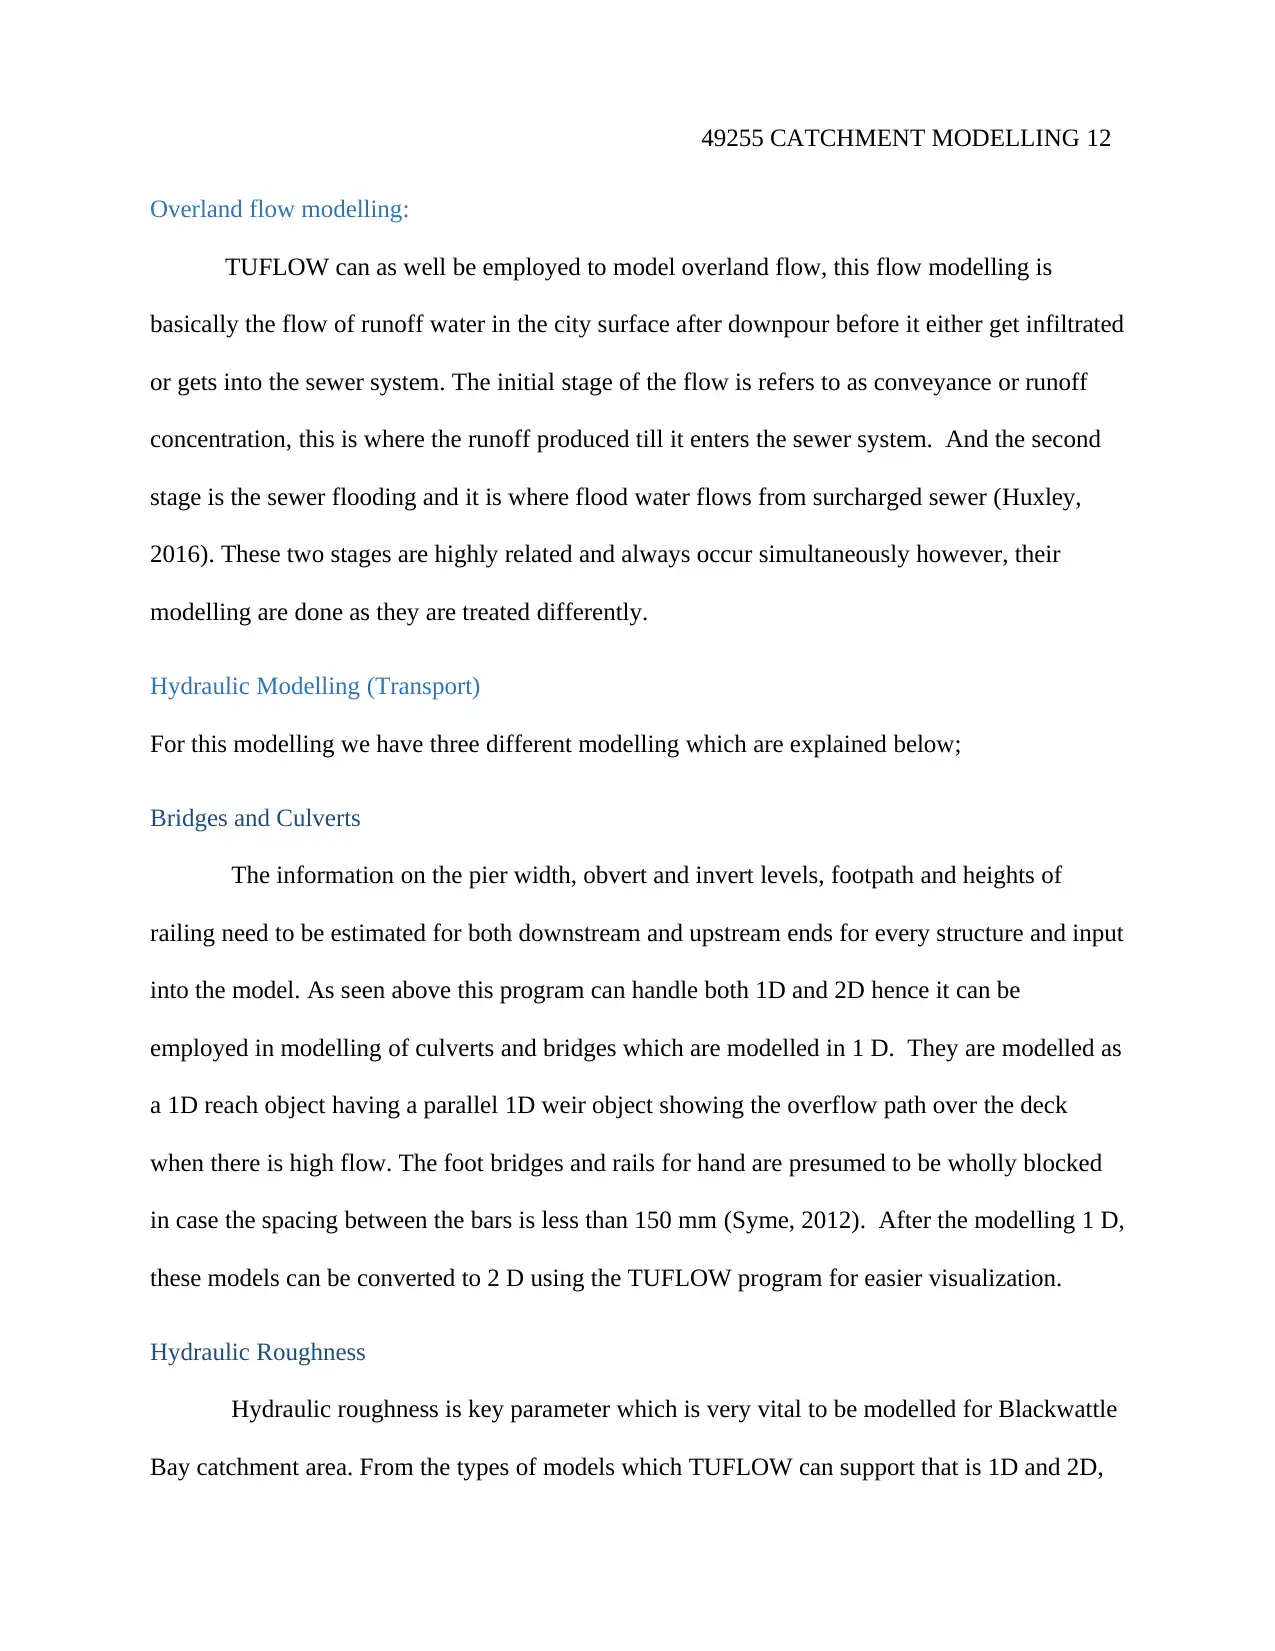
The material of the catchment plan can be obtained from the Local Environmental Plan and
cadastral in an aerial pictures which are illustrated in the figure 3 below. The ideal
representative of the mean roughness on every block for the obstruction to smooth flow like
other building structures as well as fences will not be explicitly represented.
Modelling of Flow Obstructions in the Floodplain
During the modelling of flow obstruction in floodplain the property boundary fences are
treated to be color bond fencing types that would fall in hydrostatic load because the floodwater
build up against the fence therefore not showing it as explicitly in the model. Buildings like
houses are illustrated as solid obstruction in the model. Albeit the ballast formation of the
railway are permeable hence their ability to transmit the flood flows via the formation is treated
as low therefore they can be viewed as obstruction to overland floodwater which is moving to the
rail corridor in west from east. And all these are done with the help of the TUFLOW program.
Paraphrase This Document
Need a fresh take? Get an instant paraphrase of this document with our AI Paraphraser
49255 CATCHMENT MODELLING 14
Figure 3:Showing the Local Environmental Plan and cadastral (Banks, 2014)
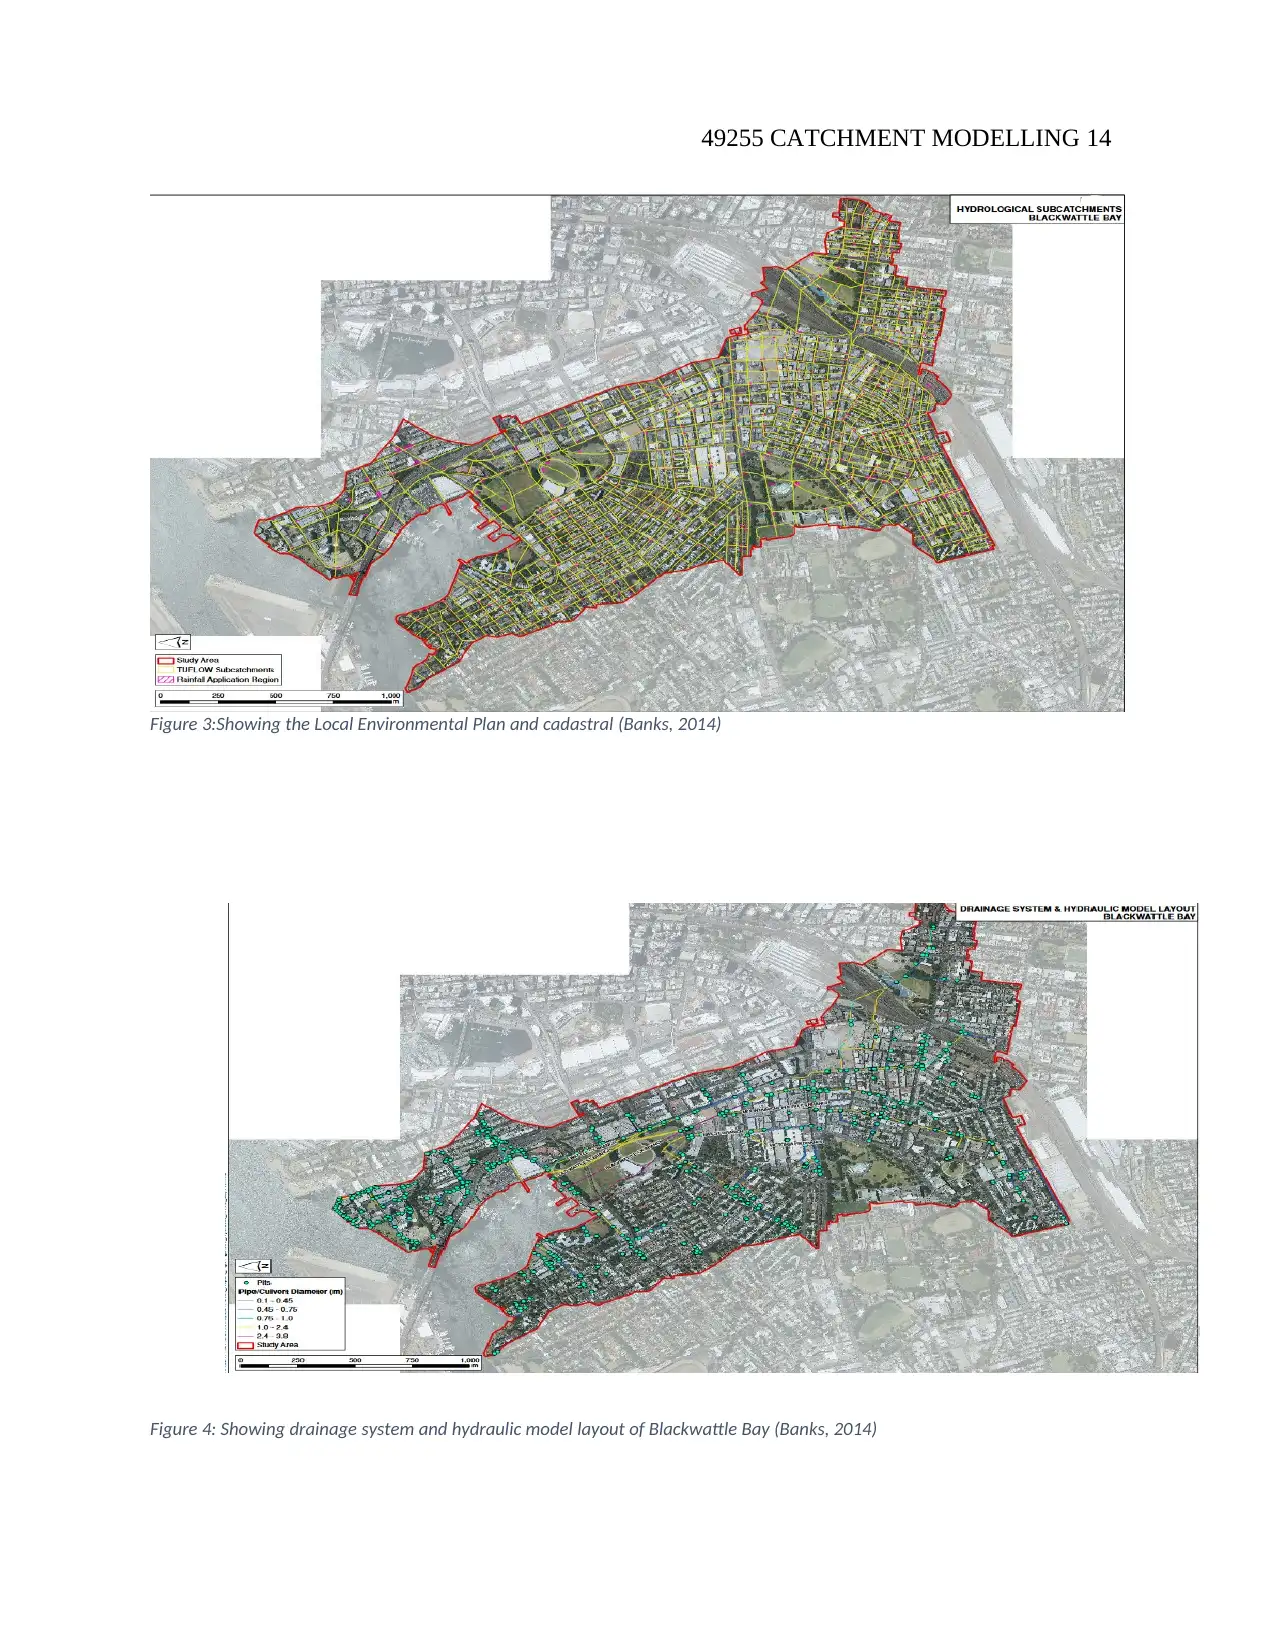
Figure 4: Showing drainage system and hydraulic model layout of Blackwattle Bay (Banks, 2014)
Figure 3:Showing the Local Environmental Plan and cadastral (Banks, 2014)
Figure 4: Showing drainage system and hydraulic model layout of Blackwattle Bay (Banks, 2014)

49255 CATCHMENT MODELLING 15
Bibliography
Apel, H., Trepat, O.M., Hung, N.N., Merz, B. and Dung, N.V., 2016. Combined fluvial and
pluvial urban flood hazard analysis: concept development and application to Can Tho city,
Mekong Delta, Vietnam. Natural Hazards & Earth System Sciences, 16(4).
Banks, J.C., Camp, J.V. and Abkowitz, M.D., 2014. Adaptation planning for floods: a review of
available tools. Natural hazards, 70(2), pp.1327-1337.
Blanc, J., Hall, J.W., Roche, N., Dawson, R.J., Cesses, Y., Burton, A. and Kilsby, C.G., 2012.
Enhanced efficiency of pluvial flood risk estimation in urban areas using spatial–temporal
rainfall simulations. Journal of Flood Risk Management, 5(2), pp.143-152.
Coutu, S., Del Giudice, D., Rossi, L. and Barry, D.A., 2012. Parsimonious hydrological
modeling of urban sewer and river catchments. Journal of Hydrology, 464, pp.477-484.
Feyen, L., Dankers, R., Bódis, K., Salamon, P. and Barredo, J.I., 2012. Fluvial flood risk in
Europe in present and future climates. Climatic change, 112(1), pp.47-62.
Huxley, C. and Syme, B., 2016. TUFLOW GPU-Best practice advice for hydrologic and
hydraulic model simulations. In 37th Hydrology & Water Resources Symposium 2016: Water,
Infrastructure and the Environment (p. 195). Engineers Australia.
Jankowfsky, S., Branger, F., Braud, I., Rodriguez, F., Debionne, S. and Viallet, P., 2014.
Assessing anthropogenic influence on the hydrology of small peri-urban catchments:
Development of the object-oriented PUMMA model by integrating urban and rural hydrological
models. Journal of hydrology, 517, pp.1056-1071.

49255 CATCHMENT MODELLING 16
Kleinman, P.J., Smith, D.R., Bolster, C.H. and Easton, Z.M., 2015. Phosphorus fate,
management, and modeling in artificially drained systems. Journal of environmental quality,
44(2), pp.460-466.
Marsalek, J., Maksimovic, C., Zeman, E. and Price, R. eds., 2013. Hydroinformatics tools for
planning, design, operation and rehabilitation of sewer systems (Vol. 44). Springer Science &
Business Media.
Miller, J.D., Kim, H., Kjeldsen, T.R., Packman, J., Grebby, S. and Dearden, R., 2014. Assessing
the impact of urbanization on storm runoff in a peri-urban catchment using historical change in
impervious cover. Journal of Hydrology, 515, pp.59-70.
Salvadore, E., Bronders, J. and Batelaan, O., 2015. Hydrological modelling of urbanized
catchments: A review and future directions. Journal of hydrology, 529, pp.62-81.
Syme, B., Collecutt, G. and Ryan, P., 2012. Rapid and Accurate Flood Modeling Fully 2D GPU
Solver. In Floodplain Management Association Annual Conference.
Wella-Hewage, C.S., Alankarage Hewa, G. and Pezzaniti, D., 2016. Can water sensitive urban
design systems help to preserve natural channel-forming flow regimes in an urbanised
catchment?. Water Science and Technology, 73(1), pp.78-87.
1 out of 16
Your All-in-One AI-Powered Toolkit for Academic Success.
+13062052269
info@desklib.com
Available 24*7 on WhatsApp / Email
![[object Object]](/_next/static/media/star-bottom.7253800d.svg)
Unlock your academic potential
© 2024 | Zucol Services PVT LTD | All rights reserved.


