ENGG255 Assignment 1: Statistical Analysis and Data Visualization
VerifiedAdded on 2023/04/17
|7
|696
|114
Homework Assignment
AI Summary
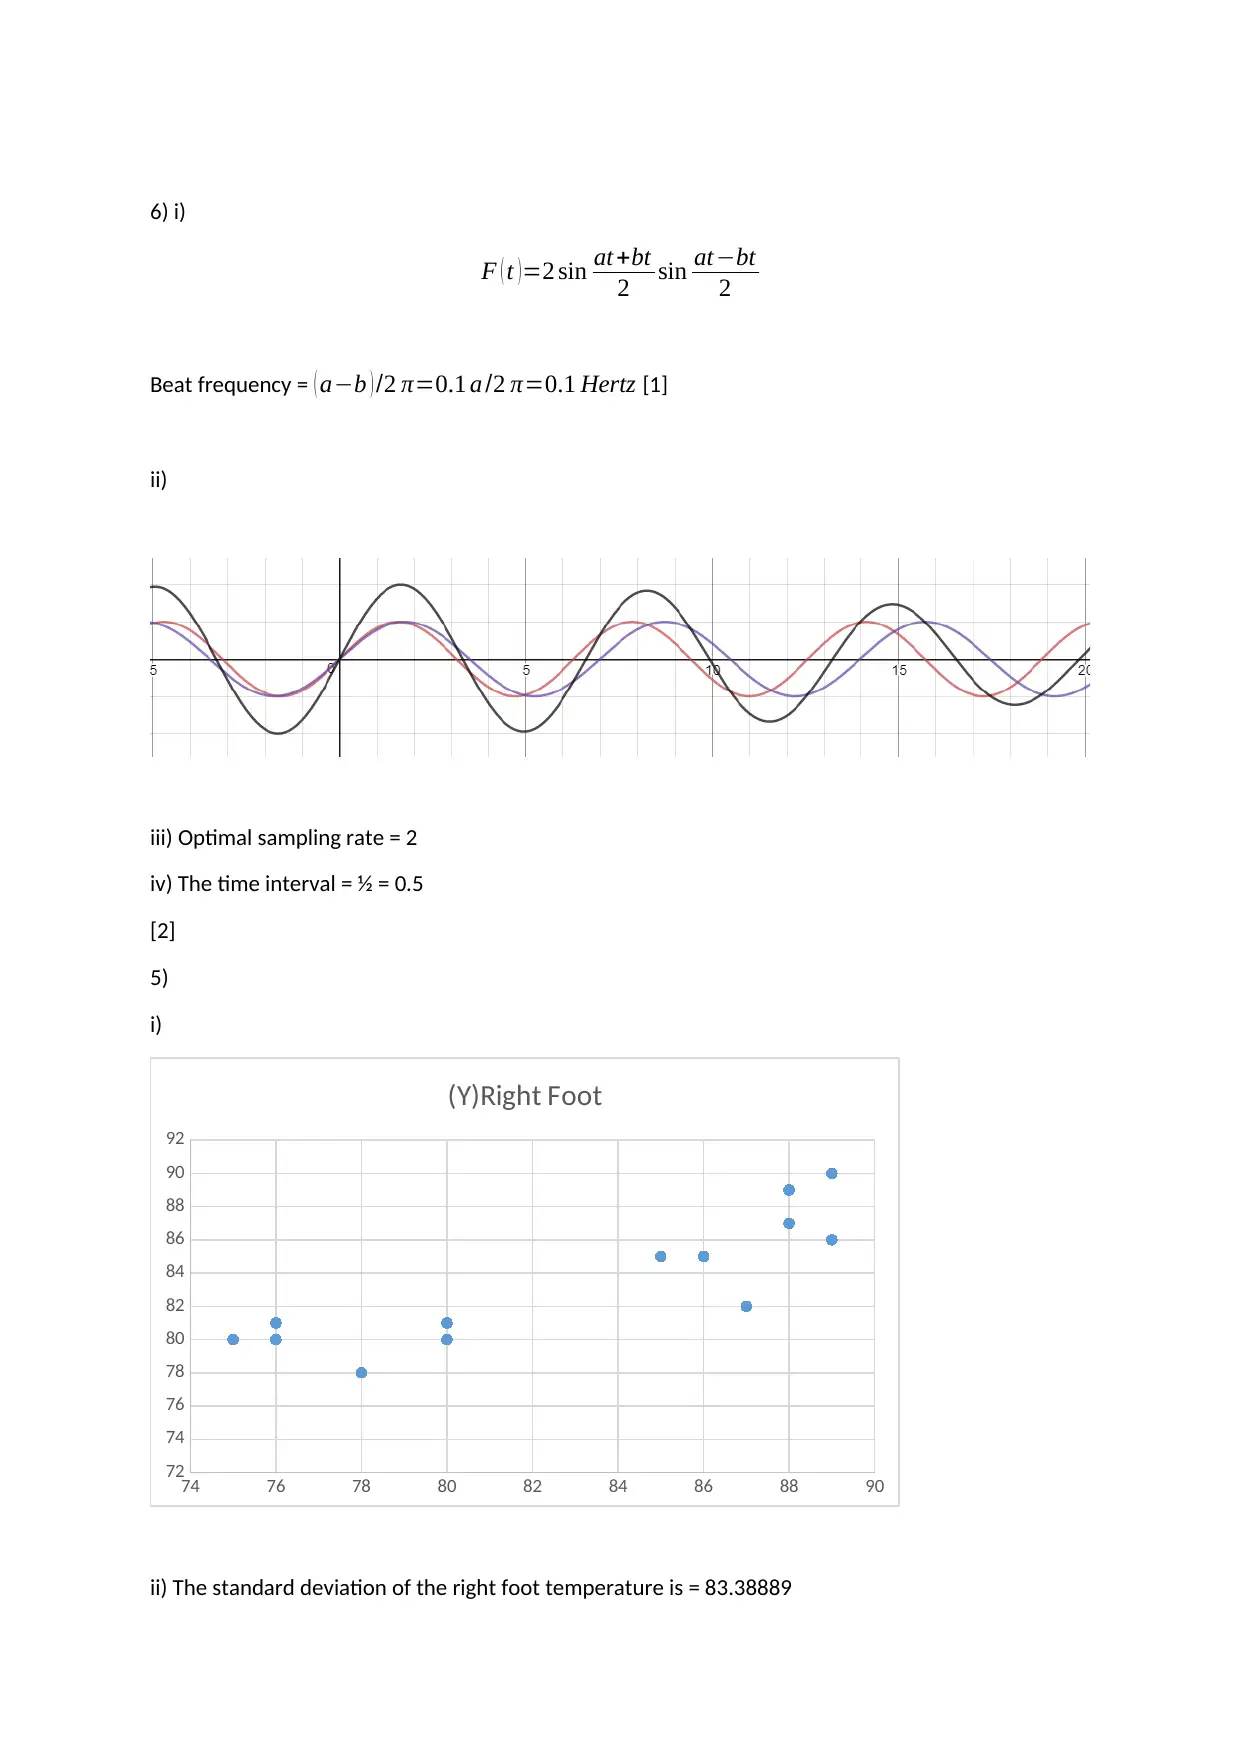
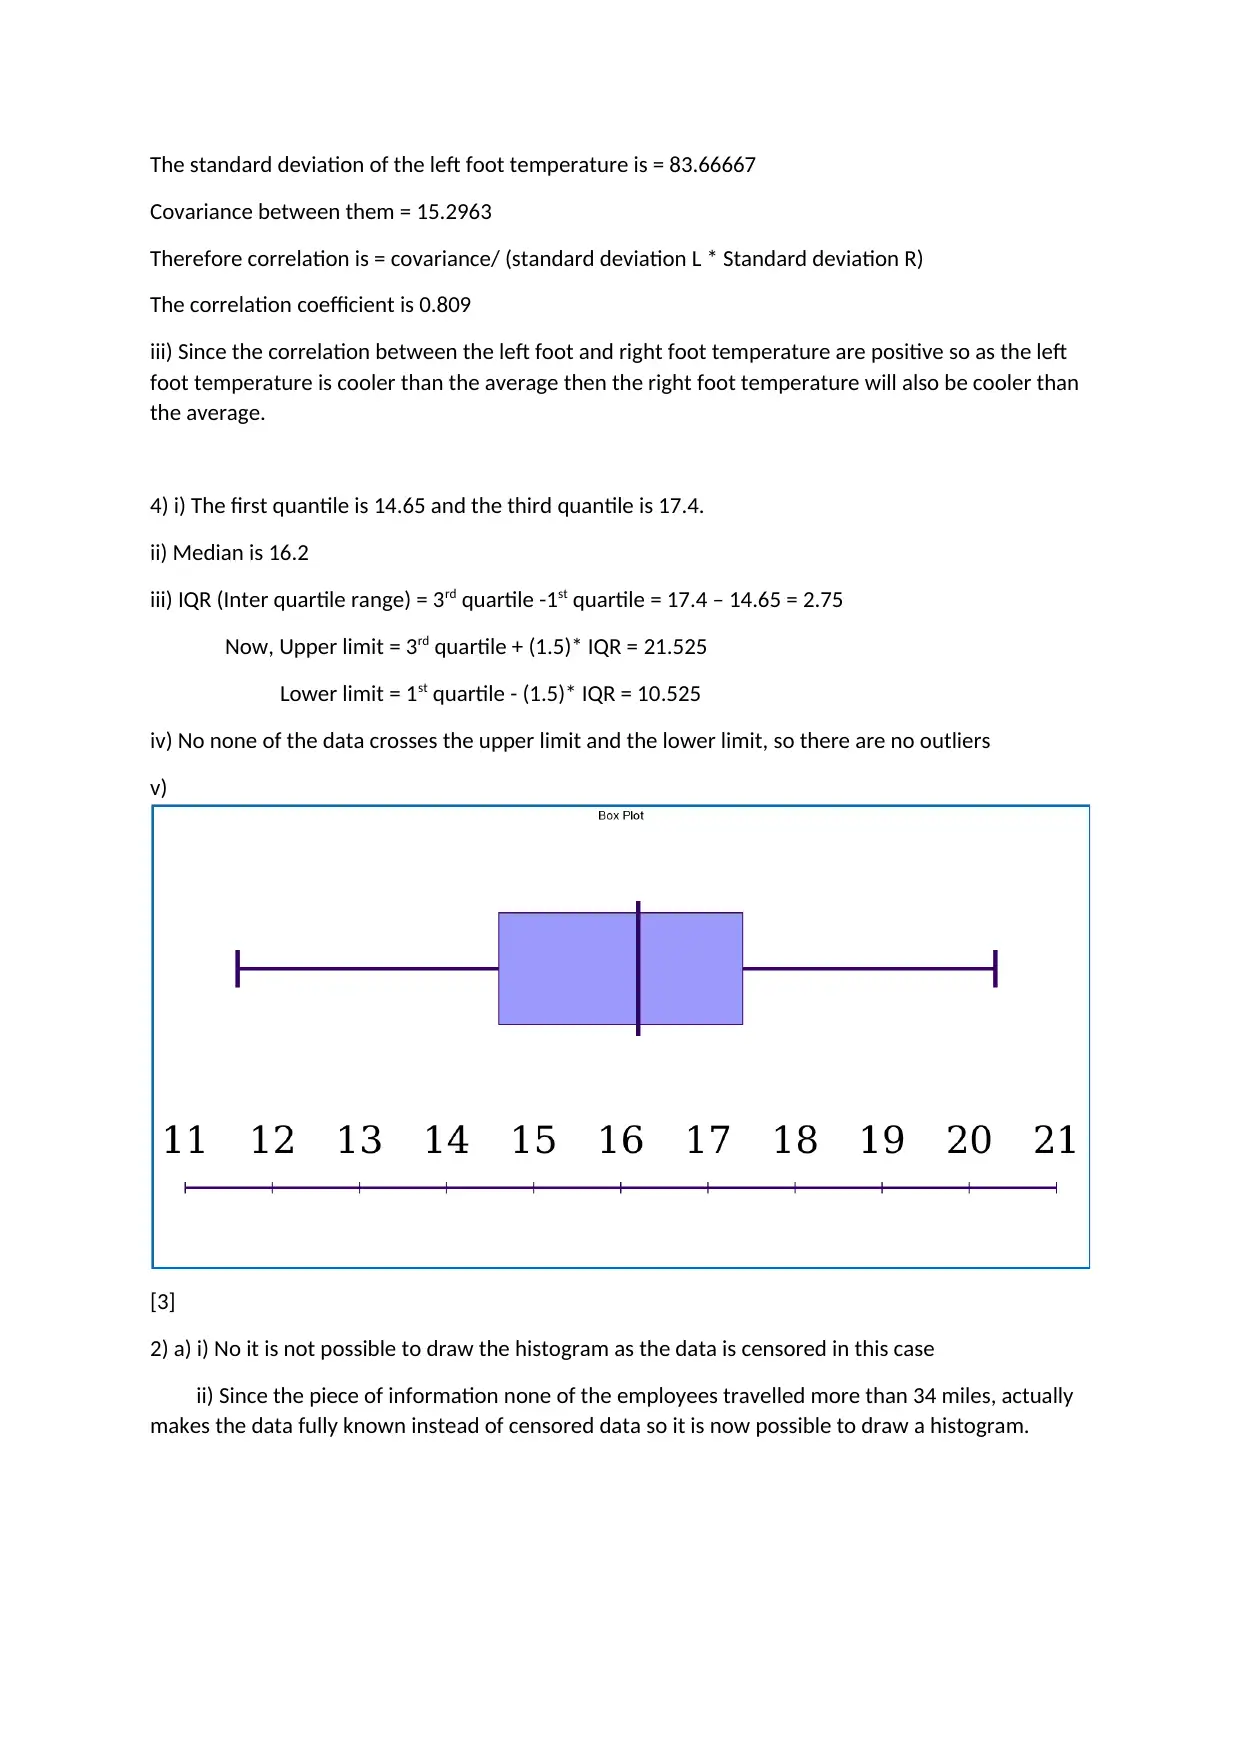
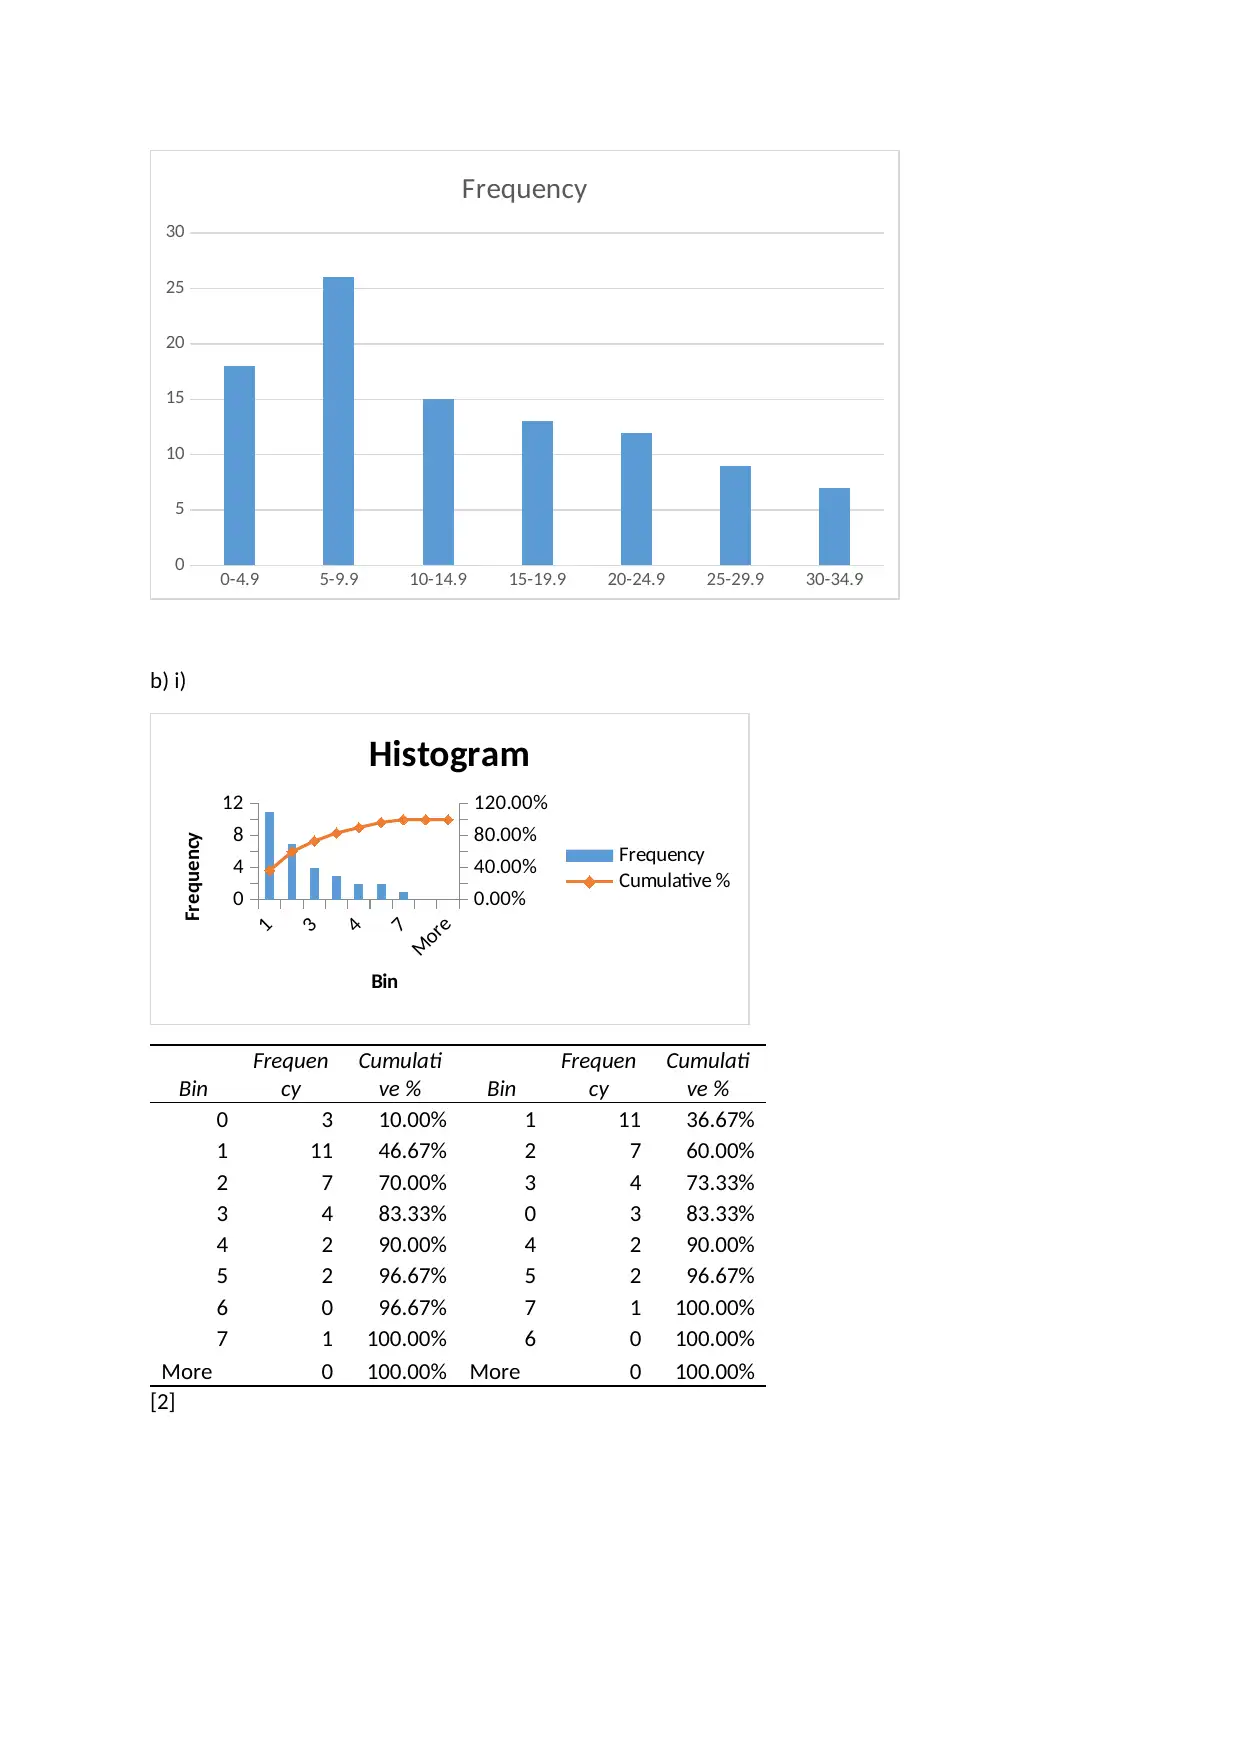
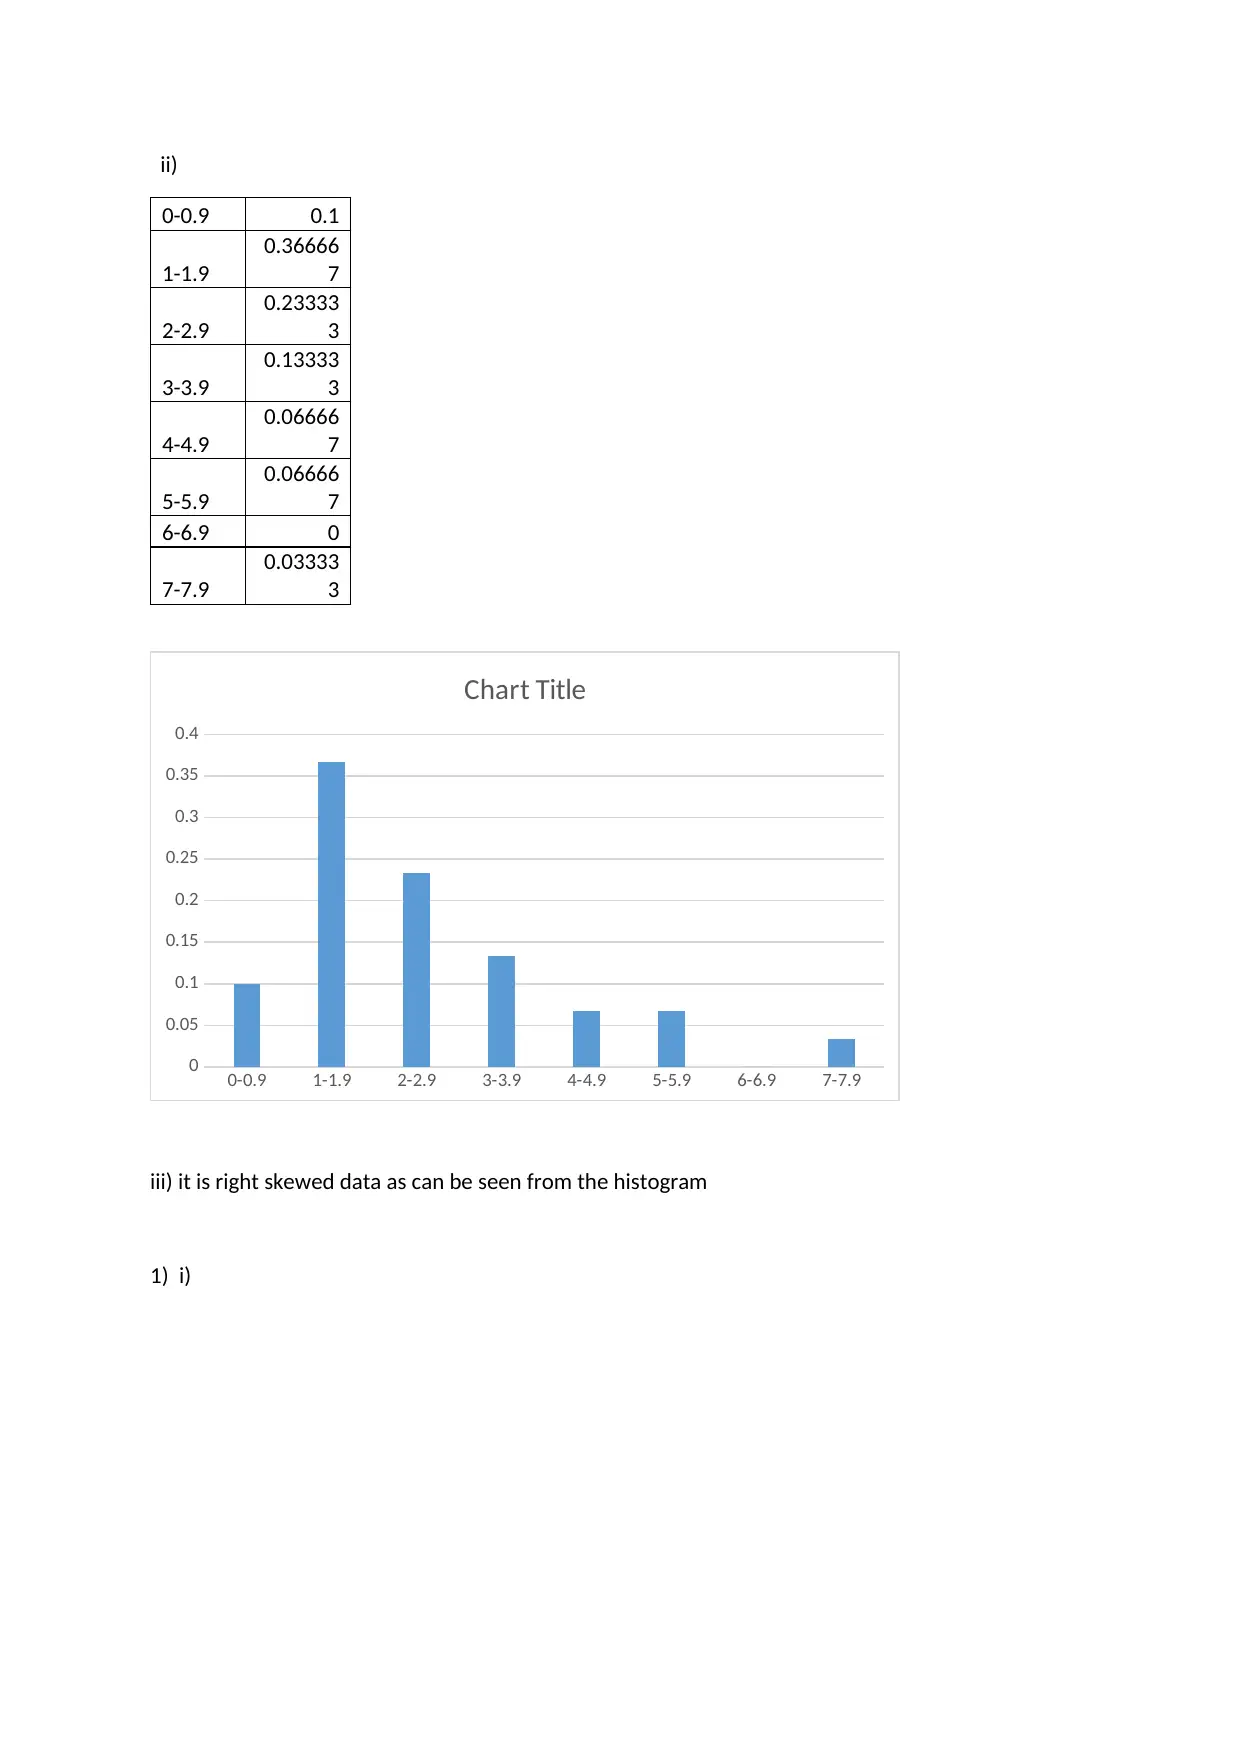
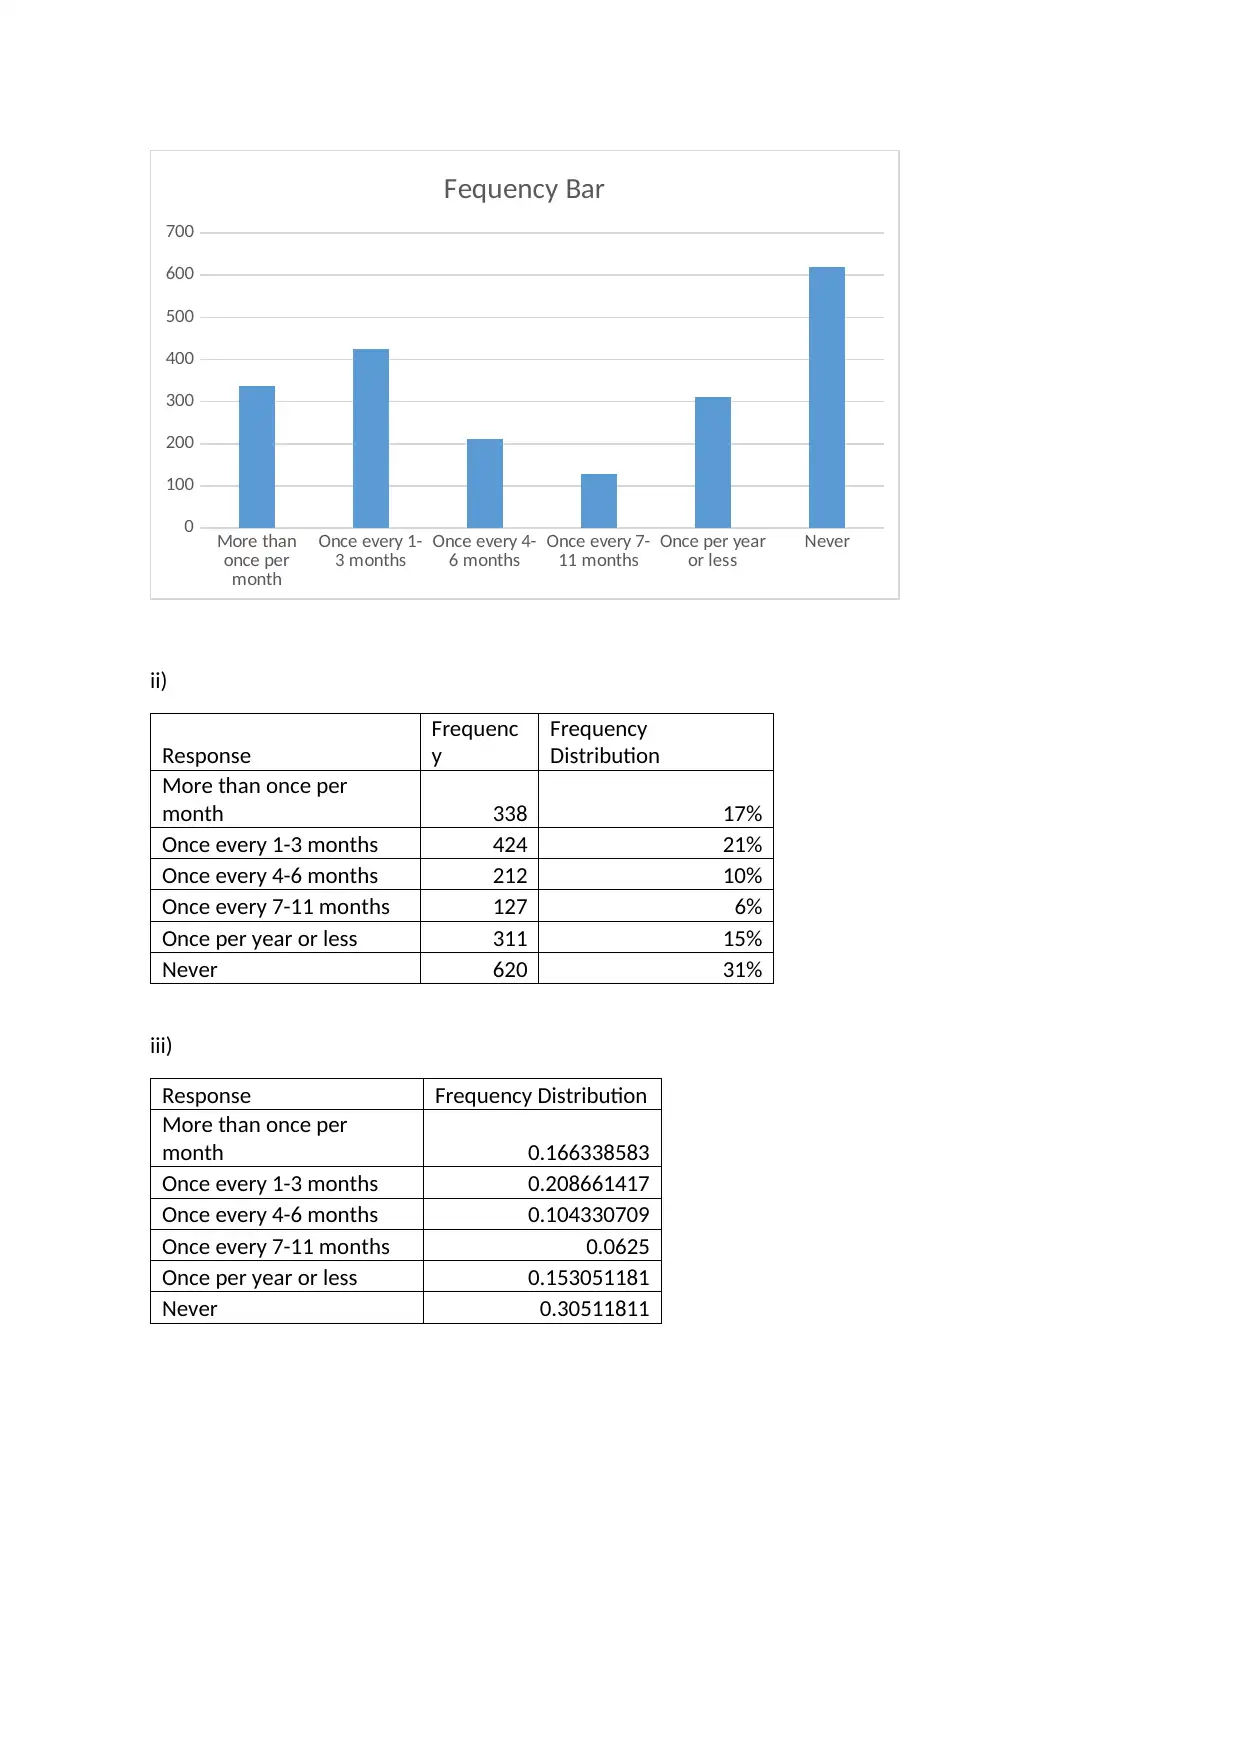
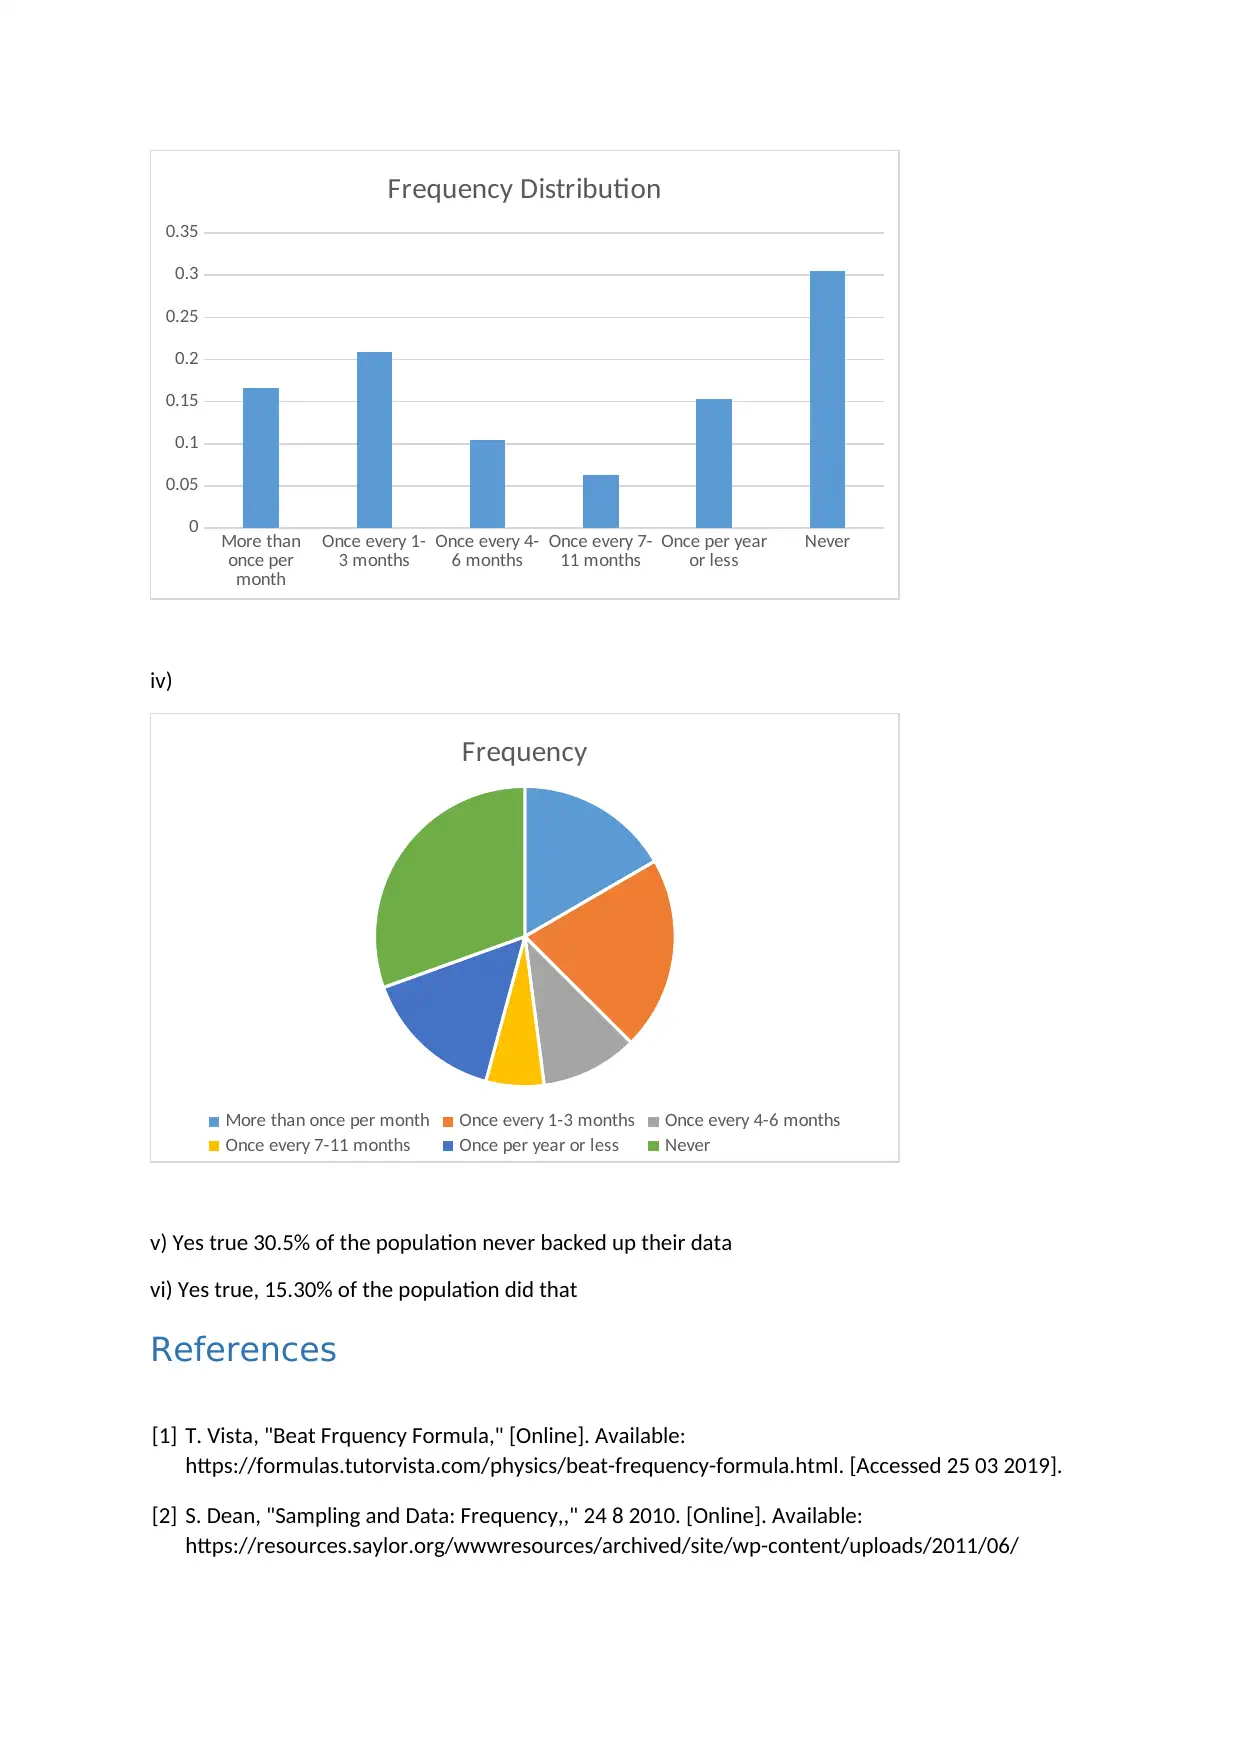
This assignment solution addresses a data visualization problem set, likely for an engineering or statistics course. The solution includes detailed calculations and graphical representations of data. The first question involves constructing frequency distributions, bar graphs, relative frequency distribution...

6) i)
F ( t )=2 sin at +bt
2 sin at−bt
2
Beat frequency = ( a−b ) /2 π=0.1 a /2 π=0.1 Hertz [1]
ii)
iii) Optimal sampling rate = 2
iv) The time interval = ½ = 0.5
[2]
5)
i)
74 76 78 80 82 84 86 88 90
72
74
76
78
80
82
84
86
88
90
92
(Y)Right Foot
ii) The standard deviation of the right foot temperature is = 83.38889
Paraphrase This Document
Need a fresh take? Get an instant paraphrase of this document with our AI Paraphraser

The standard deviation of the left foot temperature is = 83.66667
Covariance between them = 15.2963
Therefore correlation is = covariance/ (standard deviation L * Standard deviation R)
The correlation coefficient is 0.809
iii) Since the correlation between the left foot and right foot temperature are positive so as the left
foot temperature is cooler than the average then the right foot temperature will also be cooler than
the average.
4) i) The first quantile is 14.65 and the third quantile is 17.4.
ii) Median is 16.2
iii) IQR (Inter quartile range) = 3rd quartile -1st quartile = 17.4 – 14.65 = 2.75
Now, Upper limit = 3rd quartile + (1.5)* IQR = 21.525
Lower limit = 1st quartile - (1.5)* IQR = 10.525
iv) No none of the data crosses the upper limit and the lower limit, so there are no outliers
v)
[3]
2) a) i) No it is not possible to draw the histogram as the data is censored in this case
ii) Since the piece of information none of the employees travelled more than 34 miles, actually
makes the data fully known instead of censored data so it is now possible to draw a histogram.

0-4.9 5-9.9 10-14.9 15-19.9 20-24.9 25-29.9 30-34.9
0
5
10
15
20
25
30
Frequency
b) i)
1
3
4
7
More
0
4
8
12
0.00%
40.00%
80.00%
120.00%
Histogram
Frequency
Cumulative %
Bin
Frequency
Bin
Frequen
cy
Cumulati
ve % Bin
Frequen
cy
Cumulati
ve %
0 3 10.00% 1 11 36.67%
1 11 46.67% 2 7 60.00%
2 7 70.00% 3 4 73.33%
3 4 83.33% 0 3 83.33%
4 2 90.00% 4 2 90.00%
5 2 96.67% 5 2 96.67%
6 0 96.67% 7 1 100.00%
7 1 100.00% 6 0 100.00%
More 0 100.00% More 0 100.00%
[2]
0
5
10
15
20
25
30
Frequency
b) i)
1
3
4
7
More
0
4
8
12
0.00%
40.00%
80.00%
120.00%
Histogram
Frequency
Cumulative %
Bin
Frequency
Bin
Frequen
cy
Cumulati
ve % Bin
Frequen
cy
Cumulati
ve %
0 3 10.00% 1 11 36.67%
1 11 46.67% 2 7 60.00%
2 7 70.00% 3 4 73.33%
3 4 83.33% 0 3 83.33%
4 2 90.00% 4 2 90.00%
5 2 96.67% 5 2 96.67%
6 0 96.67% 7 1 100.00%
7 1 100.00% 6 0 100.00%
More 0 100.00% More 0 100.00%
[2]
⊘ This is a preview!⊘
Do you want full access?
Subscribe today to unlock all pages.

Trusted by 1+ million students worldwide

ii)
0-0.9 0.1
1-1.9
0.36666
7
2-2.9
0.23333
3
3-3.9
0.13333
3
4-4.9
0.06666
7
5-5.9
0.06666
7
6-6.9 0
7-7.9
0.03333
3
0-0.9 1-1.9 2-2.9 3-3.9 4-4.9 5-5.9 6-6.9 7-7.9
0
0.05
0.1
0.15
0.2
0.25
0.3
0.35
0.4
Chart Title
iii) it is right skewed data as can be seen from the histogram
1) i)
0-0.9 0.1
1-1.9
0.36666
7
2-2.9
0.23333
3
3-3.9
0.13333
3
4-4.9
0.06666
7
5-5.9
0.06666
7
6-6.9 0
7-7.9
0.03333
3
0-0.9 1-1.9 2-2.9 3-3.9 4-4.9 5-5.9 6-6.9 7-7.9
0
0.05
0.1
0.15
0.2
0.25
0.3
0.35
0.4
Chart Title
iii) it is right skewed data as can be seen from the histogram
1) i)
Paraphrase This Document
Need a fresh take? Get an instant paraphrase of this document with our AI Paraphraser

More than
once per
month
Once every 1-
3 months Once every 4-
6 months Once every 7-
11 months Once per year
or less Never
0
100
200
300
400
500
600
700
Fequency Bar
ii)
Response
Frequenc
y
Frequency
Distribution
More than once per
month 338 17%
Once every 1-3 months 424 21%
Once every 4-6 months 212 10%
Once every 7-11 months 127 6%
Once per year or less 311 15%
Never 620 31%
iii)
Response Frequency Distribution
More than once per
month 0.166338583
Once every 1-3 months 0.208661417
Once every 4-6 months 0.104330709
Once every 7-11 months 0.0625
Once per year or less 0.153051181
Never 0.30511811

More than
once per
month
Once every 1-
3 months Once every 4-
6 months Once every 7-
11 months Once per year
or less Never
0
0.05
0.1
0.15
0.2
0.25
0.3
0.35
Frequency Distribution
iv)
Frequency
More than once per month Once every 1-3 months Once every 4-6 months
Once every 7-11 months Once per year or less Never
v) Yes true 30.5% of the population never backed up their data
vi) Yes true, 15.30% of the population did that
References
[1] T. Vista, "Beat Frquency Formula," [Online]. Available:
https://formulas.tutorvista.com/physics/beat-frequency-formula.html. [Accessed 25 03 2019].
[2] S. Dean, "Sampling and Data: Frequency,," 24 8 2010. [Online]. Available:
https://resources.saylor.org/wwwresources/archived/site/wp-content/uploads/2011/06/
⊘ This is a preview!⊘
Do you want full access?
Subscribe today to unlock all pages.

Trusted by 1+ million students worldwide

MA121-1.1.3-3rd.pdf. [Accessed 25 03 2019].
[3] Excel, "Box and Whisker Plot," [Online]. Available: https://www.excel-easy.com/examples/box-
whisker-plot.html. [Accessed 25 03 2019].
[4] "Relative Frequency Histogram: Definition and How to Make One," 30 01 2014. [Online].
Available: https://www.statisticshowto.datasciencecentral.com/relative-frequency-histogram-
2/. [Accessed 25 03 2019].
1 out of 7

Your All-in-One AI-Powered Toolkit for Academic Success.
+13062052269
info@desklib.com
Available 24*7 on WhatsApp / Email
Unlock your academic potential
© 2024 | Zucol Services PVT LTD | All rights reserved.