Portfolio Management : Assignment
15 Pages3303 Words37 Views
Added on 2021-06-15
Portfolio Management : Assignment
Added on 2021-06-15
ShareRelated Documents
1
Portfolio Management
Portfolio Management
2
Introduction
This report is aimed at performing risk and return analysis of stocks and portfolio
applying various statistical measures such as arithmetic mean, geometric mean, regression,
variance, covariance, and correlation. Arithmetic mean and geometric mean are used to compute
average returns and variance is the indicator of risk. The covariance and correlation are
considered to be effect in finding out the relationship between the returns of two stocks. This
identification of relation is necessary to formulate an optimum portfolio. In this report, three
stocks namely Google, Amazon, and Rio Tinto have been selected for analysis. Further, a
portfolio having composition of these stocks with equal weights has also been formed to analyze
the risk and return in relation to portfolio. Apart from this, this report also highlights the
significance of portfolio in terms risk diversification.
A Brief about Companies
Google (Alphabet Inc)
Alphabet Inc also popularly known as Google is a USA based company engaged in the
business of online advertising and branding. The company was founded in the year 1998 and
since then it grown manifold spreading business in every corner of world. The stock of Alphabet
Inc is listed on Nasdaq. The financial performance of the company is improving rapidly. In the
year 2017, the company reported revenues of $110,855 million and net profit of $12,662 million
(Yahoo finance, 2018).
Amazon Inc
Amazon is the world leader in online retail sales of consumer goods. The company
having its headquarters in United States operates globally in many countries. Apart from retailing
of consumer goods, the company also provides web services through one its segments namely
Amazon Web Services. The company was founded in the year 1994 and since then it has
expanded surprisingly to reach the customers in every part of the world. The stock of company is
listed on Nasdaq. In the year 2017, the company reported revenues of $177,866 million and net
profit of $3,033 million (Yahoo finance, 2018).
Rio Tinto
Rio Tinto is a giant company engaged in the business of exploration of minerals such as
iron ore, coal, gold, copper and diamond. The company was founded in way back 1873 and since
then it has operated successfully. The company has its headquarters in UK and it operates
globally in many countries. The company’s stock is listed on New York Stock Exchange in
USA. As per the financial statements of 2017, it generates revenues of $40,030 million with net
profit of $8,762 million (Yahoo finance, 2018).
Part-I (a)
Taking the price data of past 28 weeks (Excel attached), arithmetic and geometric mean
of returns have been computed. The arithmetic mean shows simple average of the returns over
3
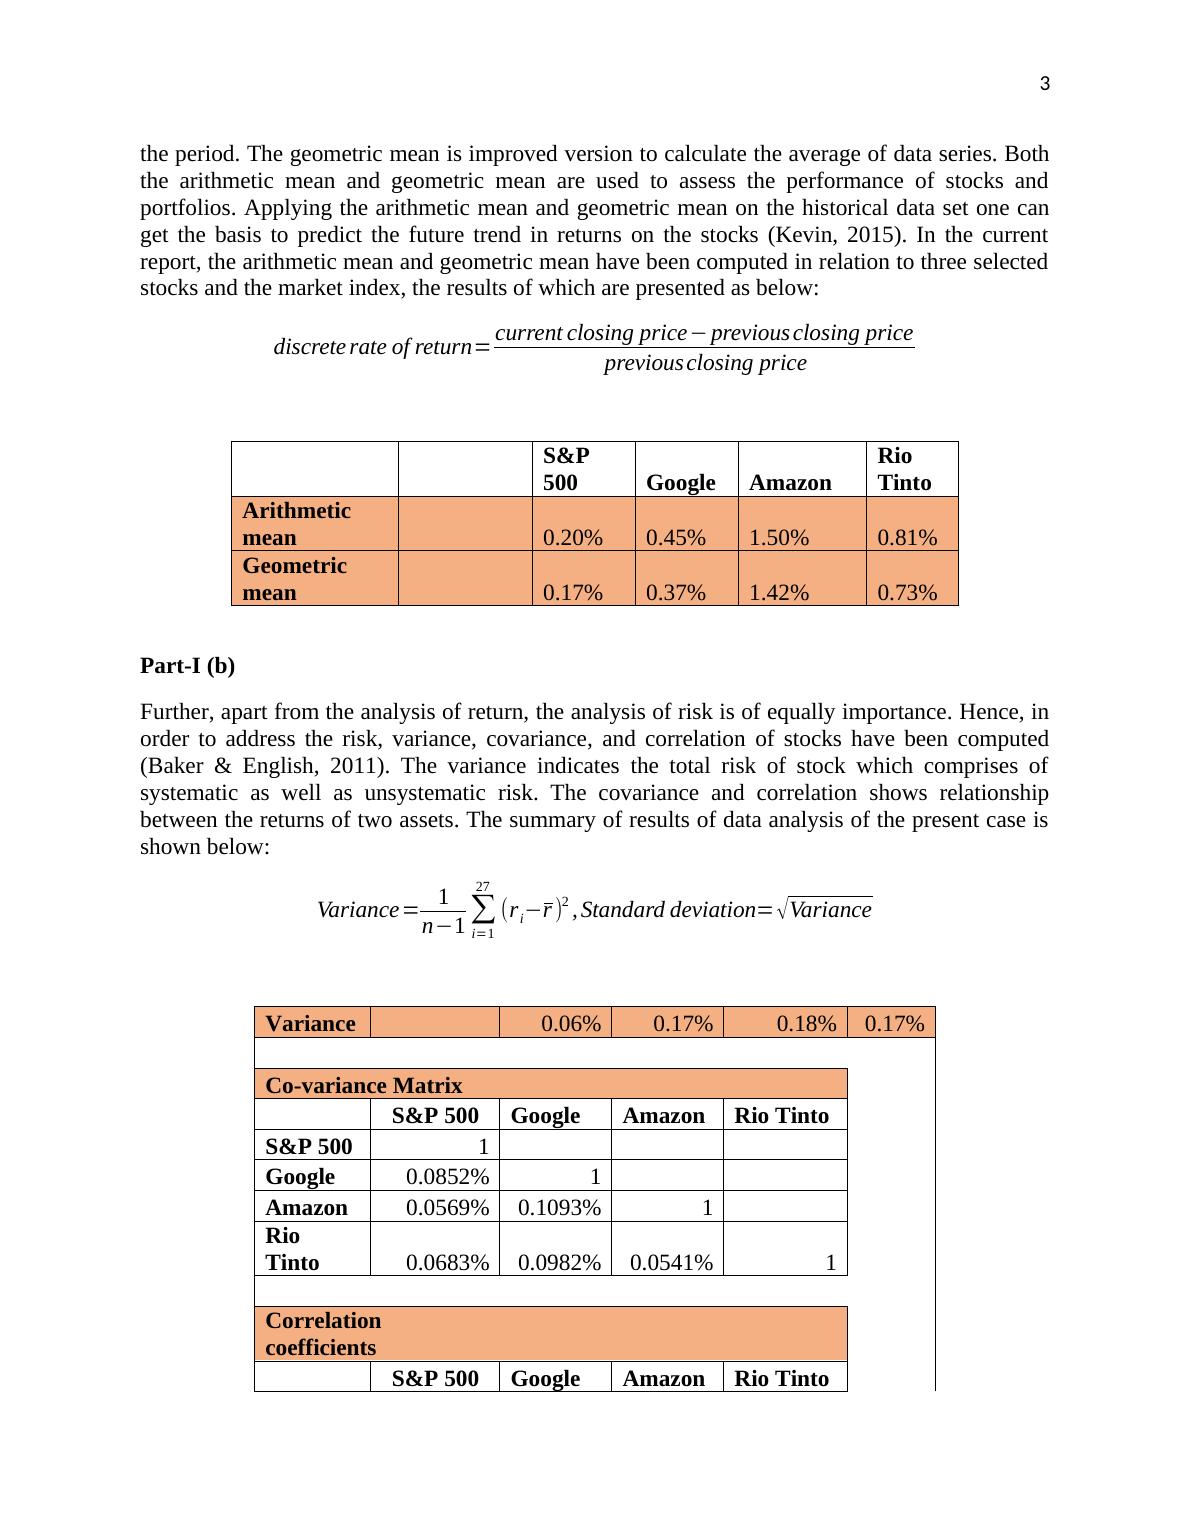
the period. The geometric mean is improved version to calculate the average of data series. Both
the arithmetic mean and geometric mean are used to assess the performance of stocks and
portfolios. Applying the arithmetic mean and geometric mean on the historical data set one can
get the basis to predict the future trend in returns on the stocks (Kevin, 2015). In the current
report, the arithmetic mean and geometric mean have been computed in relation to three selected
stocks and the market index, the results of which are presented as below:
discrete rate of return= current closing price− previous closing price
previous closing price
S&P
500 Google Amazon
Rio
Tinto
Arithmetic
mean 0.20% 0.45% 1.50% 0.81%
Geometric
mean 0.17% 0.37% 1.42% 0.73%
Part-I (b)
Further, apart from the analysis of return, the analysis of risk is of equally importance. Hence, in
order to address the risk, variance, covariance, and correlation of stocks have been computed
(Baker & English, 2011). The variance indicates the total risk of stock which comprises of
systematic as well as unsystematic risk. The covariance and correlation shows relationship
between the returns of two assets. The summary of results of data analysis of the present case is
shown below:
Variance= 1
n−1 ∑
i=1
27
(ri−r )2 , Standard deviation= √Variance
Variance 0.06% 0.17% 0.18% 0.17%
Co-variance Matrix
S&P 500 Google Amazon Rio Tinto
S&P 500 1
Google 0.0852% 1
Amazon 0.0569% 0.1093% 1
Rio
Tinto 0.0683% 0.0982% 0.0541% 1
Correlation
coefficients
S&P 500 Google Amazon Rio Tinto
4
S&P 500 1.00
Google 90.1967% 1.00
Amazon 57.9792%
65.5352
% 1.00
Rio
Tinto 61.4784%
32.1401
%
32.1401
% 1.00
Part-I (c)
From the figures presented above, it could be observed that S&P 500 (market index) is
showing arithmetic mean and geometric mean of 0.20% and 0.17% respectively. This shows that
the market earns on an average a return of 0.20% over a period of week. Further, the selected
stocks are also showing positive mean values which indicate that these stocks are providing
satisfactory return to the investors. All three stocks are generating higher returns as compared to
the stock market. Among the stocks, Amazon could be observed to be generating the highest
returns. Further, observed that Google has been the lowest earner among the stock but it is
earning returns higher than the market.
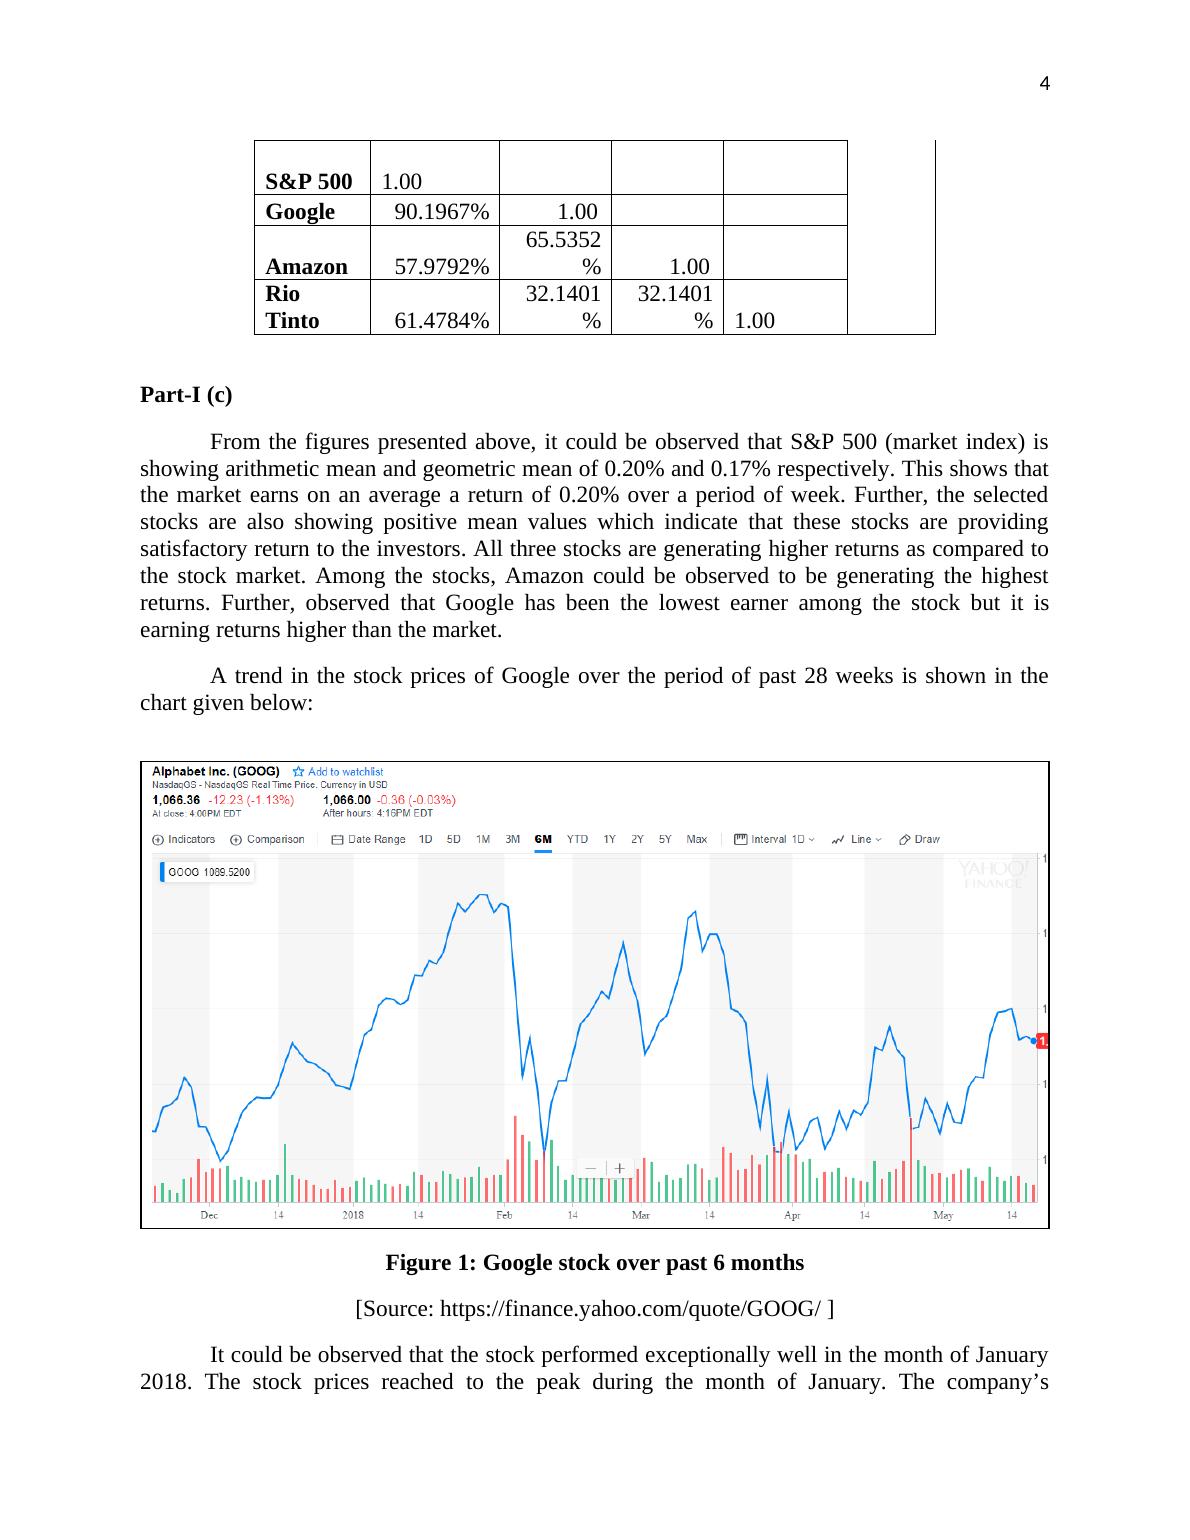
A trend in the stock prices of Google over the period of past 28 weeks is shown in the
chart given below:
Figure 1: Google stock over past 6 months
[Source: https://finance.yahoo.com/quote/GOOG/ ]
It could be observed that the stock performed exceptionally well in the month of January
2018. The stock prices reached to the peak during the month of January. The company’s
S&P 500 1.00
Google 90.1967% 1.00
Amazon 57.9792%
65.5352
% 1.00
Rio
Tinto 61.4784%
32.1401
%
32.1401
% 1.00
Part-I (c)
From the figures presented above, it could be observed that S&P 500 (market index) is
showing arithmetic mean and geometric mean of 0.20% and 0.17% respectively. This shows that
the market earns on an average a return of 0.20% over a period of week. Further, the selected
stocks are also showing positive mean values which indicate that these stocks are providing
satisfactory return to the investors. All three stocks are generating higher returns as compared to
the stock market. Among the stocks, Amazon could be observed to be generating the highest
returns. Further, observed that Google has been the lowest earner among the stock but it is
earning returns higher than the market.
A trend in the stock prices of Google over the period of past 28 weeks is shown in the
chart given below:
Figure 1: Google stock over past 6 months
[Source: https://finance.yahoo.com/quote/GOOG/ ]
It could be observed that the stock performed exceptionally well in the month of January
2018. The stock prices reached to the peak during the month of January. The company’s
End of preview
Want to access all the pages? Upload your documents or become a member.
Related Documents
Finance Portfolio Managementlg...
|12
|2430
|77
(PDF) Sample Assignment on Portfolio Managementlg...
|9
|1845
|228
International Finance Requirementlg...
|19
|2581
|31
Finance and Capital Budgeting Modelslg...
|48
|8683
|339