Analysis: Role of Knowledge Management in Marketing Innovation Report
VerifiedAdded on 2022/08/23
|13
|2463
|25
Report
AI Summary
This report presents an analysis of the role of knowledge management in driving marketing innovation. The study employs a quantitative methodology, collecting data from 95 salespersons across various institutions. The research utilizes binary regression and correlation analysis to examine the impact of factors such as employee duration, knowledge application, convincing power, and creativity on marketing innovation. The findings reveal that employee work duration is statistically insignificant, while the use of knowledge, creativity, and high convincing power are significant determinants of marketing innovation. The report also includes descriptive statistics, frequency analysis, and correlation charts to support the conclusions. Recommendations are provided for training and incentivizing sales teams to foster innovation and creativity in marketing strategies. The report concludes that education and the application of technical skills, such as creativity, are crucial for enhancing marketing innovation and driving sales performance.

Table of Contents
Task 3.......................................................................................................................................................1
Introduction..............................................................................................................................................1
Data analysis.............................................................................................................................................1
The methods.............................................................................................................................................1
Analysis results and discussion.................................................................................................................2
Binary regression analysis........................................................................................................................3
Correlation analysis..................................................................................................................................3
Further analysis............................................................................................................................................5
Regression discussion...........................................................................................................................7
Descriptive statistics.............................................................................................................................8
Appendixes.............................................................................................................................................11
Conclusion..............................................................................................................................................12
Recommendation....................................................................................................................................12
List of reference......................................................................................................................................13
Task 3
Introduction
The world is changing swiftly, everyday something new is developed and so happens in
business world too. A lot has change in the ways in which businesses and large organization
manages everything they own, unlike things like furniture and other useful accessories, filing
systems have change into electronic pieces with introduction of a complete algorithm of storing
and retrieving data. For many years businesses and large marketing organization, proudly before
the 21th century had ignored the role of knowledge management in marketing innovation
(Obeidat and Aqqad, 2017). According to Donate & de Pablo, 2015 management of knowledge is
the key tool for every organization to be leaders of innovation, creativity and ultimately to tame
the world with online marketing. Knowledge is a powerful tool and just a mustard seed, despite
its trivial size it be used to create enormous heights in marketing. Innovation and creativity are
items that are not taught in school, it can be improved through experience, seminar attendance,
training and vocational learning and finally it can be increased through research and carrier
development (Tan, 2016).
1
Paraphrase This Document
Need a fresh take? Get an instant paraphrase of this document with our AI Paraphraser
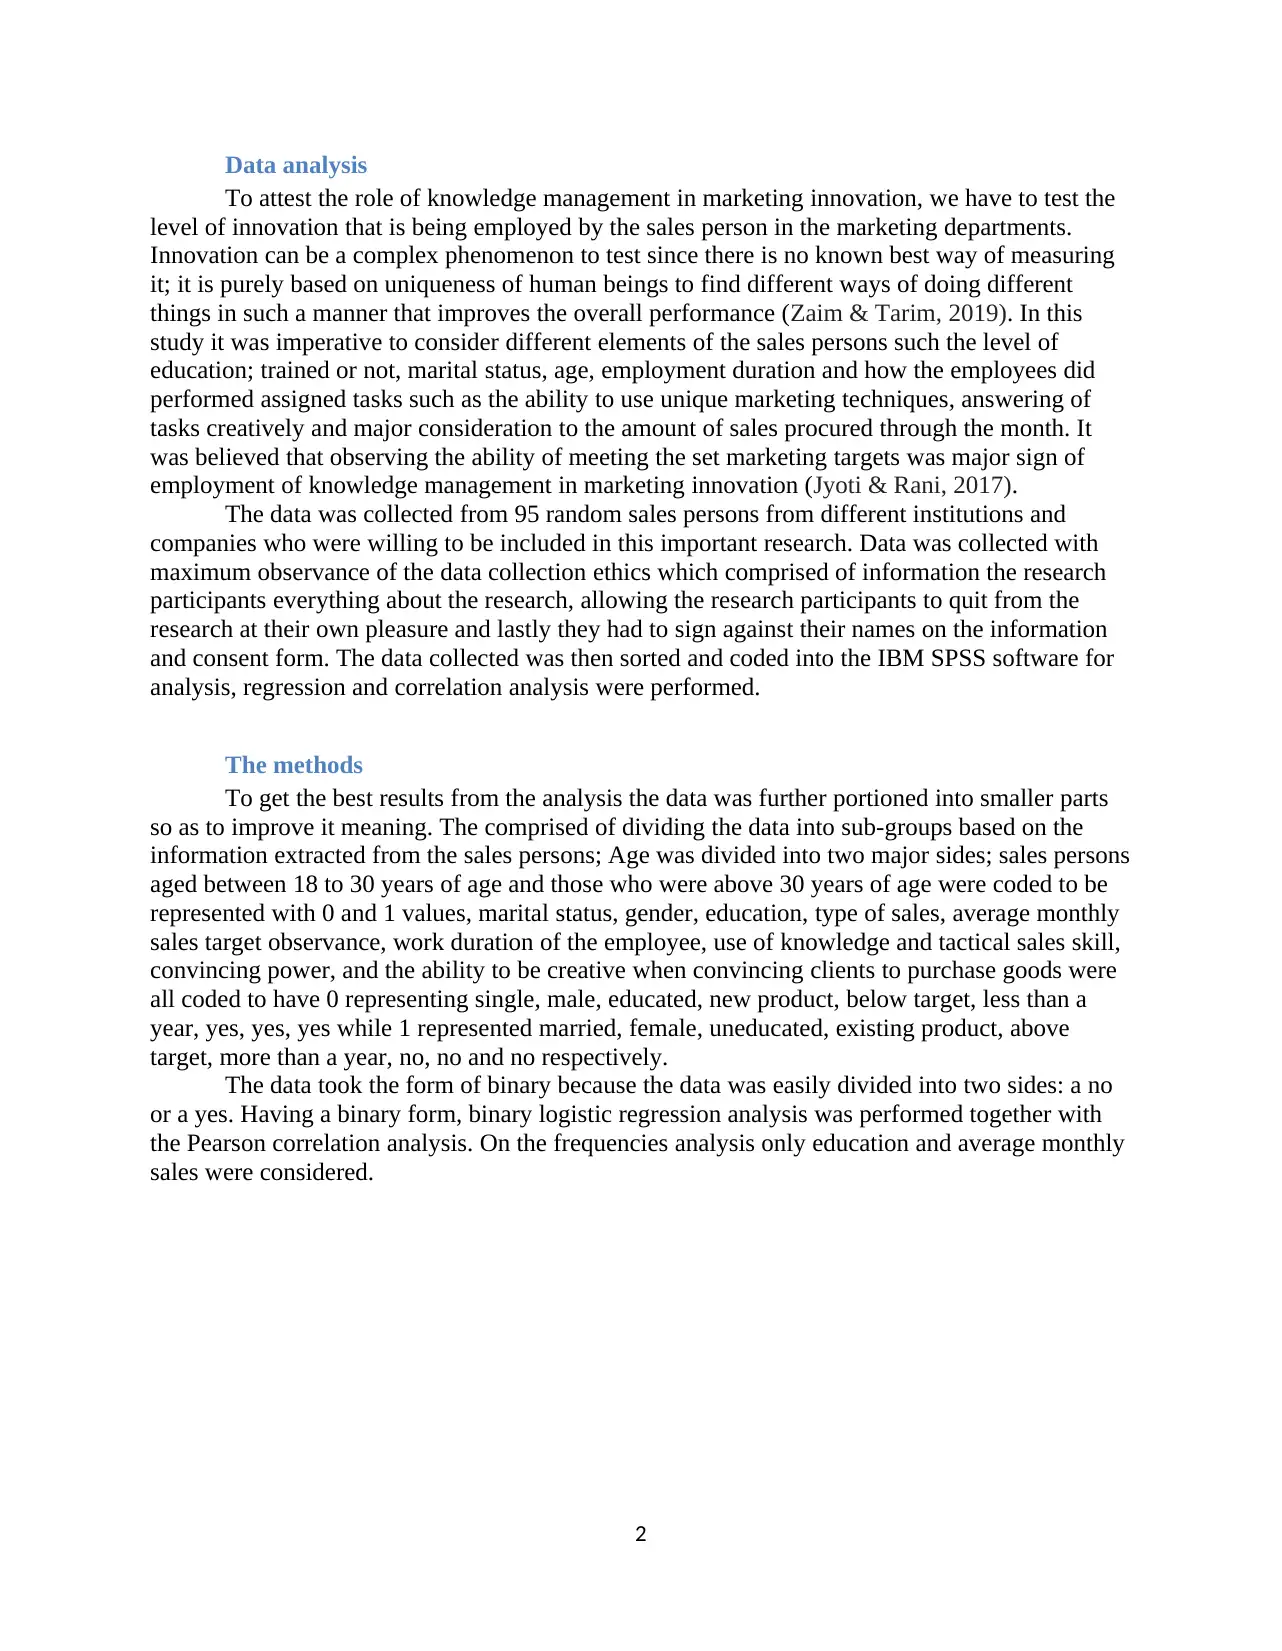
Data analysis
To attest the role of knowledge management in marketing innovation, we have to test the
level of innovation that is being employed by the sales person in the marketing departments.
Innovation can be a complex phenomenon to test since there is no known best way of measuring
it; it is purely based on uniqueness of human beings to find different ways of doing different
things in such a manner that improves the overall performance (Zaim & Tarim, 2019). In this
study it was imperative to consider different elements of the sales persons such the level of
education; trained or not, marital status, age, employment duration and how the employees did
performed assigned tasks such as the ability to use unique marketing techniques, answering of
tasks creatively and major consideration to the amount of sales procured through the month. It
was believed that observing the ability of meeting the set marketing targets was major sign of
employment of knowledge management in marketing innovation (Jyoti & Rani, 2017).
The data was collected from 95 random sales persons from different institutions and
companies who were willing to be included in this important research. Data was collected with
maximum observance of the data collection ethics which comprised of information the research
participants everything about the research, allowing the research participants to quit from the
research at their own pleasure and lastly they had to sign against their names on the information
and consent form. The data collected was then sorted and coded into the IBM SPSS software for
analysis, regression and correlation analysis were performed.
The methods
To get the best results from the analysis the data was further portioned into smaller parts
so as to improve it meaning. The comprised of dividing the data into sub-groups based on the
information extracted from the sales persons; Age was divided into two major sides; sales persons
aged between 18 to 30 years of age and those who were above 30 years of age were coded to be
represented with 0 and 1 values, marital status, gender, education, type of sales, average monthly
sales target observance, work duration of the employee, use of knowledge and tactical sales skill,
convincing power, and the ability to be creative when convincing clients to purchase goods were
all coded to have 0 representing single, male, educated, new product, below target, less than a
year, yes, yes, yes while 1 represented married, female, uneducated, existing product, above
target, more than a year, no, no and no respectively.
The data took the form of binary because the data was easily divided into two sides: a no
or a yes. Having a binary form, binary logistic regression analysis was performed together with
the Pearson correlation analysis. On the frequencies analysis only education and average monthly
sales were considered.
2

Analysis results and discussion
The chart above shows the distribution of the levels of education among the sales persons
with 68 of them educated while 27 having less or inadequate sales training.
Binary regression analysis
Variabls in the Eqtion
B S
.E.
W
ld
d
f
S
g.
E
xp()
S
tp 1a
duration_of_em
ployee
.
919
.
977
.
885 1 .
347
2
.507
use_of_knowled
ge_and_techniques_dur
ing_marketing
-
3.946
1
.150
1
1.777 1 .
001
.
019
high_convincin
g_power
-
1.771
.
890
3
.964 1 .
046
.
170
creativity_and_i
dea_generation
-
5.040
1
.387
1
3.205 1 .
000
.
006
Cnstant 5
.561
1
.524
1
3.316 1 .
000
2
59.966
a. Varible(s) enterd at stp 1: duration_of_employee,
use_of_knowledge_and_techniques_during_marketing, high_convincing_power,
creativity_and_idea_generation.
3
⊘ This is a preview!⊘
Do you want full access?
Subscribe today to unlock all pages.
Trusted by 1+ million students worldwide

From the analysis performed above, work duration of the employee, use of varied
knowledge and techniques during marketing, possession of high convincing power and of
creativity with idea generation all had a significance of .347, .001, .046, and .000 respectively
with a constant of .000.
That implies that duration of the employee on work is not statistically significant in
estimation of the role of knowledge management in marketing innovation while the use of high
convincing powers, creativity and application of knowledge where all found to be statistically
significant in the role of knowledge management in marketing innovation.
Correlation analysis
Correlations
g
ender
age
bracket
ed
ucation
marita
l status
month
ly_average_sa
le
Gender
Prson Corr 1 .154 -.1
40 .026 .023
Sig. (2-
tailed) .135 .1
76 .799 .828
N 9
5 95 95 95 95
age bracket
Prson Corr .1
54 1 -.0
53 .281** -.078
Sig. (2-
tailed)
.1
35
.6
08 .006 .455
N 9
5 95 95 95 95
Education
Prson Corr -.
140
-.05
3 1 -.134 -.038
Sig. (2-
tailed)
.1
76 .608 .195 .712
N 9
5 95 95 95 95
marital status Prson Corr .0
26
.281
**
-.1
34 1 -.054
Sig. (2-
tailed)
.7
99
.006 .1
95
.600
4
Paraphrase This Document
Need a fresh take? Get an instant paraphrase of this document with our AI Paraphraser

N 9
5 95 95 95 95
monthly_average_
sale
Prson Corr .0
23
-.07
8
.4
55 -.054 1
Sig. (2-
tailed)
.8
28 .455 .7
12 .600
N 9
5 95 95 95 95
From the Pearson correlation chart above it is observable with respect to level of education that gender,
marital status, and monthly average sales has .-.140, .195 and .455 values of R respectively. The interpretation of
this values basing on their correlation R values implies that monthly average sales correlated with the education
moderately, while gender had an inverse relationship with the education sine thy had a negative value of R.
Correlations
creativi
ty_and_idea_g
eneration
high_c
onvincing_po
wer
use_of
_knowledge_a
nd_techniques
_during_mark
eting
monthl
y_average_sal
e
creativity_and_id
ea_generation
Pearsn Corr 1 .219* .287** -.653**
Sig. (2-taild) .033 .005 .000
N 95 95 95 95
high_convincing_
power
Pearsn Corr .219* 1 .073 -.323**
Sig. (2-taild) .033 .483 .001
N 95 95 95 95
use_of_knowledg
e_and_techniques_during
_marketing
Pearsn Corr .287** .073 1 -.553**
Sig. (2-taild) .005 .483 .000
N 95 95 95 95
monthly_average
_sale
Pearsn Corr -.653** -.323** -.553** 1
Sig. (2-taild) .000 .001 .000
N 95 95 95 95
type_of_sales
Persn Corr .239* .141 .075 -.270**
Sig. (2-taild) .020 .173 .471 .008
N 95 95 95 95
5
5 95 95 95 95
monthly_average_
sale
Prson Corr .0
23
-.07
8
.4
55 -.054 1
Sig. (2-
tailed)
.8
28 .455 .7
12 .600
N 9
5 95 95 95 95
From the Pearson correlation chart above it is observable with respect to level of education that gender,
marital status, and monthly average sales has .-.140, .195 and .455 values of R respectively. The interpretation of
this values basing on their correlation R values implies that monthly average sales correlated with the education
moderately, while gender had an inverse relationship with the education sine thy had a negative value of R.
Correlations
creativi
ty_and_idea_g
eneration
high_c
onvincing_po
wer
use_of
_knowledge_a
nd_techniques
_during_mark
eting
monthl
y_average_sal
e
creativity_and_id
ea_generation
Pearsn Corr 1 .219* .287** -.653**
Sig. (2-taild) .033 .005 .000
N 95 95 95 95
high_convincing_
power
Pearsn Corr .219* 1 .073 -.323**
Sig. (2-taild) .033 .483 .001
N 95 95 95 95
use_of_knowledg
e_and_techniques_during
_marketing
Pearsn Corr .287** .073 1 -.553**
Sig. (2-taild) .005 .483 .000
N 95 95 95 95
monthly_average
_sale
Pearsn Corr -.653** -.323** -.553** 1
Sig. (2-taild) .000 .001 .000
N 95 95 95 95
type_of_sales
Persn Corr .239* .141 .075 -.270**
Sig. (2-taild) .020 .173 .471 .008
N 95 95 95 95
5

Further analysis
Variables in the Equation
B S
.E.
W
ld
D
f
S
ig.
E
xp(B)
S
tep 1a
level_of_
education
-.
182
.
487
.
140 1 .
048
.
833
Constnt .
875
.
266
1
0.820 1 .
001
2
.400
a. Varible(s) entred on stp 1: level_of_education.
From the regression table above, it is observable that considering the level of
education and regressing with meeting targets were has a significance value of .048,
which is lower than the pass value .005, therefore it is education is statistically
significant in determining the increasing monthly sales and target meeting.
Variables in the Equation
B S
.E.
W
ald
d
f
S
ig. xp(B)
S
tep 1a
use_of_knowled
ge_and_techniques_dur
ing_marketing
-
2.644
.
538
2
4.132 1 .
000
Constant 1
.846
.
359
2
6.482 1 .
000
a. Variable(s) entered on step 1:
use_of_knowledge_and_techniques_during_marketing.
Variables in the Equation
B S
.E.
W
ald
d
f
S
ig. xp(B)
S
tep 1a
high_convinci
ng_power
-
1.474
.
484
9
.294 1 .
002 229
Constant 1
.331
.
300
1
9.626 1 .
000 .786
6
Variables in the Equation
B S
.E.
W
ld
D
f
S
ig.
E
xp(B)
S
tep 1a
level_of_
education
-.
182
.
487
.
140 1 .
048
.
833
Constnt .
875
.
266
1
0.820 1 .
001
2
.400
a. Varible(s) entred on stp 1: level_of_education.
From the regression table above, it is observable that considering the level of
education and regressing with meeting targets were has a significance value of .048,
which is lower than the pass value .005, therefore it is education is statistically
significant in determining the increasing monthly sales and target meeting.
Variables in the Equation
B S
.E.
W
ald
d
f
S
ig. xp(B)
S
tep 1a
use_of_knowled
ge_and_techniques_dur
ing_marketing
-
2.644
.
538
2
4.132 1 .
000
Constant 1
.846
.
359
2
6.482 1 .
000
a. Variable(s) entered on step 1:
use_of_knowledge_and_techniques_during_marketing.
Variables in the Equation
B S
.E.
W
ald
d
f
S
ig. xp(B)
S
tep 1a
high_convinci
ng_power
-
1.474
.
484
9
.294 1 .
002 229
Constant 1
.331
.
300
1
9.626 1 .
000 .786
6
⊘ This is a preview!⊘
Do you want full access?
Subscribe today to unlock all pages.
Trusted by 1+ million students worldwide

a. Variable(s) entered on step 1: high_convincing_power.
Variables in the Equation
B S
.E.
W
ald
d
f
S
ig. xp(B)
S
tep 1a
creativity_and_i
dea_generation
-
4.391
1
.056
1
7.292 1 .
001
Constant 3
.892
1
.010
1
4.843 1 .
000
a. Variable(s) entered on step 1: creativity_and_idea_generation.
Regression discussion
From the binary logistic regression tables displayed above, we are able to observed
very accurate significance values at .000, .002 and at .001 for using knowledge, high
convincing power and application of creativity in determining marketing innovation. In
determination of the role of knowledge in marketing innovation, it is clearly seen that
education is significant but not as more as other application of technical skills used in
innovation such as creativity. The definition of knowledge here has to be assumed to take
the form not only of education and skills but also valuable training and experiences one can
use to change the world of marketing.
Correlations
g
ender
age
bracket
marit
al status
ed
ucation
Gend
er
Pearson
Correlation 1 .15
4 .026 -.1
40
Sig. (2-
tailed)
.13
5 .799 .1
76
N 9
5 95 95 95
age
bracket
Pearson
Correlation
.
154
1 .281** -.0
53
7
Paraphrase This Document
Need a fresh take? Get an instant paraphrase of this document with our AI Paraphraser

Sig. (2-
tailed)
.
135 .006 .6
08
N 9
5 95 95 95
marit
al status
Pearson
Correlation
.
026
.28
1** 1 -.1
34
Sig. (2-
tailed)
.
799
.00
6
.1
95
N 9
5 95 95 95
Educ
ation
Pearson
Correlation
-.
140
-.05
3 -.134 1
Sig. (2-
tailed)
.
176
.60
8 .195
N 9
5 95 95 95
**. Correlation is significant at the 0.01 level (2-tailed).
Descriptive statistics
Descriptive Statistics
N M
ini
M
axi
M
ean
Std.
Deviation
Gender 9
5 0 1 .
33 .471
age bracket 9
5 0 1 .
71 .458
marital status 9
5 0 1 .
76 .431
Education 9
5 0 1 .
28 .453
type_of_sales 9
5 0 1 .
33 .471
monthly_averag
e_sale
9
5 0 1 .
69 .463
duration_of_em
ployee
9
5 0 1 .
84 .367
8
tailed)
.
135 .006 .6
08
N 9
5 95 95 95
marit
al status
Pearson
Correlation
.
026
.28
1** 1 -.1
34
Sig. (2-
tailed)
.
799
.00
6
.1
95
N 9
5 95 95 95
Educ
ation
Pearson
Correlation
-.
140
-.05
3 -.134 1
Sig. (2-
tailed)
.
176
.60
8 .195
N 9
5 95 95 95
**. Correlation is significant at the 0.01 level (2-tailed).
Descriptive statistics
Descriptive Statistics
N M
ini
M
axi
M
ean
Std.
Deviation
Gender 9
5 0 1 .
33 .471
age bracket 9
5 0 1 .
71 .458
marital status 9
5 0 1 .
76 .431
Education 9
5 0 1 .
28 .453
type_of_sales 9
5 0 1 .
33 .471
monthly_averag
e_sale
9
5 0 1 .
69 .463
duration_of_em
ployee
9
5 0 1 .
84 .367
8

use_of_knowled
ge_and_techniques_dur
ing_marketing
9
5 0 1 .
31 .463
high_convincin
g_power
9
5 0 1 .
29 .458
creativity_and_i
dea_generation
9
5 0 1 .
47 .502
Valid N
(listwise)
9
5
Frequencies of variable and their distribution
Gender
Fr
e
% V
%t
Cum
%
V
alid
m
ale 64 6
7.4 67.4 67.4
f
emale 31 3
2.6 32.6 100.0
T
otal 95 1
00.0
100.
0
age bracket
F % V % Cum
%
V
alid
18-30
years 28 2
9.5 29.5 29.5
30 years
and above 67 7
0.5 70.5 100.0
Total 95 1
00.0
100.
0
marital status
Fr
eq
% Vald
%
Cume
%
9
⊘ This is a preview!⊘
Do you want full access?
Subscribe today to unlock all pages.
Trusted by 1+ million students worldwide

V
alid
s
ingle 23 2
4.2 24.2 24.2
m
arried 72 7
5.8 75.8 100.0
T
otal 95 1
00.0
100.
0
monthly_average_sale
Fr
e
% V % Cumu
lative %
V
alid
belo
w target 29 3
0.5 30.5 30.5
abo
ve target 66 6
9.5 69.5 100.0
Tota
l 95 1
00.0
100.
0
duration_of_employee
Fr
eq
% V % Cume
%
V
alid
less than
a year 15 1
5.8 15.8 15.8
more
than a year 80 8
4.2 84.2 100.0
Total 95 1
00.0
100.
0
use_of_knowledge_and_techniques_during_marketing
Fr
equ
% Valid
%
Cum
%
V
alid
Y
es 66 6
9.5 69.5 69.5
N
o
29 3
0.5
30.5 100.0
10
alid
s
ingle 23 2
4.2 24.2 24.2
m
arried 72 7
5.8 75.8 100.0
T
otal 95 1
00.0
100.
0
monthly_average_sale
Fr
e
% V % Cumu
lative %
V
alid
belo
w target 29 3
0.5 30.5 30.5
abo
ve target 66 6
9.5 69.5 100.0
Tota
l 95 1
00.0
100.
0
duration_of_employee
Fr
eq
% V % Cume
%
V
alid
less than
a year 15 1
5.8 15.8 15.8
more
than a year 80 8
4.2 84.2 100.0
Total 95 1
00.0
100.
0
use_of_knowledge_and_techniques_during_marketing
Fr
equ
% Valid
%
Cum
%
V
alid
Y
es 66 6
9.5 69.5 69.5
N
o
29 3
0.5
30.5 100.0
10
Paraphrase This Document
Need a fresh take? Get an instant paraphrase of this document with our AI Paraphraser

T
otal 95 1
00.0
100.
0
creativity_and_idea_generation
Fr
eq
% Vald
%
Cum
%
V
alid
Y
es 50 5
2.6 52.6 52.6
N
o 45 4
7.4 47.4 100.0
T
otal 95 1
00.0
100.
0
Appendixes
11
otal 95 1
00.0
100.
0
creativity_and_idea_generation
Fr
eq
% Vald
%
Cum
%
V
alid
Y
es 50 5
2.6 52.6 52.6
N
o 45 4
7.4 47.4 100.0
T
otal 95 1
00.0
100.
0
Appendixes
11

12
⊘ This is a preview!⊘
Do you want full access?
Subscribe today to unlock all pages.
Trusted by 1+ million students worldwide
1 out of 13
Related Documents


Your All-in-One AI-Powered Toolkit for Academic Success.
+13062052269
info@desklib.com
Available 24*7 on WhatsApp / Email
![[object Object]](/_next/static/media/star-bottom.7253800d.svg)
Unlock your academic potential
Copyright © 2020–2026 A2Z Services. All Rights Reserved. Developed and managed by ZUCOL.