GEOG 1191 Assignment: Exploring Perception and Land Use Decisions
VerifiedAdded on 2022/09/14
|6
|2164
|14
Homework Assignment
AI Summary
This assignment, for GEOG 1191, explores the multifaceted relationship between human perception and land use decisions. Question 1 focuses on perceptions of ecologically sustainable forestry and community safety in Kelowna, analyzing different perspectives and their impact on wildfire risk management. Question 2 examines the influence of mental maps on land use choices, delving into how these mental representations affect society. Question 3 involves a survey of ten individuals to assess their environmental preferences for different regions in British Columbia, comparing these preferences with the concept of mental maps and the 'View from California'. The assignment requires critical analysis, data presentation, and reflection on the interplay of individual perceptions, regional characteristics, and land use planning, using concepts from the course textbook and provided articles. The goal is to understand how perception shapes the way we view and interact with the environment.
Question 1 relates to the section on how people perceive, which is covered in
Unit 2, Module 5.
Read the article “Forest as hazard, forest as victim: Community perspectives
and disaster mitigation in the aftermath of Kelowna’s 2003 wildfires”
(Goemans & Ballamingie, 2012) and answer the following questions: (20
marks total)
1. The authors identify three different perceptions towards ecologically
sustainable forestry and community safety. In a paragraph each,
identify and describe each. Why do the perceptions vary? (5 marks)
2. The authors describe an evolution of geographic thought around
human perception of natural hazards that accounts for our changing
ideas about society’s vulnerability. Briefly outline the key points in this
discussion. Which approach in Module 5 evaluates human adjustment
to the natural environment? (5 marks)
3. If your job was to plan urban-rural-natural land use in Kelowna and the
surrounding areas, how do you think your understanding of these
different perceptions would help you in developing different
approaches with which to educate people on fire risk and
management? Identify and briefly discuss three ways that you could
educate people (keeping in mind their different perceptions) on what
they can do to protect their property and community from wildfire.
Your answer should be approximately 500 words (two double-spaced
pages). (10 marks)
Question 2:
One of the themes around perception is that perception varies with
knowledge and is closely related to the cultural and social considerations of
the individual who holds a particular mental “picture”. Mental maps of
geographic areas are heavily influenced by one’s perception.
Six ways that mental maps can be important and impact society include:
1. Mental images change in a shrinking world, and we become
increasingly aware of this when something happens in one place that
affects us all.
2. Mental images around mobility or population movement
3. Perceptions of a few can impact many.
4. People in power can have distorted mental maps/images.
5. Mental maps change.
6. Mental maps explore what we think of unknown areas and what we
don’t know.
Paraphrase This Document
Need a fresh take? Get an instant paraphrase of this document with our AI Paraphraser
In an essay of approximately 750 words (~3 pages double-spaced), discuss
which one of the six, in your opinion, has the greatest influence on land use
decision making. (20 marks)
Question 3:
For this question, you will need the help of at least ten people. You will only
need each person’s help for about five minutes, so you should be able to
persuade friends or people you know to help you. If you cannot come up with
ten people, get as many as you can. They are going to help you explore the
realm of environmental preferences that we discussed in the unit.
Follow the step-by-step procedure, and answer the questions as you come to
them: (60 marks)
Step 1:
Prepare a list of locations (see below) on paper or a digital file. Select at least
ten people who will participate in this exercise. You may approach them one
at a time or in groups. (Steps 2 through 4 are worth 20 marks collectively;
step 5 is worth 40 marks)
Step 2:
Provide each of the ten people with a list of the following regions in British
Columbia, and ask them to rank these regions in terms of their preferability
as places in which to live.
Make sure that each person assigns the number 12 to the least desirable
region and 1 to the most desirable place to live.
The regions are:
A. Greater Victoria
B. The rest of Vancouver Island
C. Greater Vancouver
D. The Fraser Valley
E. The Okanagan Valley
F. The Kootenays
G. Kamloops/Thompson
H. The Sunshine Coast/Sechelt Peninsula
I. The Central Interior
J. The Peace River District
K. The Northwest
L. The North
Do not allow the respondents to work together or to listen in on or see each
other’s responses. If they ask you what are the boundaries of the various
regions, tell them to guess (this in itself might be an interesting indication of
your respondents’ mental maps of the regions and their characteristics).
This will result in ten lists, each with the 12 locations and numbers indicating
preferences from 1 to 12. You will provide the raw numbers for this exercise
as part of the table you hand in (see Step 4, below). (5 marks)
Step 3:
Next, ask the respondents to indicate if he or she knows each of the regions
well, a little, or not at all. Each time a participant indicates that they know a
place “well”, assign a score of 3 for that location. Each time a participant
indicates they know a place “a little”, assign a score of 2 for that location.
And finally, assign a score of 1 for each location that is not known at all. You
will provide the raw numbers as part of the table that you hand in (see
Step 4, below). (5 marks)
Step 4:
Calculate, and present in two tables, the data from above.
The first table presents the results from participants about their most to least
desirable places to live (Step 2): (5 marks)
Write the names of participants across one axis and the location
names across another. In each corresponding square or cell, put in the
raw numbers (1–12) assigned by each participant.
Aggregate (total) the answers for the 12 locations by adding a “Total”
column to your table. Place the total for each location in that column.
To do this, add the sum of the preferences for each region and rank
the regions from the lowest to the highest preference score. The
region with the smallest aggregate score is the most desirable as a
place to live.
Change the order of the above 12 locations in your table so that the
most desirable place appears first in your table and the least desirable
place appears last. These placings are based on the aggregate totals
that you calculated.
The second table presents the results from Step 3, when you asked the
respondents to indicate how well they know each place: (5 marks)
Write the names of the participants across one axis and the location
names across another. In each corresponding square or cell, put in the
⊘ This is a preview!⊘
Do you want full access?
Subscribe today to unlock all pages.
Trusted by 1+ million students worldwide
number that indicates how well they know a location (1 for “not at all”,
2 for “a little”, or 3 for “well”).
Add a “Total” column and for each of the 12 locations, total up the
scores that match whether participants felt they know a place well, a
little, or not at all.
Present your totals in a column and order the locations from best
known (top) to least known (bottom). (Note: Your table may have
“ties”. This is okay. Just group all the well-known, little-known, and
unknown locations together.
In this table, the locations with the highest scores are the ones that
are known the best.
Step 5:
Write answers for each of the following questions:
A. What areas are ranked by the entire group as being the four most
preferable regions in which to live? (Identify these areas clearly.).
What might be the reasons for these preferences? Include ideas based
on your opinion and building on the concepts from pages 36–37 in
your textbook. Reviewing the concept region on pages 36–37 of your
textbook will provide some theoretical background. In particular,
consider the differences between regionalization, regionalism, and
vernacular regions, and the roles that these views may play in helping
you understand the patterns for preferences that you are seeing in
your data.
For the third part of Part A, consider the map below titled “The View
from California”. The map shows patterns of residential desirability
using zones indicated by numbers. So, on this map, the zone with a
value of 80 is the most desirable, and places to the left of the 80 line
indicates this zone. For example, levels of residential desirability are
high on the west coast, extending from California to Washington State.
(If you are not sure where California and Washington State are
located, use a search engine to consult a map of the United States.)
Moving eastwards from the west coast, desirability sinks to a low in
Utah (where the zone is 40), but then rises to a plateau in Colorado
(where the zone is 60). From here eastwards, there is a gradual
decline to the low point of the Dakotas, but at this point the essentially
west-east trend changes.
From about the one hundred degree meridian, the trend shifts to a
north-south one. Values rise towards the northeast, but decline to the
south (with the exception of Florida).
Paraphrase This Document
Need a fresh take? Get an instant paraphrase of this document with our AI Paraphraser
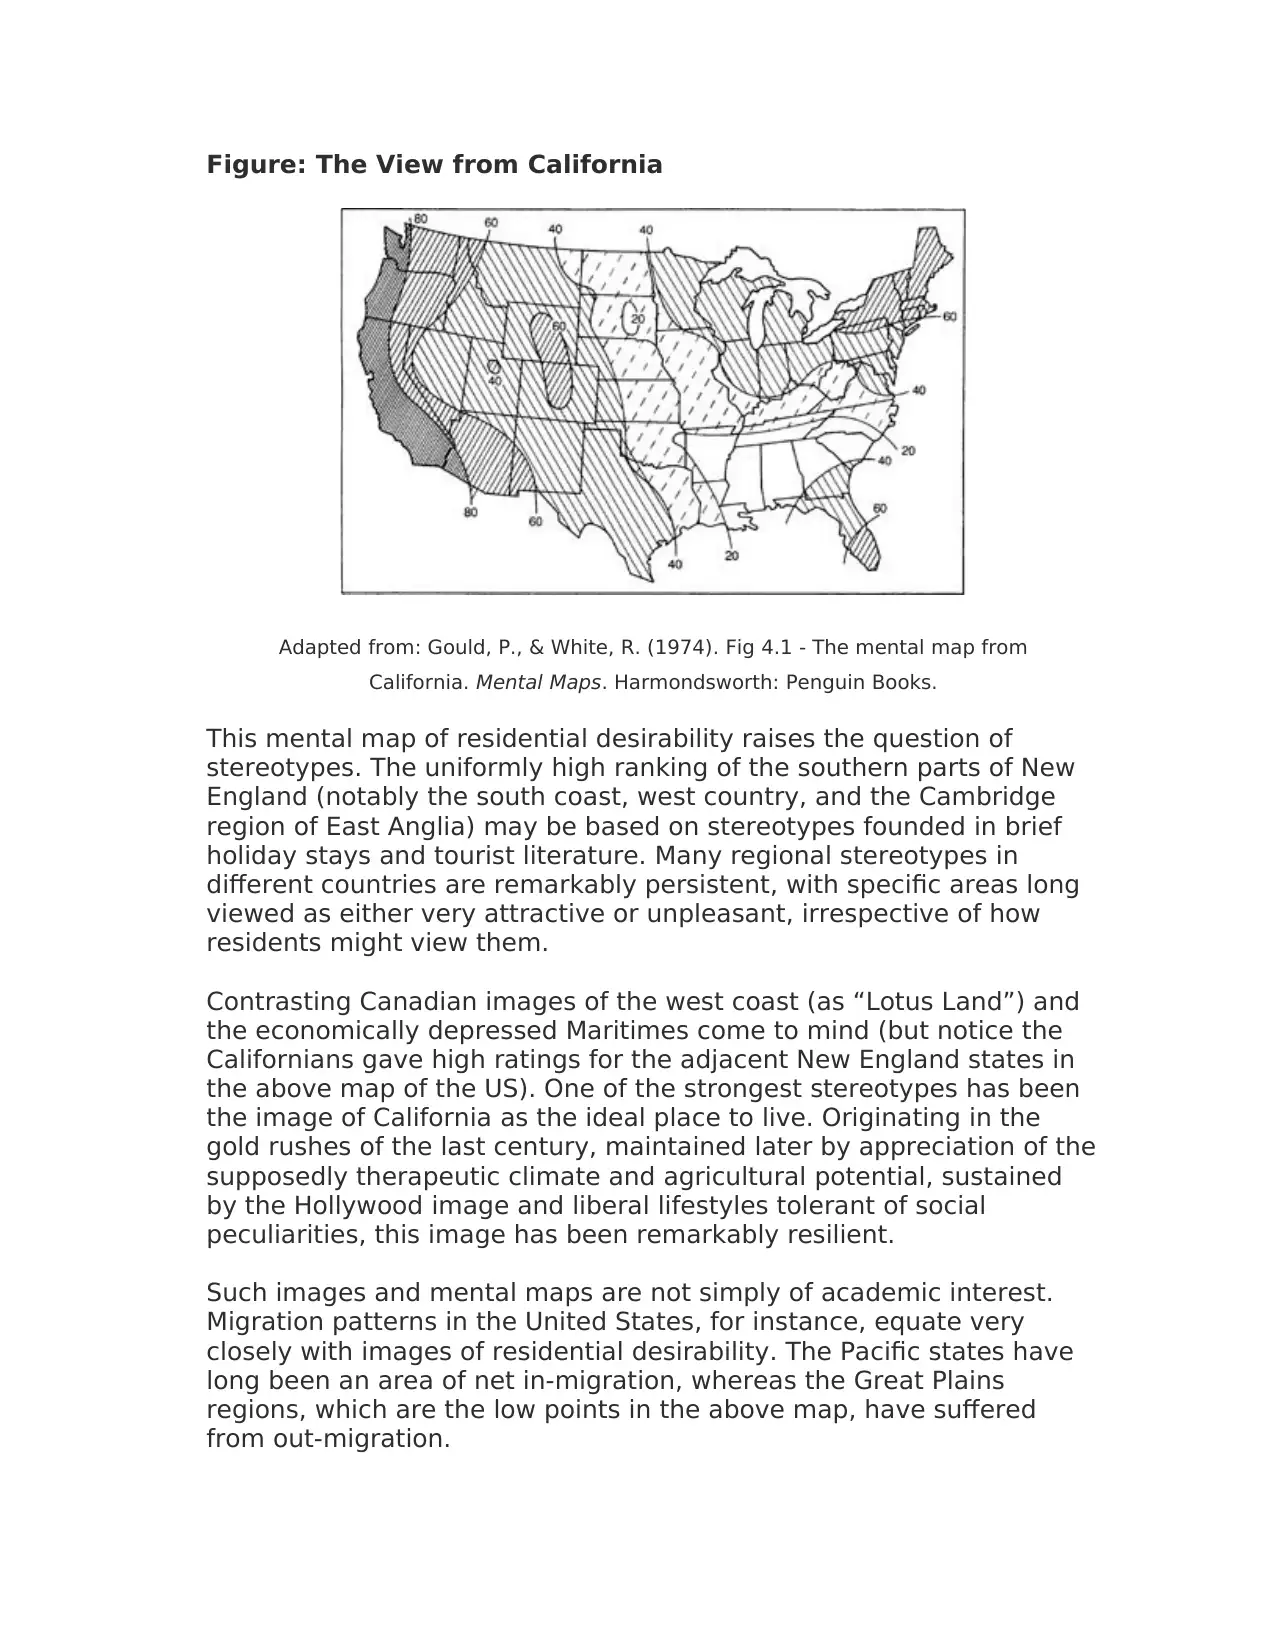
Figure: The View from California
Adapted from: Gould, P., & White, R. (1974). Fig 4.1 - The mental map from
California. Mental Maps. Harmondsworth: Penguin Books.
This mental map of residential desirability raises the question of
stereotypes. The uniformly high ranking of the southern parts of New
England (notably the south coast, west country, and the Cambridge
region of East Anglia) may be based on stereotypes founded in brief
holiday stays and tourist literature. Many regional stereotypes in
different countries are remarkably persistent, with specific areas long
viewed as either very attractive or unpleasant, irrespective of how
residents might view them.
Contrasting Canadian images of the west coast (as “Lotus Land”) and
the economically depressed Maritimes come to mind (but notice the
Californians gave high ratings for the adjacent New England states in
the above map of the US). One of the strongest stereotypes has been
the image of California as the ideal place to live. Originating in the
gold rushes of the last century, maintained later by appreciation of the
supposedly therapeutic climate and agricultural potential, sustained
by the Hollywood image and liberal lifestyles tolerant of social
peculiarities, this image has been remarkably resilient.
Such images and mental maps are not simply of academic interest.
Migration patterns in the United States, for instance, equate very
closely with images of residential desirability. The Pacific states have
long been an area of net in-migration, whereas the Great Plains
regions, which are the low points in the above map, have suffered
from out-migration.
Although the figure is at a different scale than the province of BC (the
regions you surveyed), do you see any patterns or similarities in the
concepts between “The View from California” (as presented above and
from your own knowledge) and your analyzed data? Are there zones or
areas in BC that are more desirable to live than others? Is this
reflected in the data you collected? Do you think all people who live in
BC would share this view? You are expected to discuss the ideas of
differences in climate, land use (agriculture, residential, etc.), and
economic development (related to migration), as described above.
(Total for Part A: 20 marks)
Reference: Gould, P. R. (1966). “Some Implications of Mental
Maps.” Position Paper #9.
B. Does the pattern of preferences shown by your respondents surprise
you? If so, how? Why did the pattern surprise you? If not, why not?
Would you have expressed the same preferences? (10 marks)
C. Is there any relationship between the respondents’ preferences for
regions and their familiarity with those regions? Use a graphic or
tabular way to show if there is such a relationship. (10 marks)
⊘ This is a preview!⊘
Do you want full access?
Subscribe today to unlock all pages.
Trusted by 1+ million students worldwide
1 out of 6
Your All-in-One AI-Powered Toolkit for Academic Success.
+13062052269
info@desklib.com
Available 24*7 on WhatsApp / Email
![[object Object]](/_next/static/media/star-bottom.7253800d.svg)
Unlock your academic potential
Copyright © 2020–2026 A2Z Services. All Rights Reserved. Developed and managed by ZUCOL.