Data Analysis Report: Ranking Toughest Sports - Data Analysis
VerifiedAdded on 2022/08/23
|11
|1193
|19
Report
AI Summary
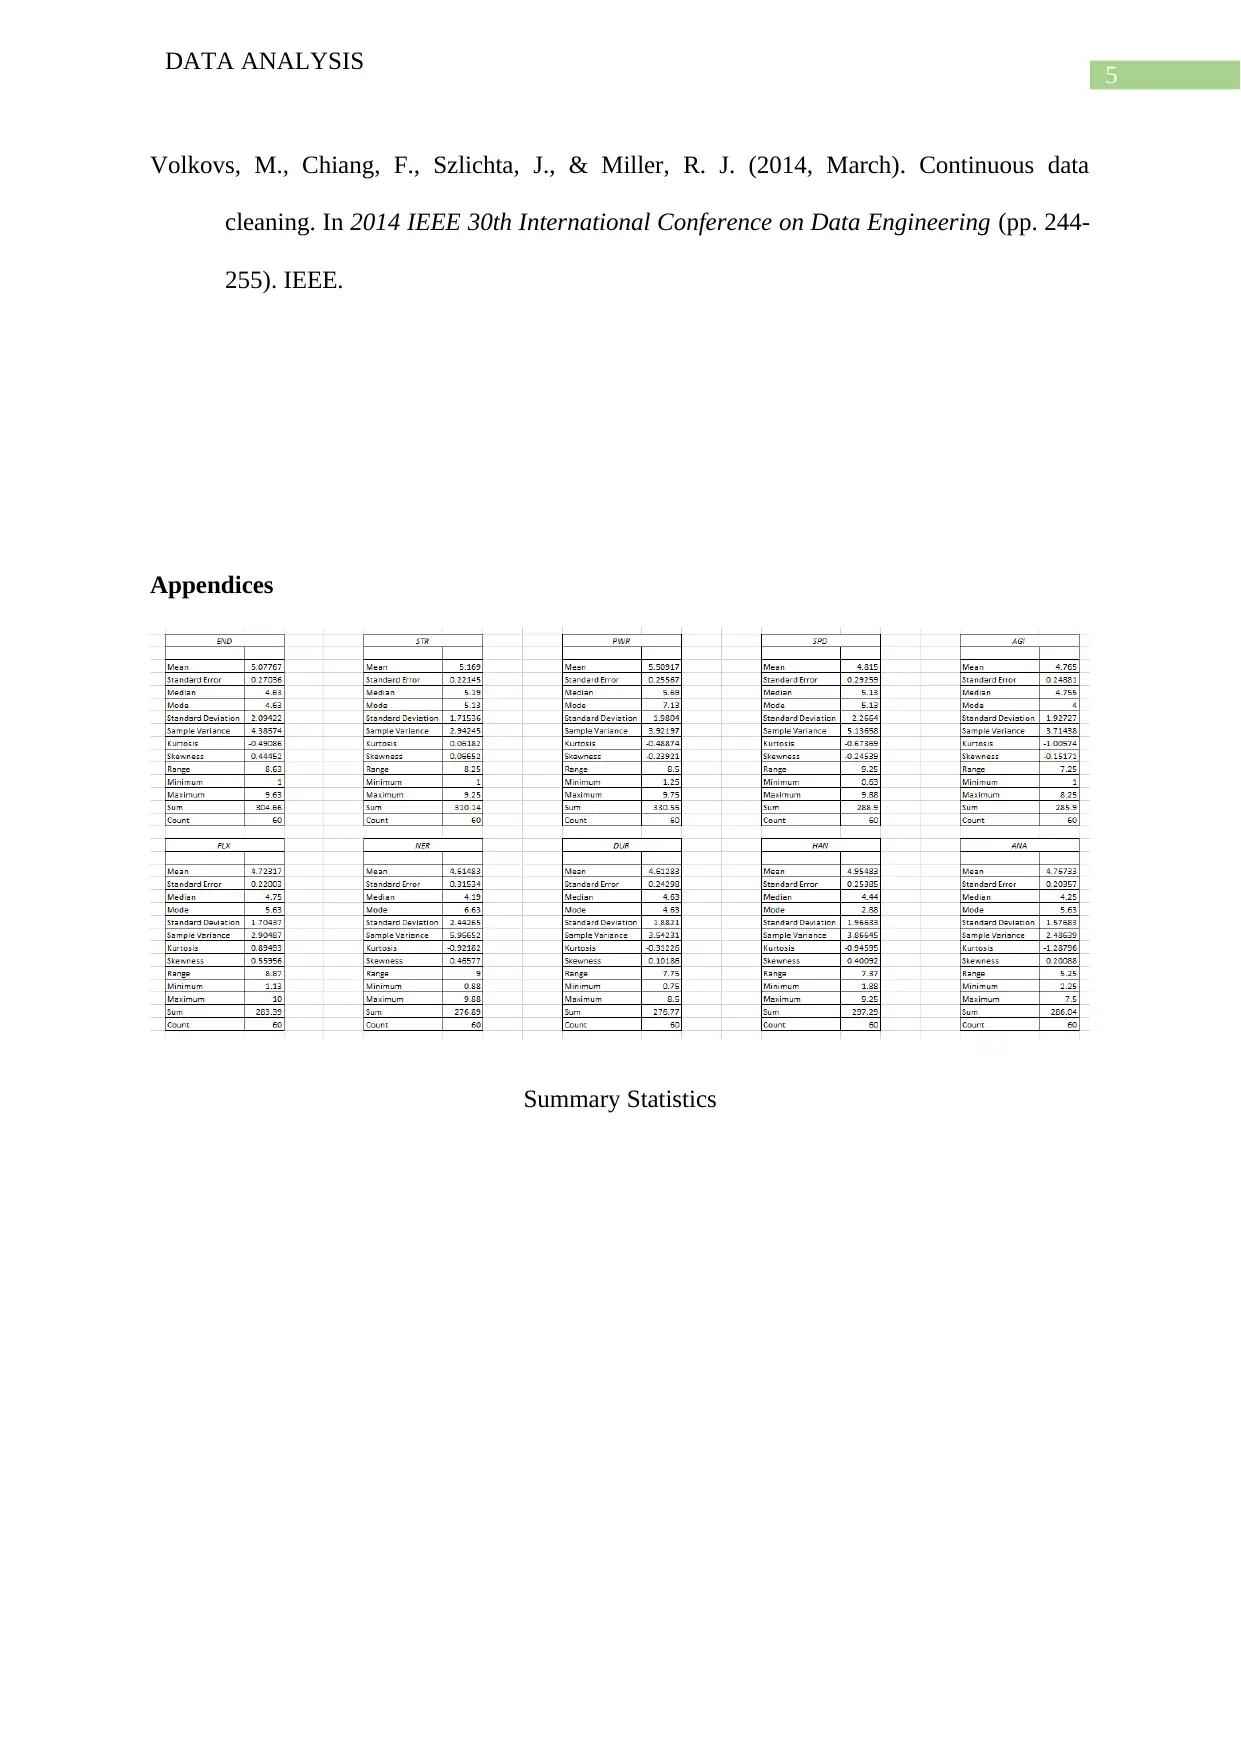
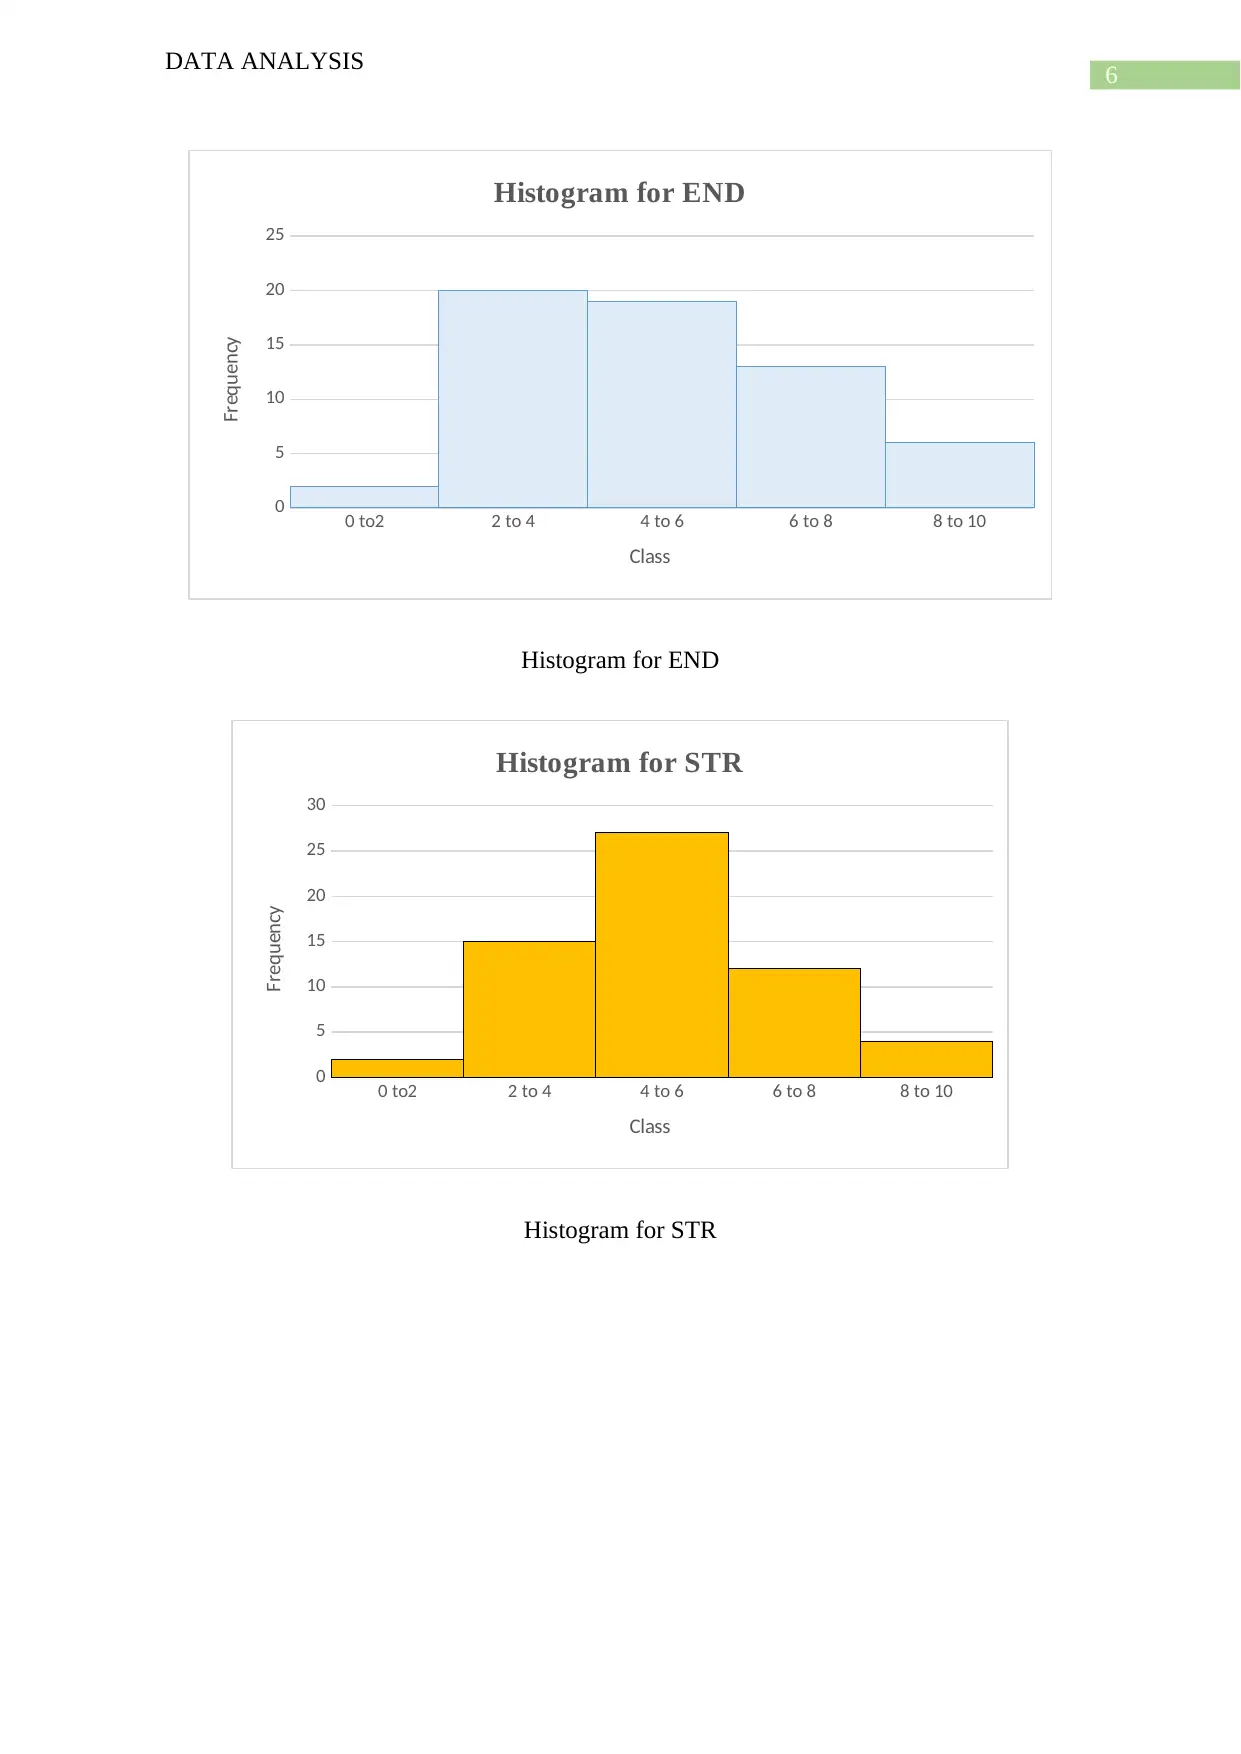
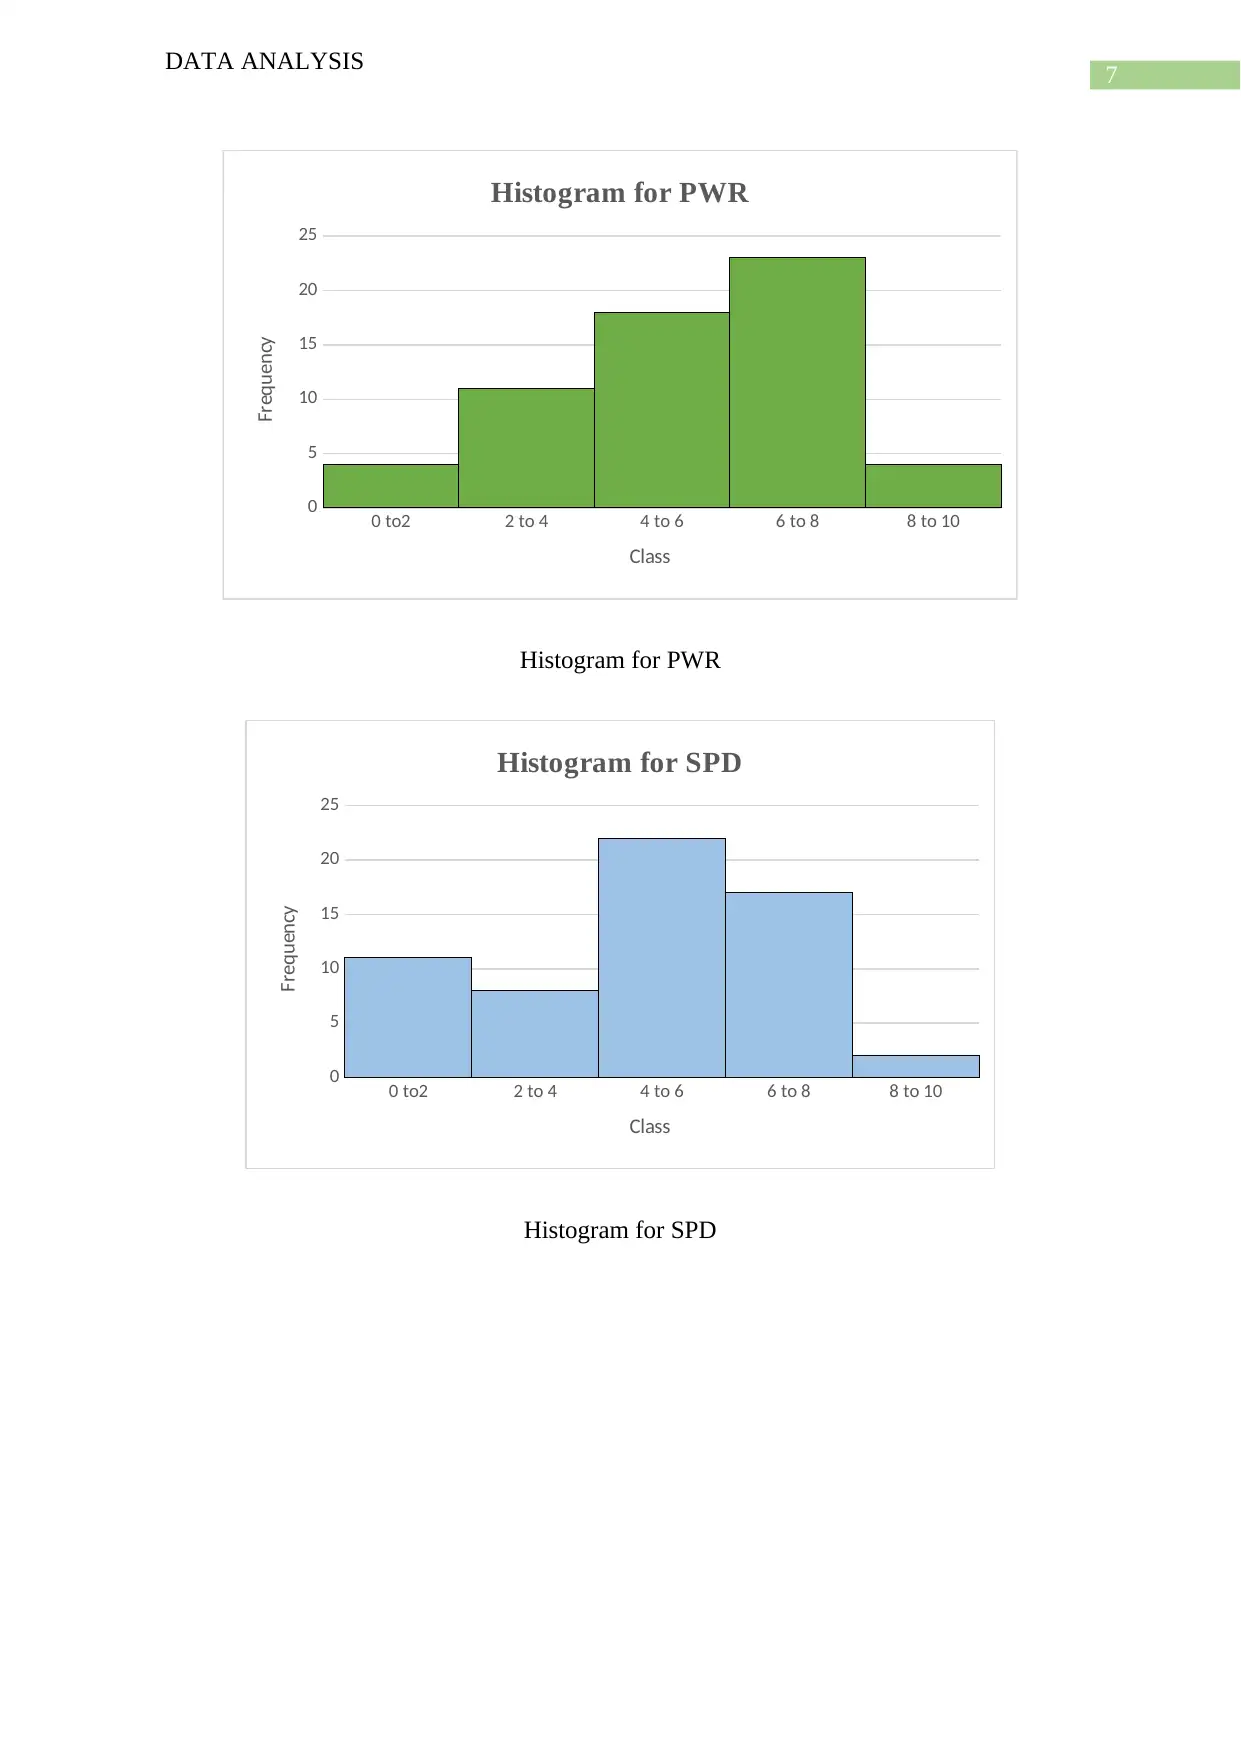
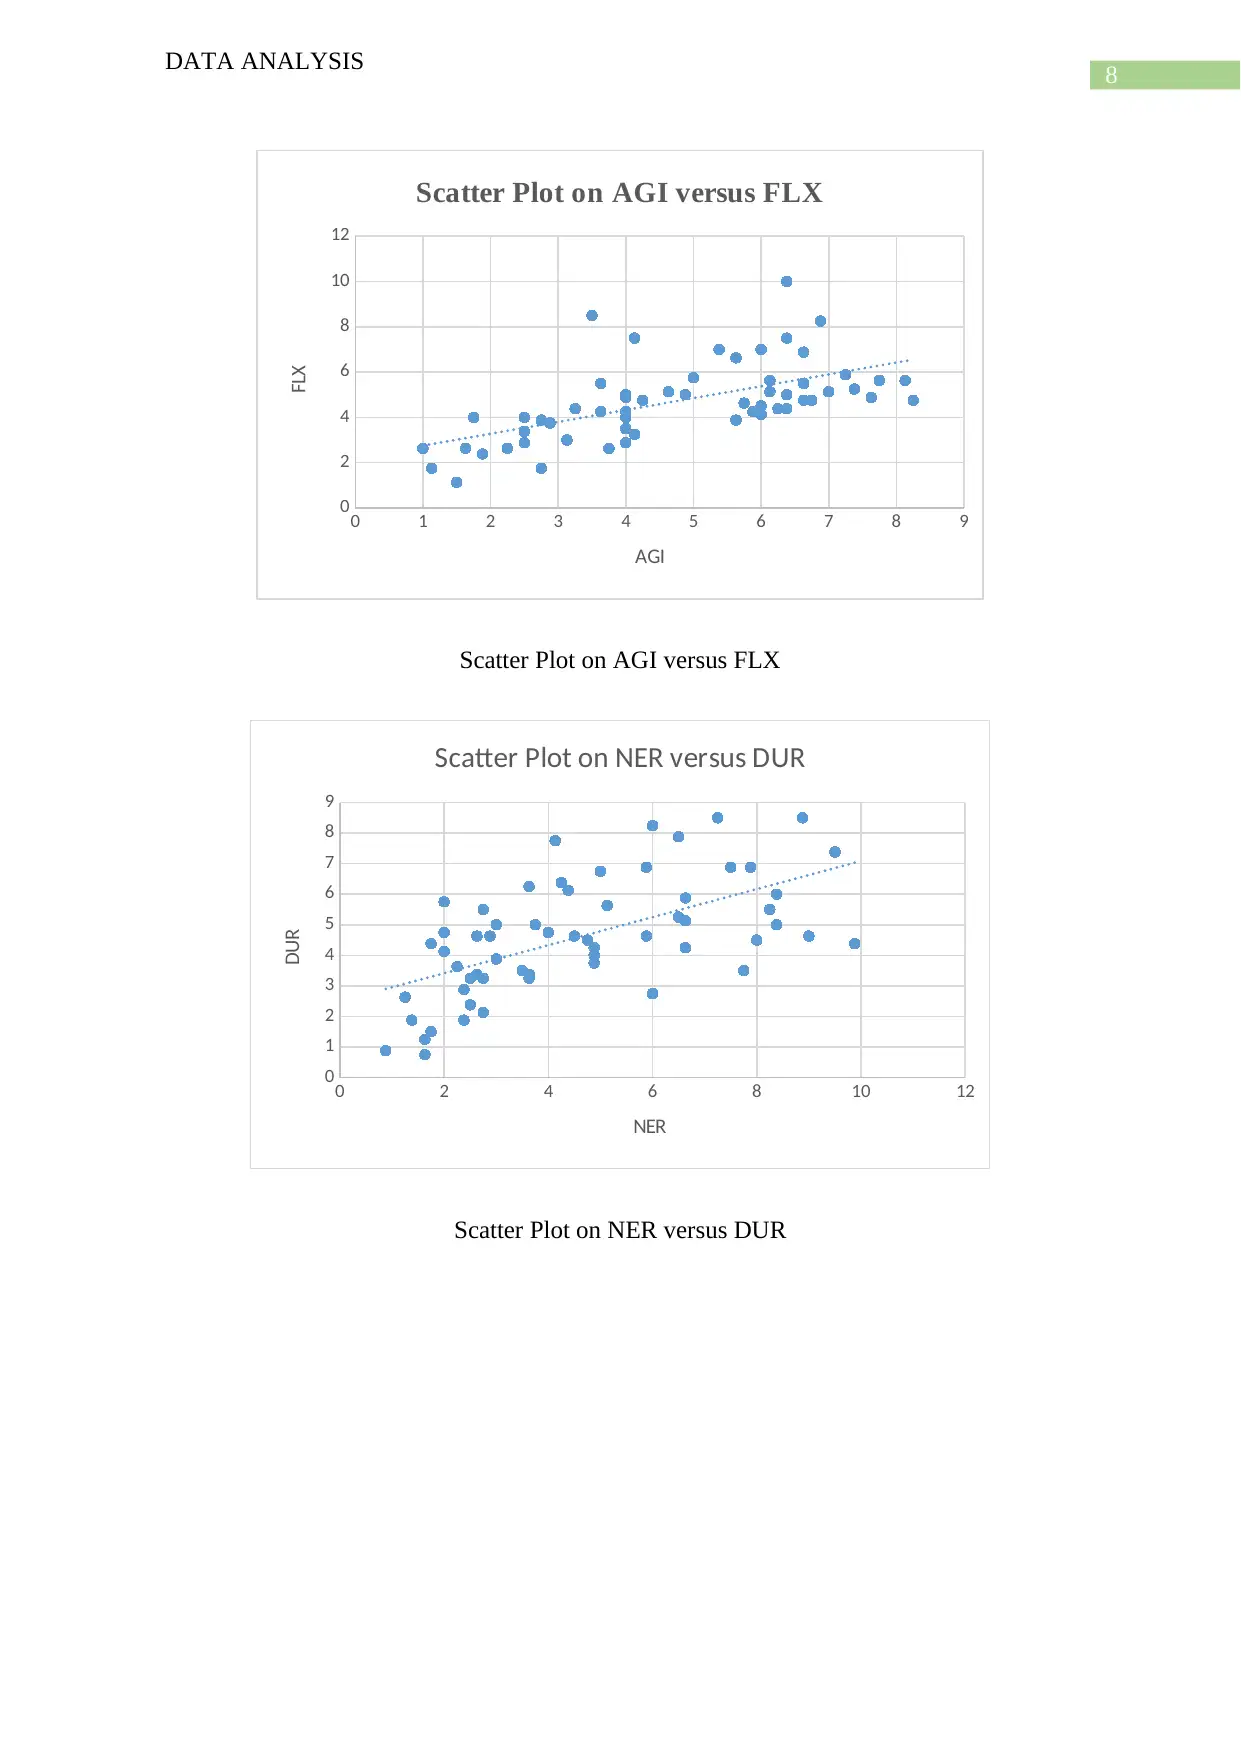
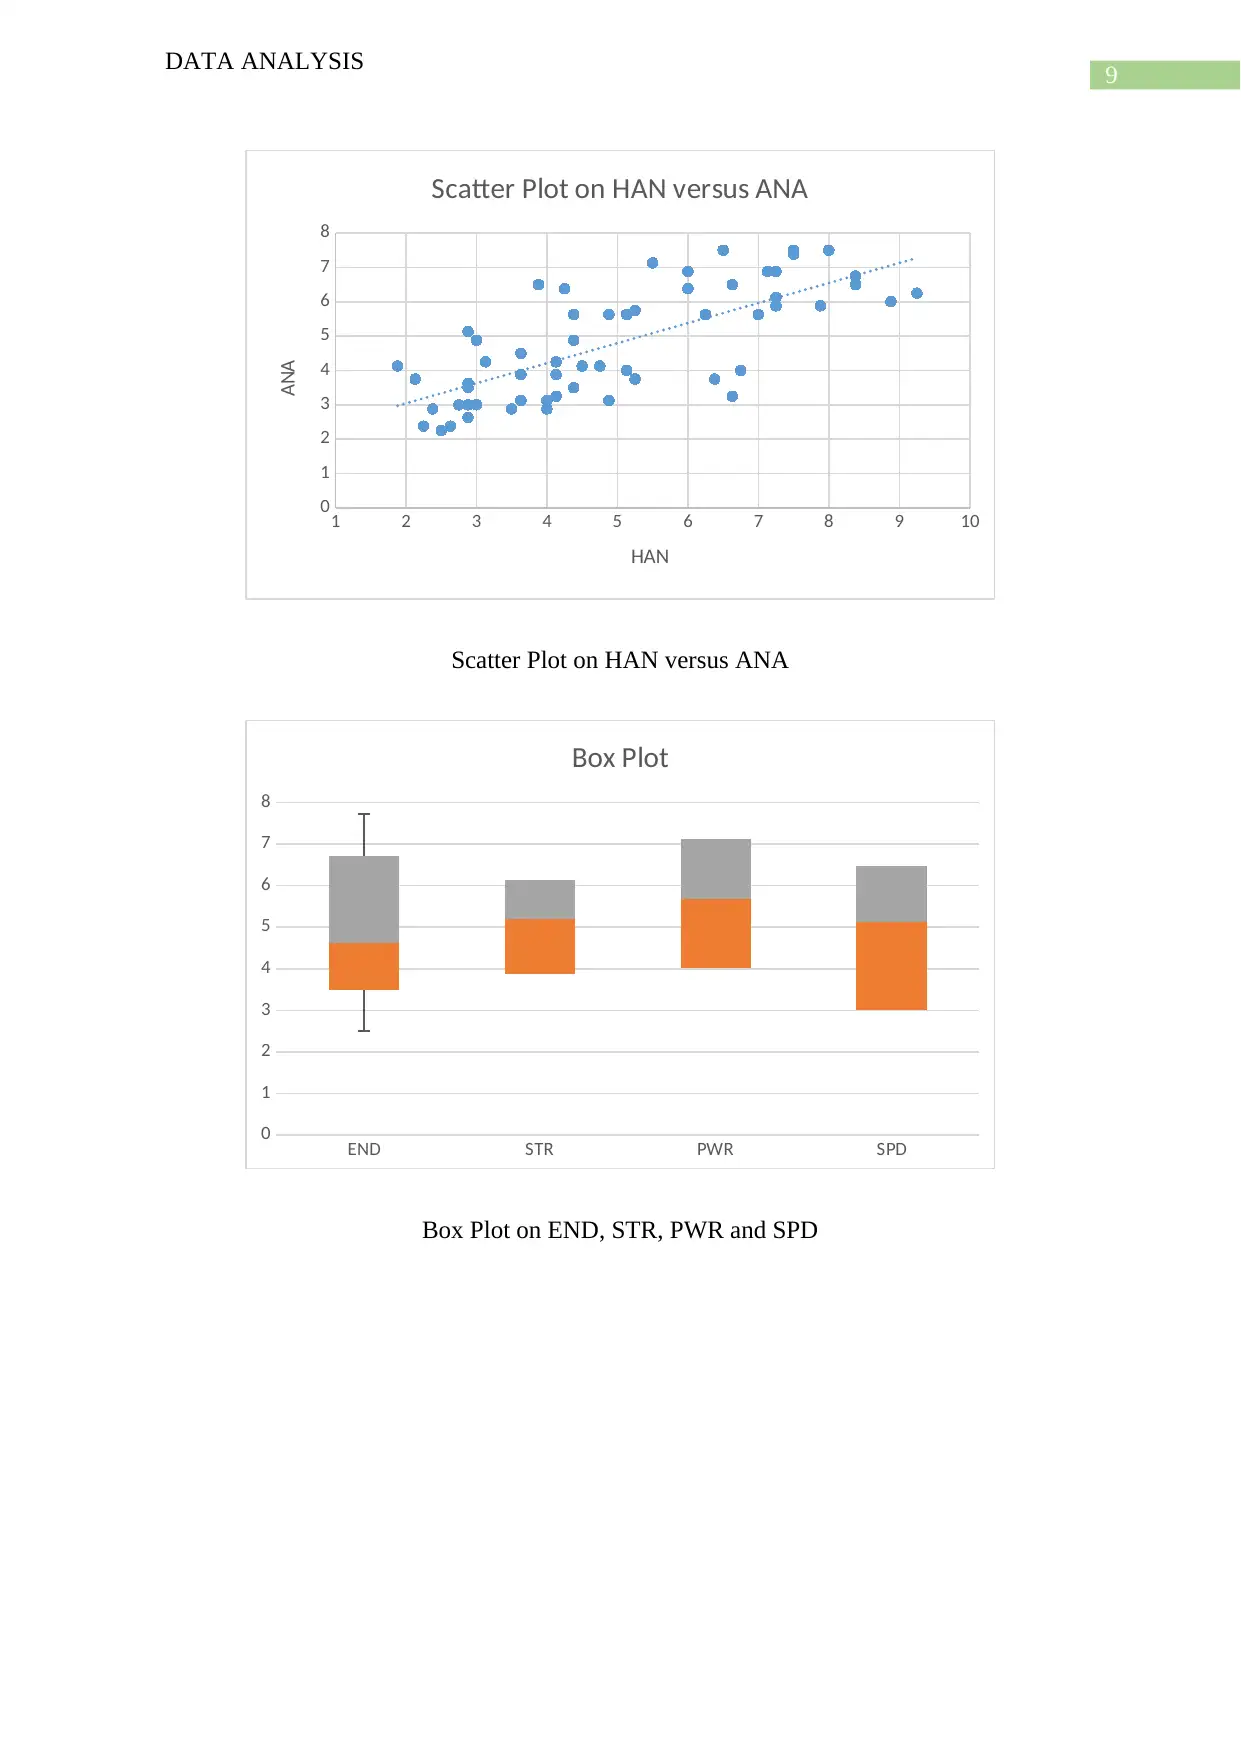
This report presents a comprehensive data analysis of a project ranking the toughest sports based on various skill categories. The analysis begins with a data cleaning procedure to address inaccurate or corrupt data, followed by an examination of data consistency and the use of a data dictionary. The report then delves into descriptive statistics for ten quantitative variables across sixty observations, including mean, median, mode, variance, standard deviation, and range. Histograms, scatter plots, and box plots are used to visualize the data and identify relationships between variables, such as the positive correlation between AGI and FLX. The report also discusses the skewness of different variables. The analysis employs multiple regression analysis to determine the degree of difficulty for each sport. The project aims to rank sports from 1st to 60th based on their demands on athletic skills, providing a detailed methodology and results, along with relevant references.

Running head: DATA ANALYSIS
Data Analysis
Name of the Student:
Name of the University:
Author note:
Data Analysis
Name of the Student:
Name of the University:
Author note:
Paraphrase This Document
Need a fresh take? Get an instant paraphrase of this document with our AI Paraphraser

1
DATA ANALYSIS
Data Cleaning Procedure
The data cleaning is a procedure which detect and remove the corrupt or inaccurate
data or records from a data set. The cleaning is a procedure which is modify the data. This
process may be performed with help of data wrangling tools or the procedure of batch
(Chalamalla et al., 2014).
When the data set is clean then the next step is cheek about the consistency of the
data. An inconsistent data always have error and missing. This is happen due to user’s error,
corruption in transmission of storage. In that situation the other important thing is data
dictionary. Data cleaning may be differs from data validation. The data validation define the
invariability of data (Chu & Ilyas, 2016).
A proper process of data cleaning involves in the deleting the typographical error.
There some data cleaning procedure or solution has been done with the help of cross
checking with valid data. In general the cleaning procedure the enhancement, in which data
can be converted by adding some related information. It is also related to harmonization of
data. There are steps which involve in the data cleaning process. These are monitor error,
standardize the process, and validate the accuracy, scrub for duplicity of data and analyse
(Prokoshyna et al., 2015).
In monitor errors record and show the trend of data. In this case most of the data has
been seen. It is also help to detect the corrupt data. In this study there is no missing data. But
some values is zero.
In standardization the most important point is cheek the data at the time of entry. It
helps to produce a good data and reduce the risk of duplication (Chu, Krishnan & Wang,
2016)

2
DATA ANALYSIS
In accuracy clean the existing data. In research the data tool are allow to clean the
data. In this study all the variable are valid.
Identification of duplicate of data helps to save time of analysis. There are different
data cleaning tools which avoid the duplication.
In excel with the help of special tool function the missing data can be identified.
There is also another way to clean the data is that go to conditional formatting in highlight
cell rules use duplicate values identify duplication. After that go to data and remove
duplicate, identify and remove the duplication. In this problem there is no duplicate value is
found.
Data Analysis
In this study all the variables are quantitative variable. There are 10 variables has been
conducted in this study. There is no missing observation has been seen among all the
variables. There is a sample of 60 observations has been taken in this study. In the summary
statistics of END it has been seen that the mean, median and mode of END is 5.08, 4.63, and
4.63. It has been seen that the mean value of END is higher than the median. Hence the END
sports data is positively skewed. The variance, standard deviation and range is 4.38, 2.09 and
8.63. The mean, median and mode of STR is 5.169, 5.19 and 5.13. Since mean is larger than
the median. Hence the STR is positively skewed. In case of PWR, SPD and AGI the mean
value is smaller than the median. Hence their skewness is negative. Similarly for FLX, NER,
DUR, HAN and ANA the mean value is higher than the median. Hence their skewness is
positive. The variance, standard deviation and range among all the variables has been
calculated and which has been shown in the excel file or appendices.
⊘ This is a preview!⊘
Do you want full access?
Subscribe today to unlock all pages.

Trusted by 1+ million students worldwide

3
DATA ANALYSIS
There are some histogram has been constructed. In this histogram the X-axis represent
the class and the Y-axis represent the frequency. Most of the histogram shows about
normality of data. There some histogram is skewed and some of normal.
In the section of scatter plot shows the relationship between two variables at a time.
All the scatter plot shows that there is a positive relationship between these variables. It is
positive because the data points are close to the trend line. In the scatter plot section the
relationship AGI and FLX, NER and DUR and HAN and ANA has been illustrated.
The box plot shows that the outliers are exist or not in this data set. It has been seen
that there is no outliers. There some box symmetric and some of positively or negatively
skewed.
Paraphrase This Document
Need a fresh take? Get an instant paraphrase of this document with our AI Paraphraser

4
DATA ANALYSIS
References and Bibliography
Bedeian, A. G. (2014). “More than meets the eye”: A guide to interpreting the descriptive
statistics and correlation matrices reported in management research. Academy of
Management Learning & Education, 13(1), 121-135.
Chalamalla, A., Ilyas, I. F., Ouzzani, M., & Papotti, P. (2014, June). Descriptive and
prescriptive data cleaning. In Proceedings of the 2014 ACM SIGMOD international
conference on Management of data (pp. 445-456).
Chu, X., & Ilyas, I. F. (2016). Qualitative data cleaning. Proceedings of the VLDB
Endowment, 9(13), 1605-1608.
Chu, X., Ilyas, I. F., Krishnan, S., & Wang, J. (2016, June). Data cleaning: Overview and
emerging challenges. In Proceedings of the 2016 International Conference on
Management of Data (pp. 2201-2206).
Ho, A. D., & Yu, C. C. (2015). Descriptive statistics for modern test score distributions:
Skewness, kurtosis, discreteness, and ceiling effects. Educational and Psychological
Measurement, 75(3), 365-388.
Prokoshyna, N., Szlichta, J., Chiang, F., Miller, R. J., & Srivastava, D. (2015). Combining
quantitative and logical data cleaning. Proceedings of the VLDB Endowment, 9(4),
300-311.

5
DATA ANALYSIS
Volkovs, M., Chiang, F., Szlichta, J., & Miller, R. J. (2014, March). Continuous data
cleaning. In 2014 IEEE 30th International Conference on Data Engineering (pp. 244-
255). IEEE.
Appendices
Summary Statistics
DATA ANALYSIS
Volkovs, M., Chiang, F., Szlichta, J., & Miller, R. J. (2014, March). Continuous data
cleaning. In 2014 IEEE 30th International Conference on Data Engineering (pp. 244-
255). IEEE.
Appendices
Summary Statistics
⊘ This is a preview!⊘
Do you want full access?
Subscribe today to unlock all pages.

Trusted by 1+ million students worldwide

6
DATA ANALYSIS
0 to2 2 to 4 4 to 6 6 to 8 8 to 10
0
5
10
15
20
25
Histogram for END
Class
Frequency
Histogram for END
0 to2 2 to 4 4 to 6 6 to 8 8 to 10
0
5
10
15
20
25
30
Histogram for STR
Class
Frequency
Histogram for STR
DATA ANALYSIS
0 to2 2 to 4 4 to 6 6 to 8 8 to 10
0
5
10
15
20
25
Histogram for END
Class
Frequency
Histogram for END
0 to2 2 to 4 4 to 6 6 to 8 8 to 10
0
5
10
15
20
25
30
Histogram for STR
Class
Frequency
Histogram for STR
Paraphrase This Document
Need a fresh take? Get an instant paraphrase of this document with our AI Paraphraser

7
DATA ANALYSIS
0 to2 2 to 4 4 to 6 6 to 8 8 to 10
0
5
10
15
20
25
Histogram for PWR
Class
Frequency
Histogram for PWR
0 to2 2 to 4 4 to 6 6 to 8 8 to 10
0
5
10
15
20
25
Histogram for SPD
Class
Frequency
Histogram for SPD
DATA ANALYSIS
0 to2 2 to 4 4 to 6 6 to 8 8 to 10
0
5
10
15
20
25
Histogram for PWR
Class
Frequency
Histogram for PWR
0 to2 2 to 4 4 to 6 6 to 8 8 to 10
0
5
10
15
20
25
Histogram for SPD
Class
Frequency
Histogram for SPD

8
DATA ANALYSIS
0 1 2 3 4 5 6 7 8 9
0
2
4
6
8
10
12
Scatter Plot on AGI versus FLX
AGI
FLX
Scatter Plot on AGI versus FLX
0 2 4 6 8 10 12
0
1
2
3
4
5
6
7
8
9
Scatter Plot on NER versus DUR
NER
DUR
Scatter Plot on NER versus DUR
DATA ANALYSIS
0 1 2 3 4 5 6 7 8 9
0
2
4
6
8
10
12
Scatter Plot on AGI versus FLX
AGI
FLX
Scatter Plot on AGI versus FLX
0 2 4 6 8 10 12
0
1
2
3
4
5
6
7
8
9
Scatter Plot on NER versus DUR
NER
DUR
Scatter Plot on NER versus DUR
⊘ This is a preview!⊘
Do you want full access?
Subscribe today to unlock all pages.

Trusted by 1+ million students worldwide

9
DATA ANALYSIS
1 2 3 4 5 6 7 8 9 10
0
1
2
3
4
5
6
7
8
Scatter Plot on HAN versus ANA
HAN
ANA
Scatter Plot on HAN versus ANA
END STR PWR SPD
0
1
2
3
4
5
6
7
8
Box Plot
Box Plot on END, STR, PWR and SPD
DATA ANALYSIS
1 2 3 4 5 6 7 8 9 10
0
1
2
3
4
5
6
7
8
Scatter Plot on HAN versus ANA
HAN
ANA
Scatter Plot on HAN versus ANA
END STR PWR SPD
0
1
2
3
4
5
6
7
8
Box Plot
Box Plot on END, STR, PWR and SPD
Paraphrase This Document
Need a fresh take? Get an instant paraphrase of this document with our AI Paraphraser

10
DATA ANALYSIS
DATA ANALYSIS
1 out of 11
Related Documents
Your All-in-One AI-Powered Toolkit for Academic Success.
+13062052269
info@desklib.com
Available 24*7 on WhatsApp / Email
Unlock your academic potential
Copyright © 2020–2025 A2Z Services. All Rights Reserved. Developed and managed by ZUCOL.


