Assessment 2: Blue Inc. Business Analysis and Spreadsheet Report
VerifiedAdded on 2021/01/15
|9
|1610
|112
Report
AI Summary
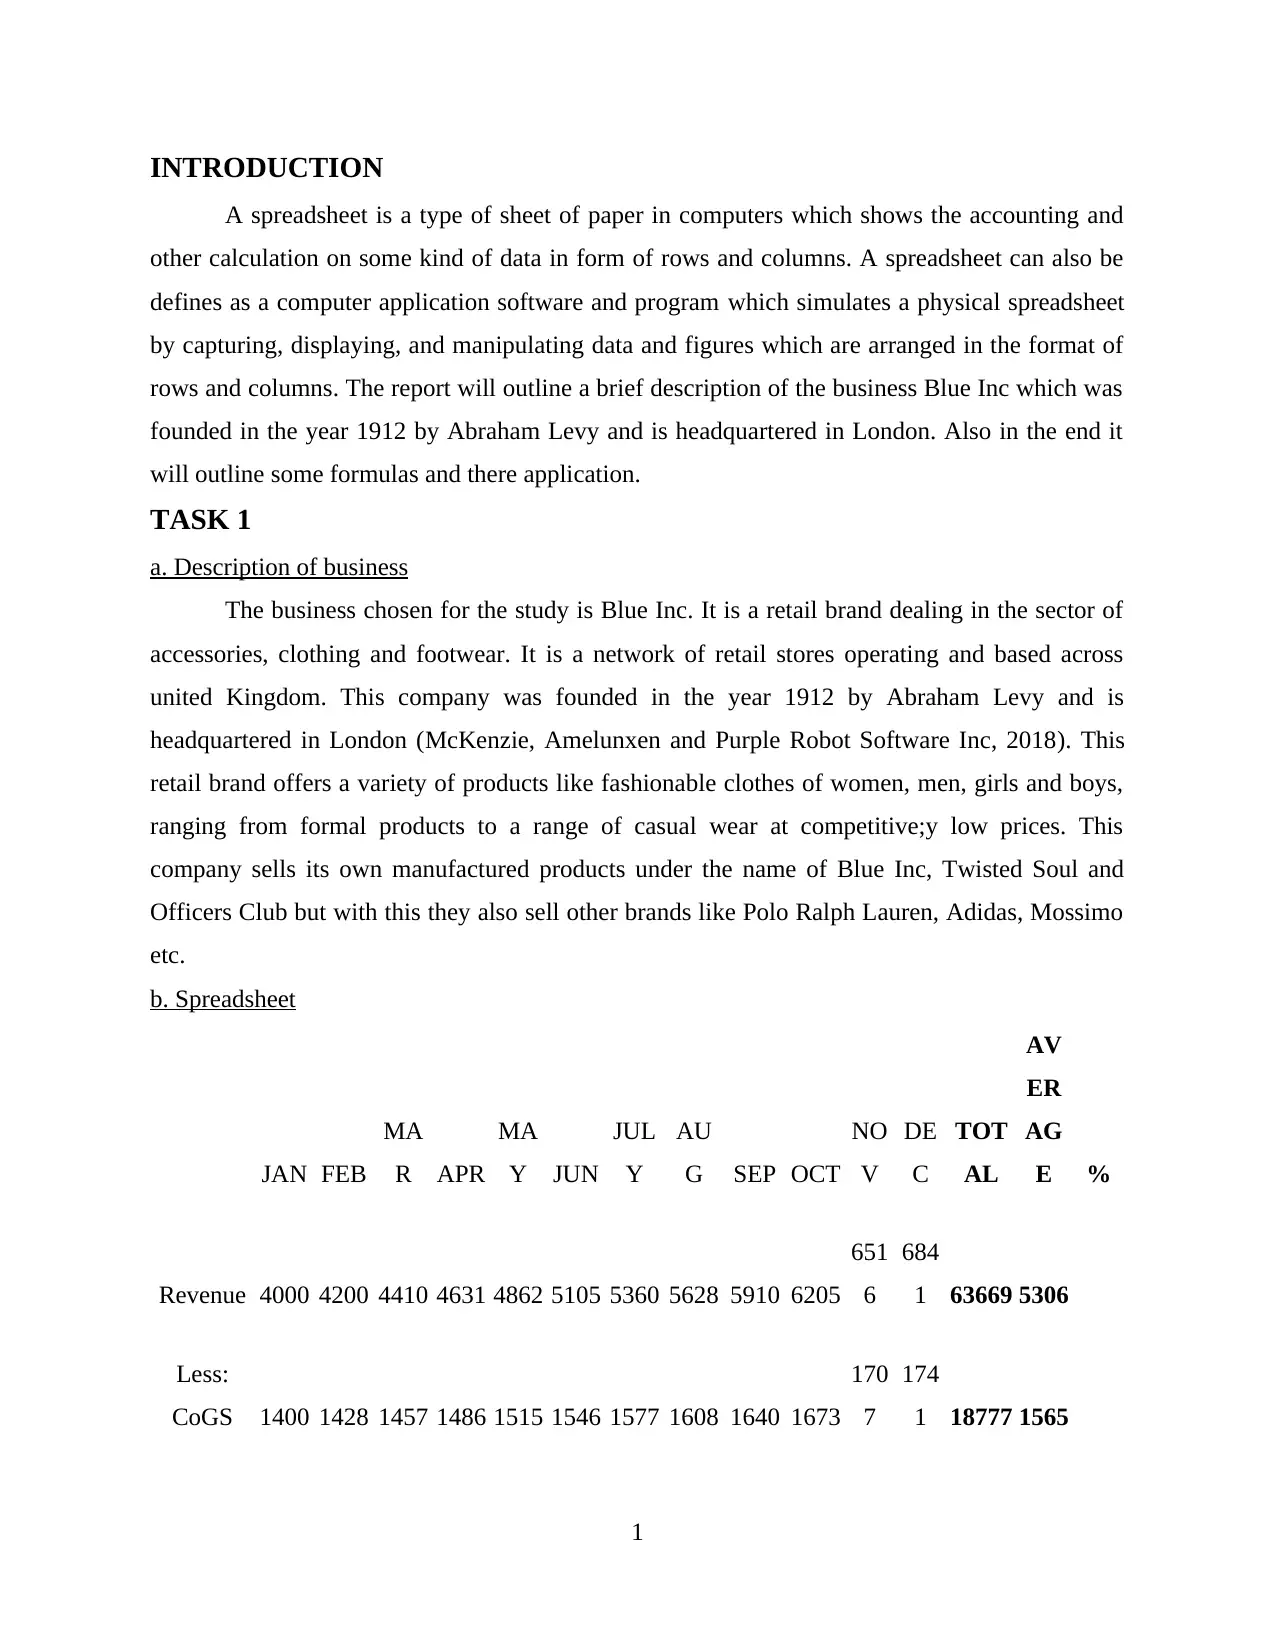
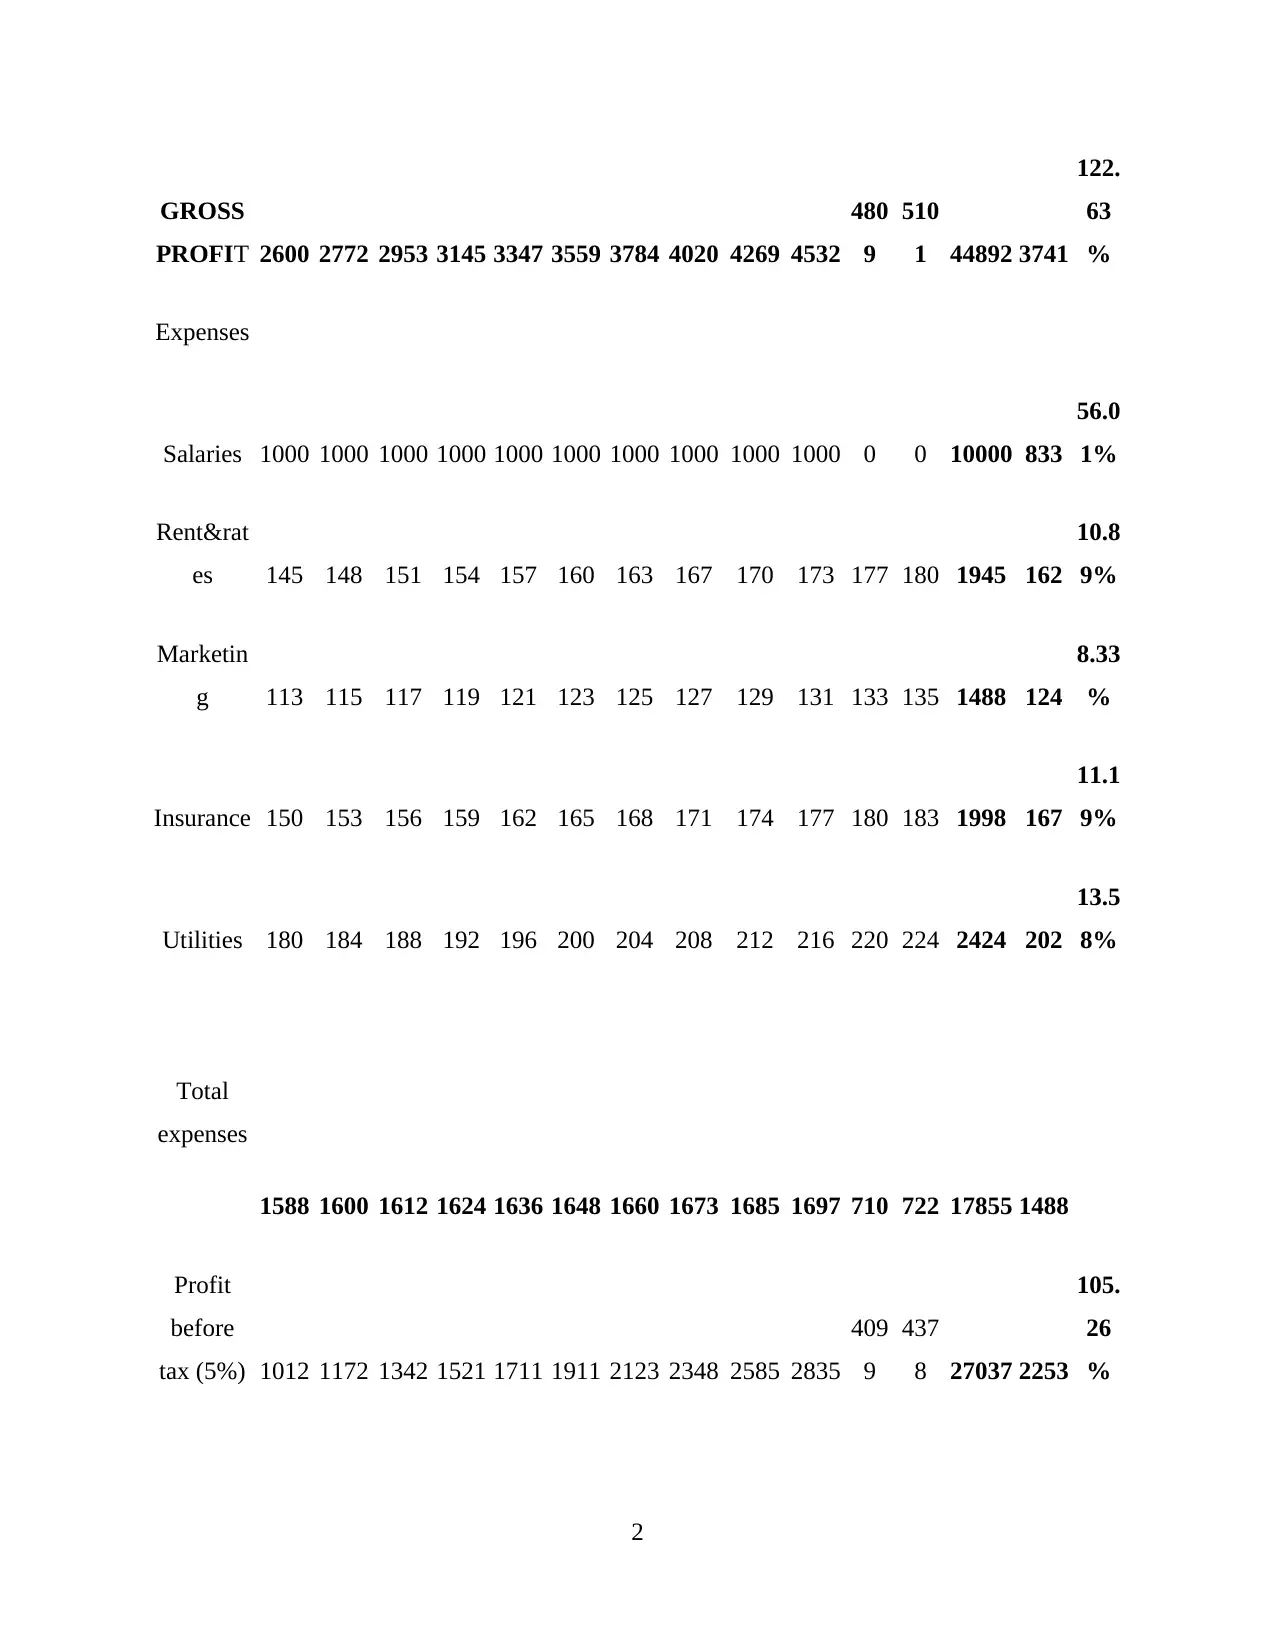
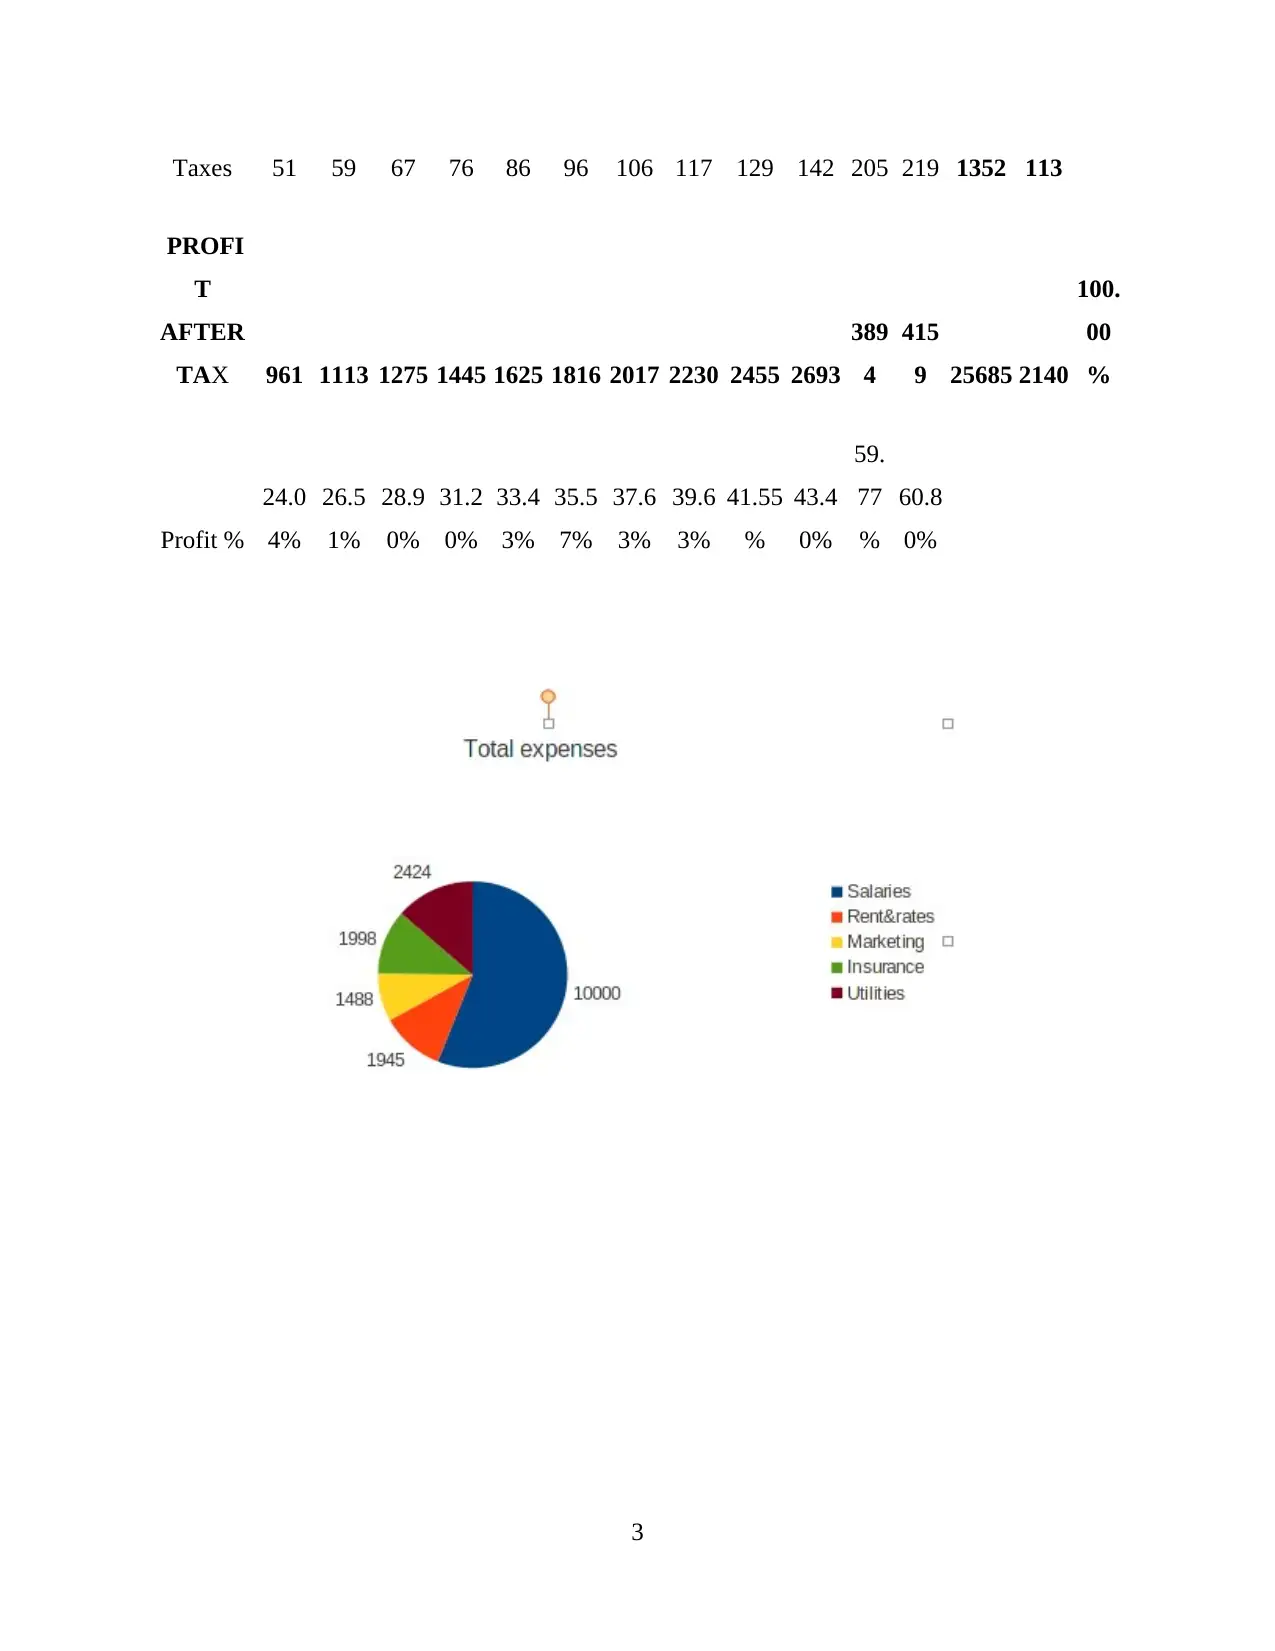
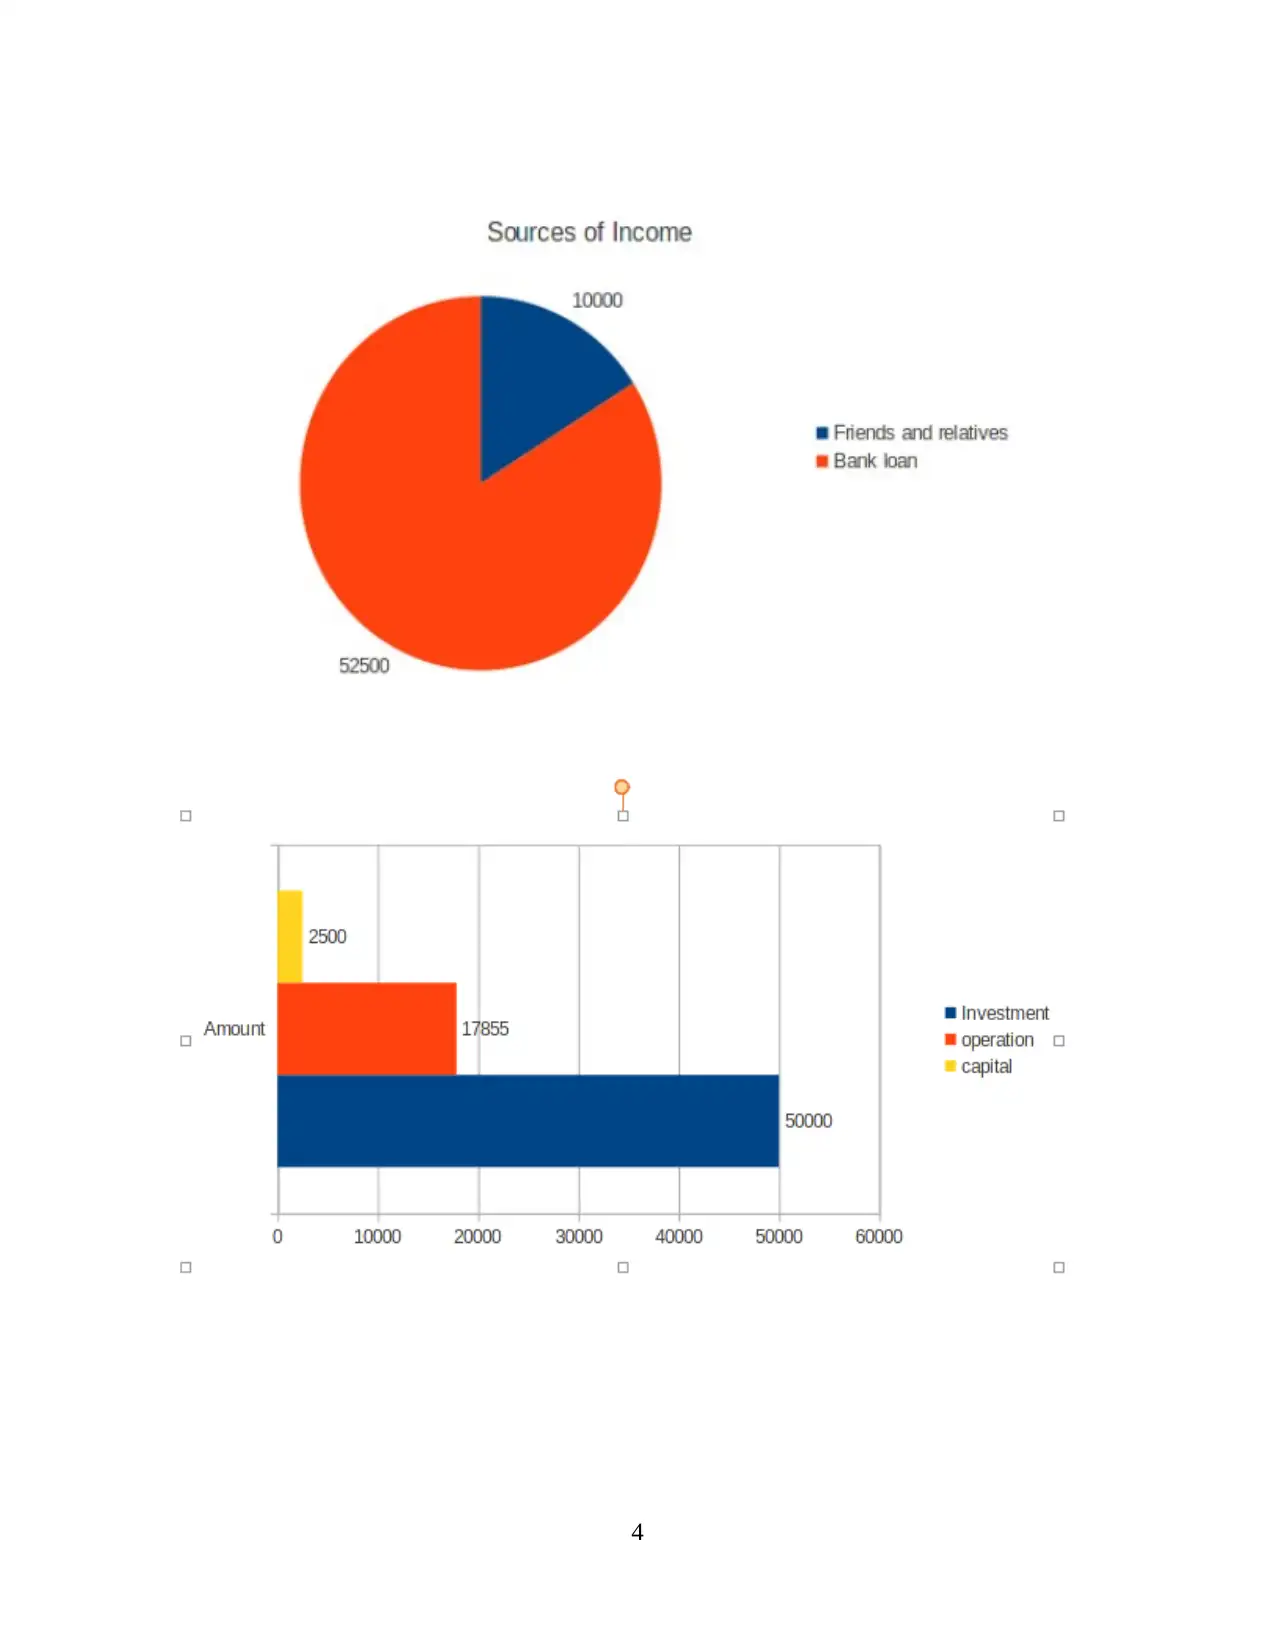
This report provides a comprehensive analysis of Blue Inc., a retail brand operating in the United Kingdom. The report begins with a description of Blue Inc., including its founding, headquarters, and product offerings. The core of the report focuses on a detailed spreadsheet analysis of the company's financial data, including revenue, cost of goods sold, gross profit, expenses (salaries, rent, marketing, insurance, utilities), profit before tax, taxes, and profit after tax. The spreadsheet data spans from January to December, providing a monthly and annual overview. The report also includes an interpretation of the spreadsheet, explaining how the data is organized, stored, and analyzed using formulas such as auto-sum, percentage, and average calculations. It highlights the importance of formulas in making calculations easy and accurate, and in determining relationships between different values within the spreadsheet. The report concludes by emphasizing the crucial role of spreadsheets in business calculations and decision-making, referencing relevant academic sources to support its findings.

1 out of 9

Your All-in-One AI-Powered Toolkit for Academic Success.
+13062052269
info@desklib.com
Available 24*7 on WhatsApp / Email
![[object Object]](/_next/static/media/star-bottom.7253800d.svg)
Copyright © 2020–2026 A2Z Services. All Rights Reserved. Developed and managed by ZUCOL.