Analysis of Complex Pendulums Using Parametric Equations and Graphs

Verified

Added on  2022/09/06

|17
|417
|18
Project
AI Summary
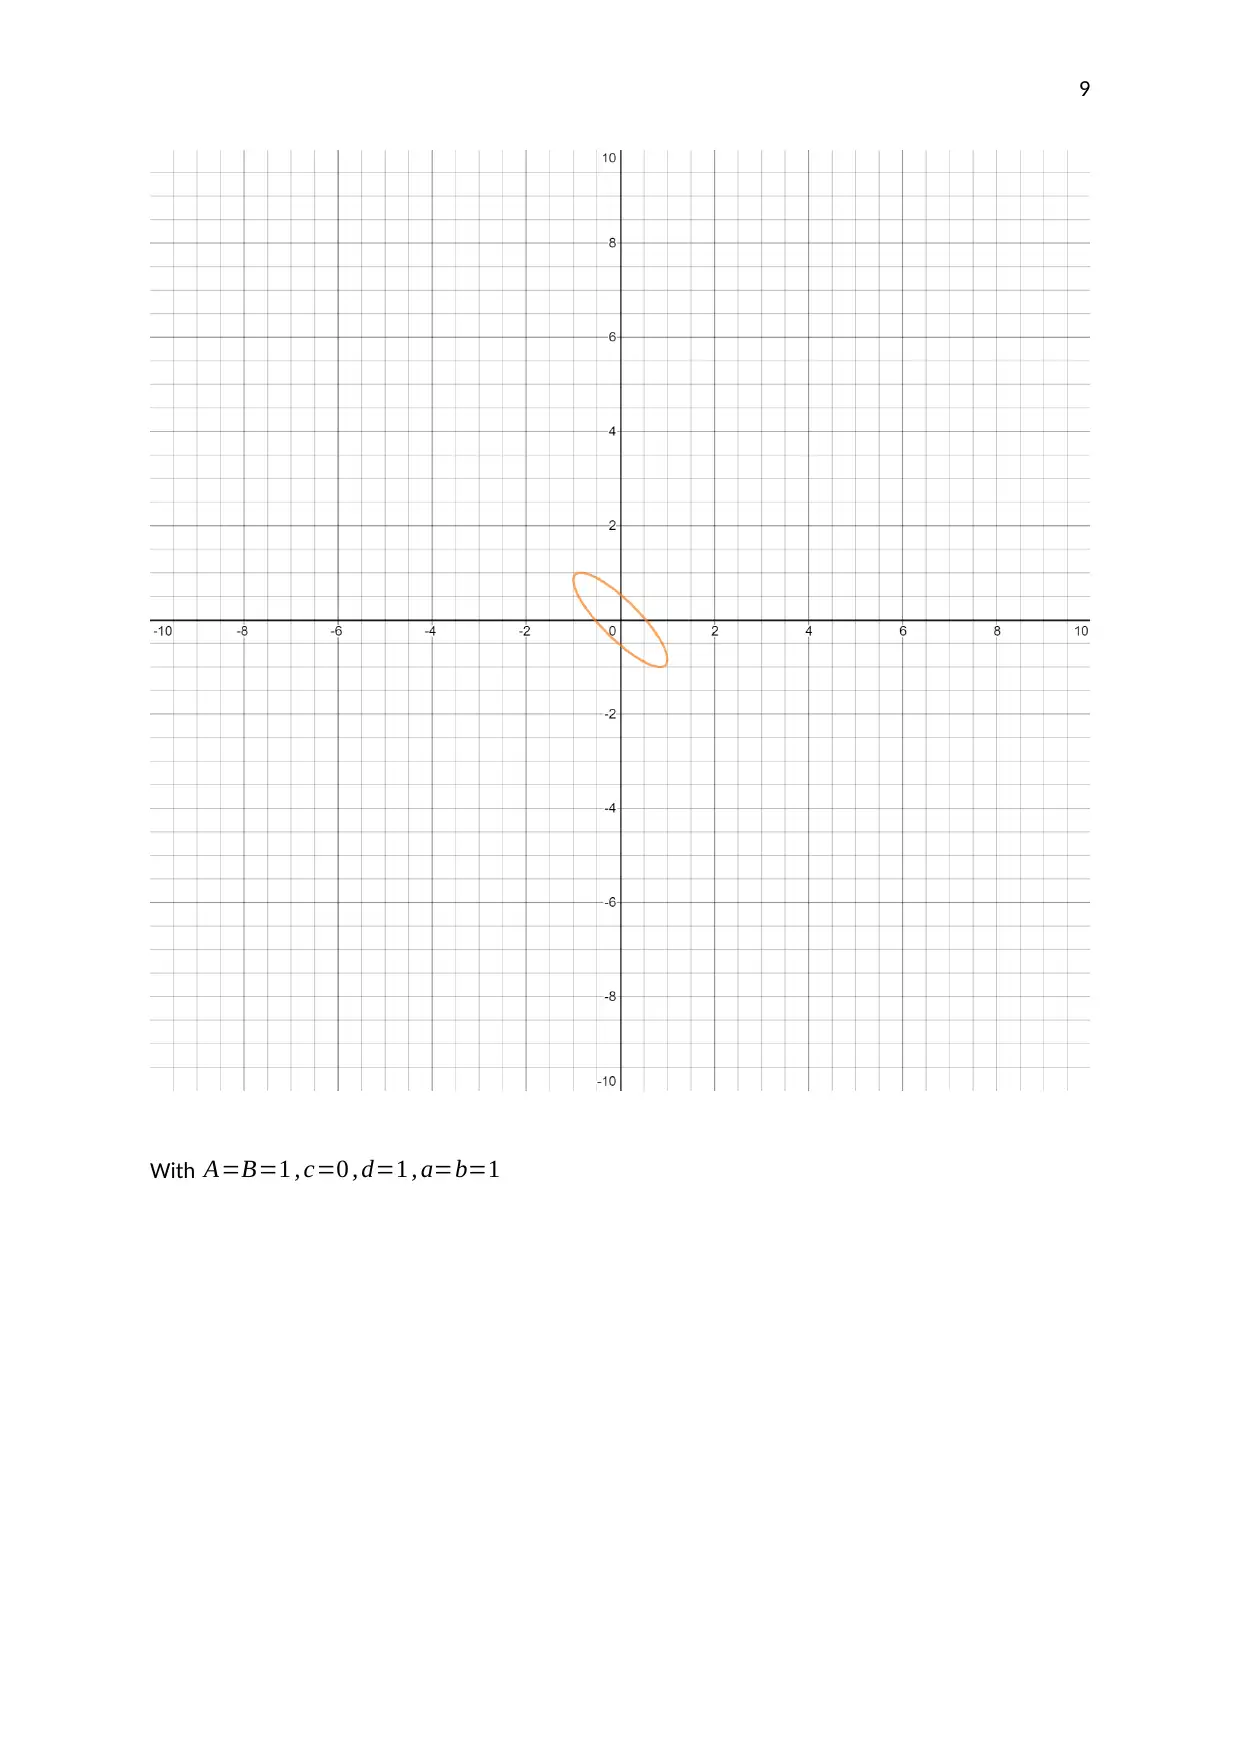
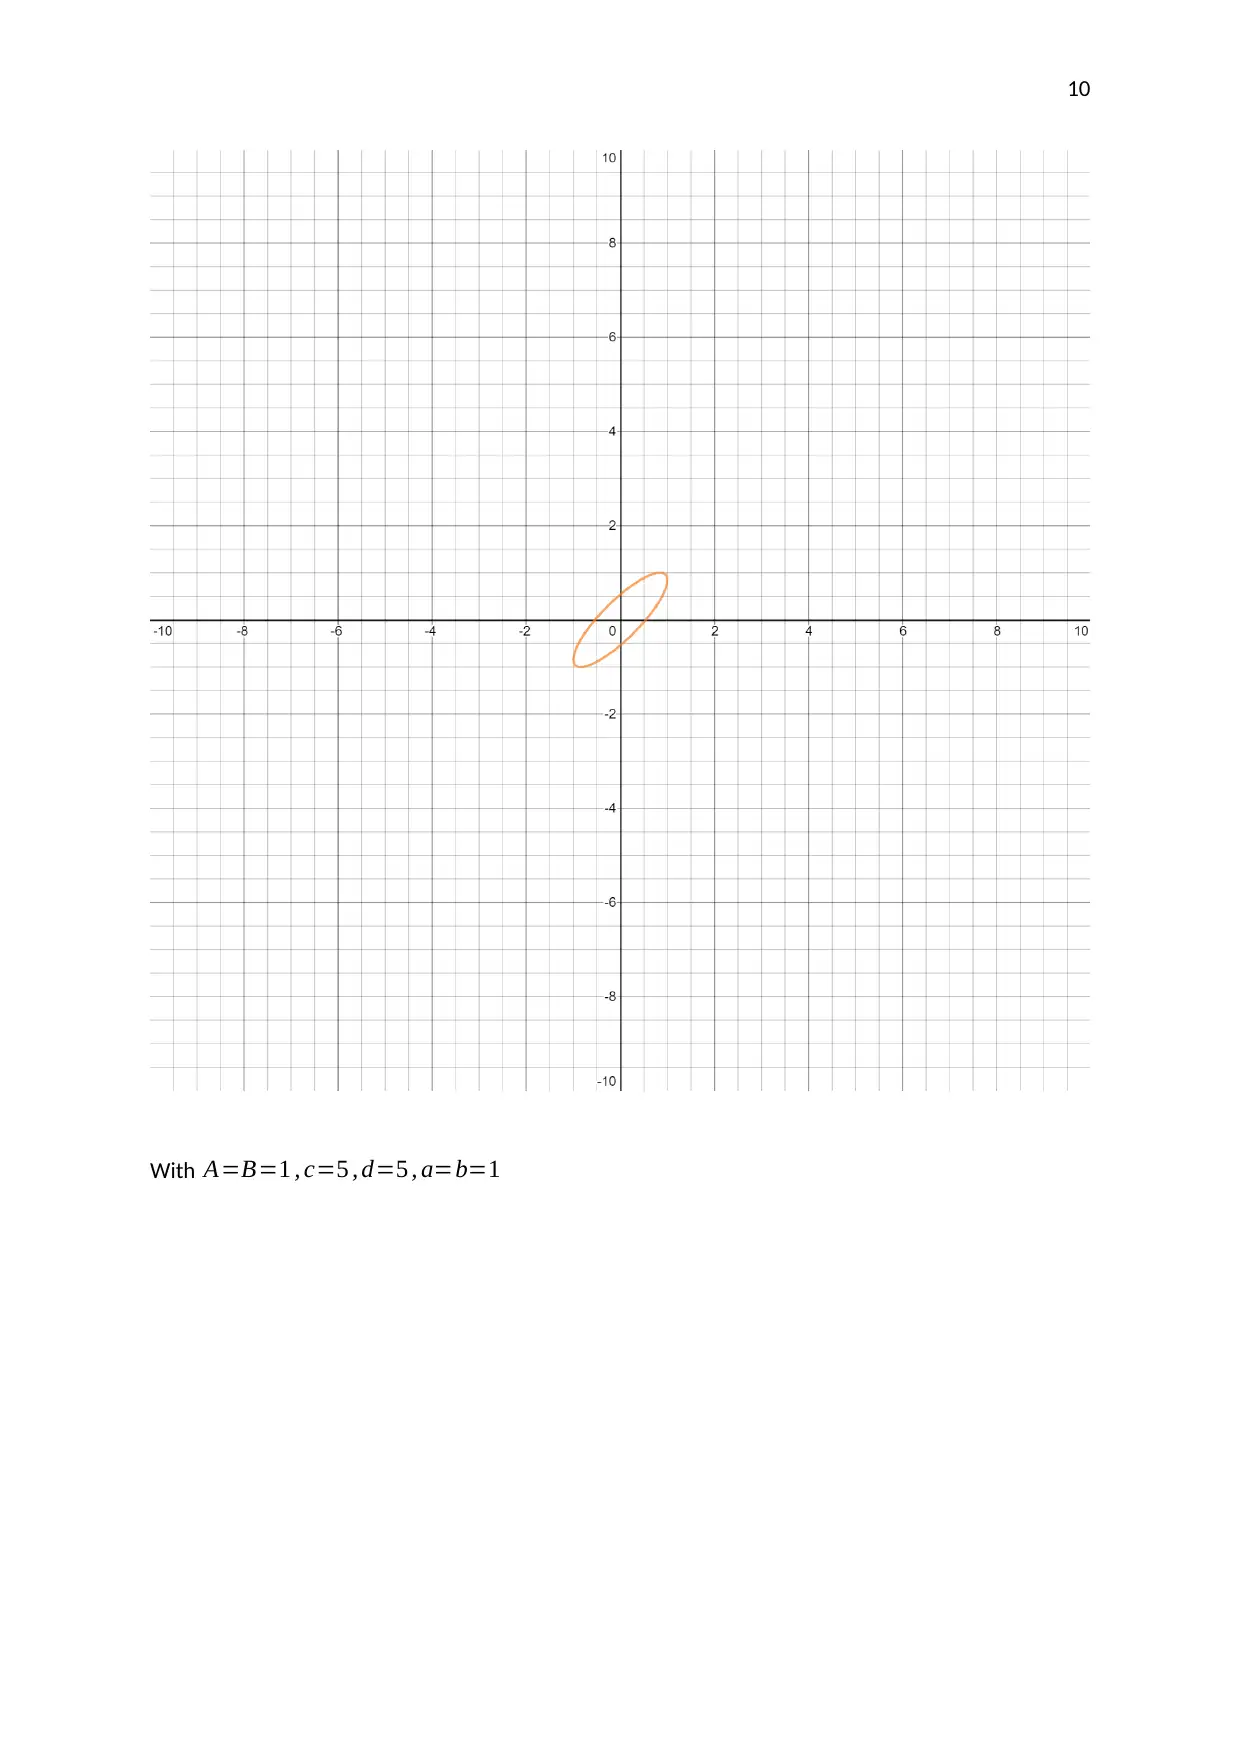
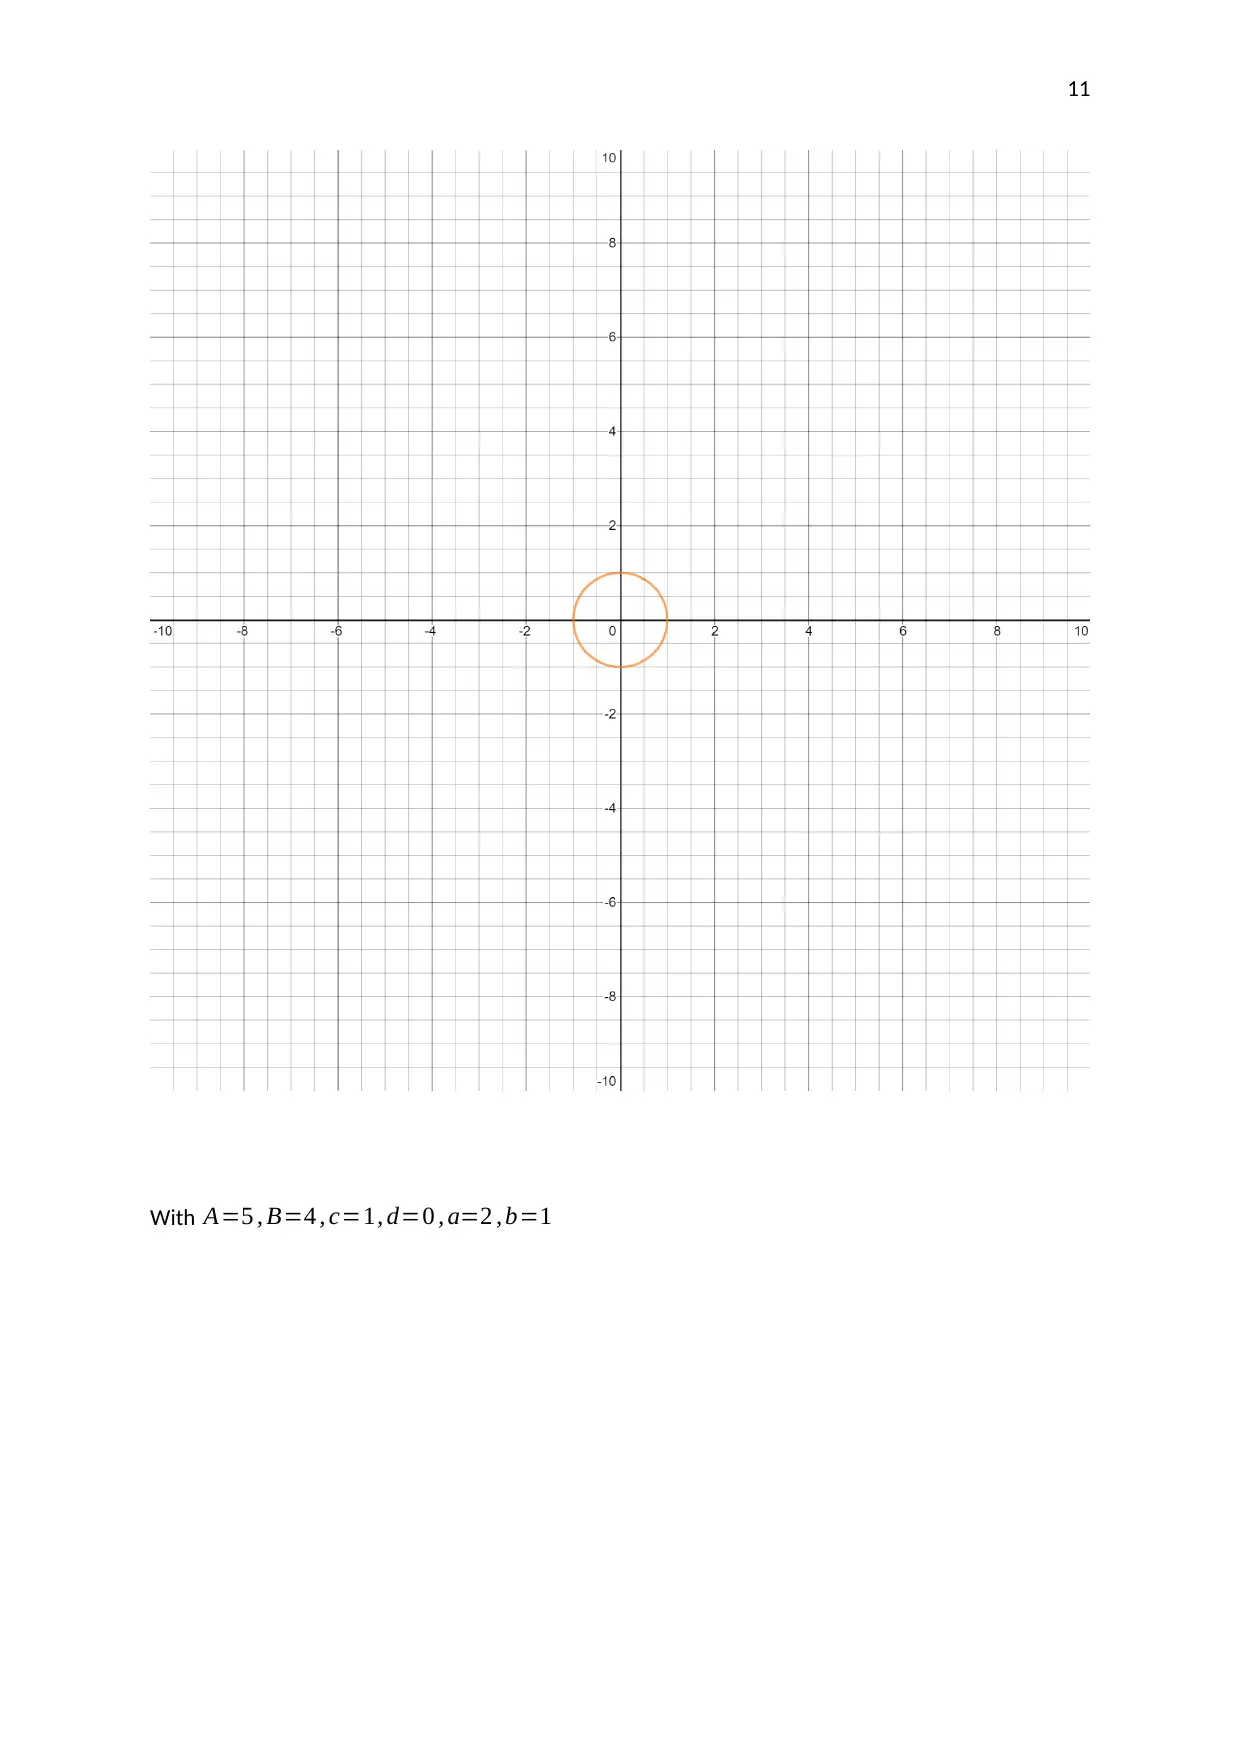
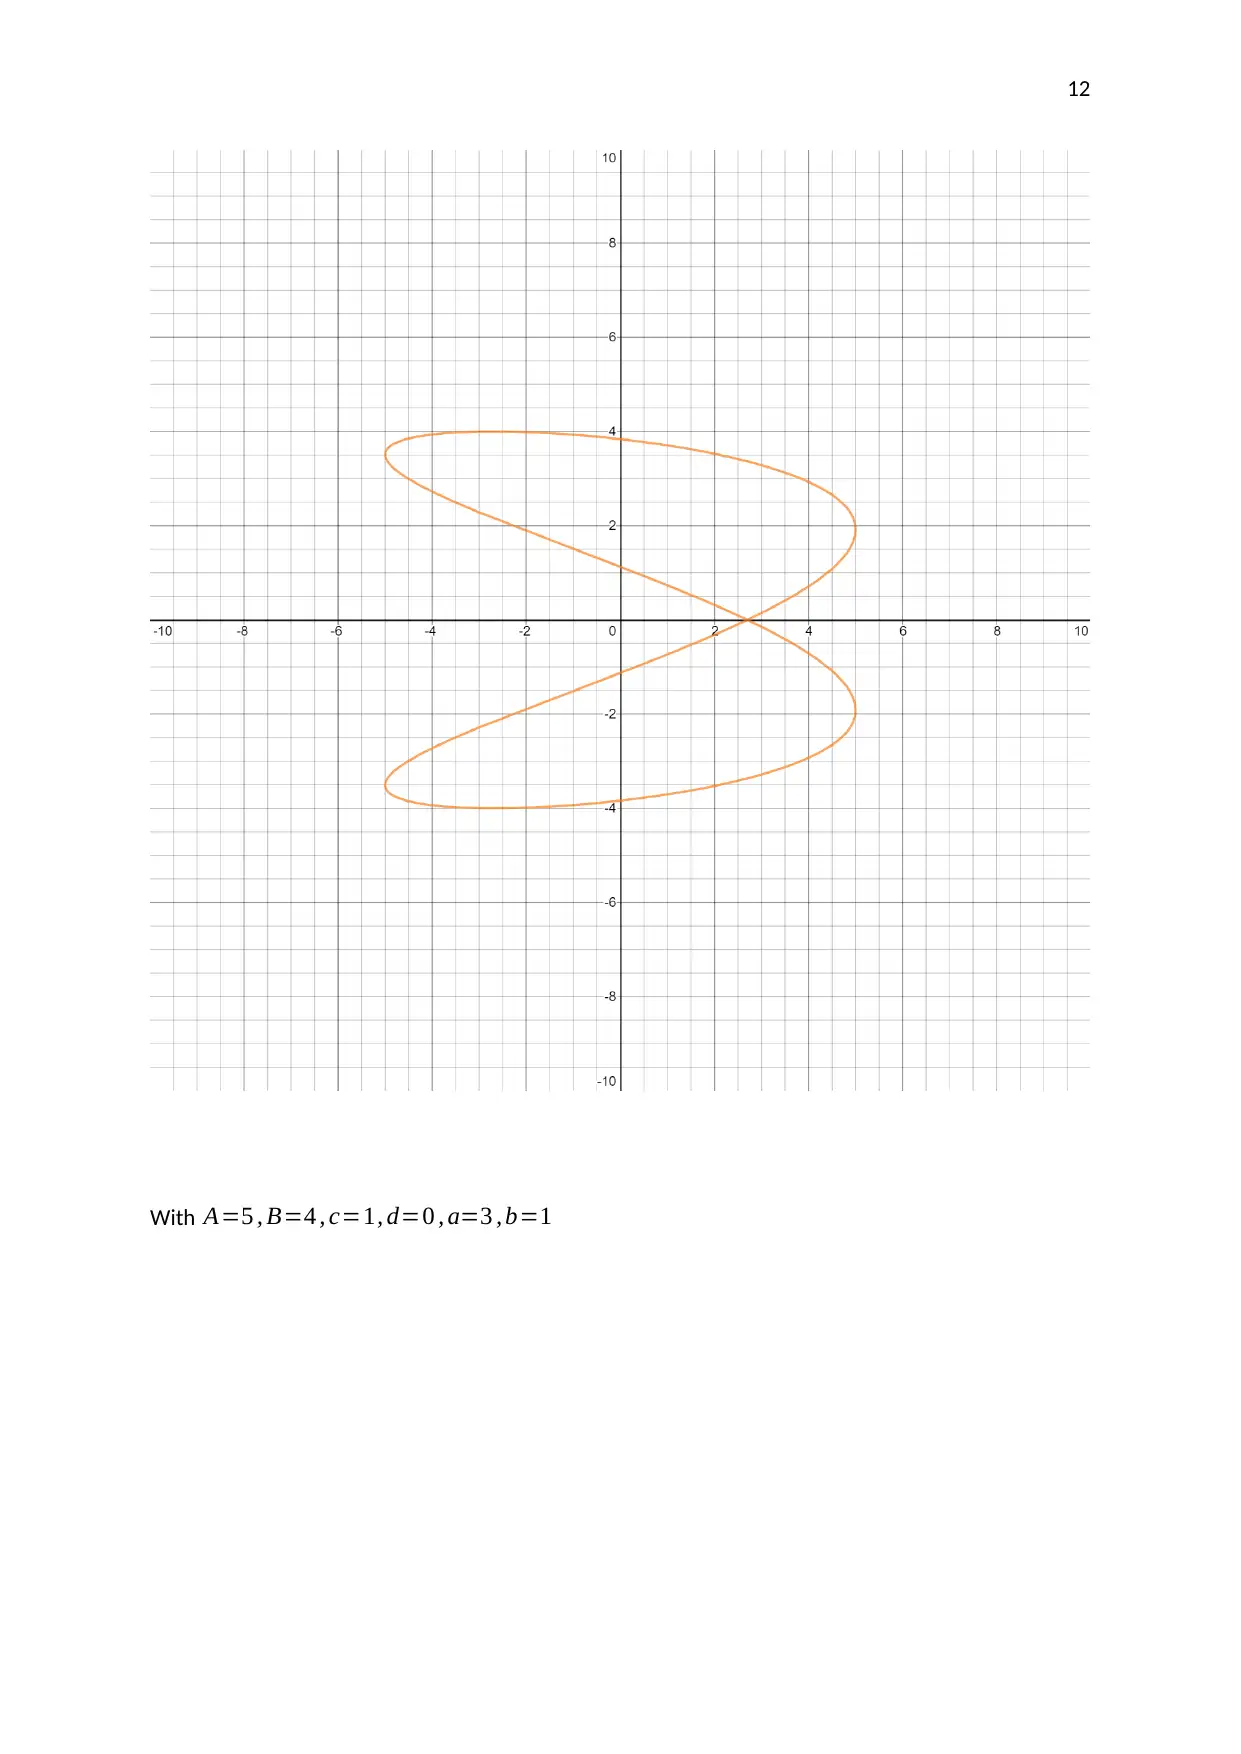
This assignment investigates the motion of a pendulum moving in two directions. The student analyzes parametric equations and graphs to understand the pendulum's movement. The assignment involves using graphing technology to plot the given parametric equations, selecting and explaining the coordinates of points on the graph, and finding the corresponding Cartesian equation. The student explores how the parameters in the equations affect the graph, including the amplitudes, frequencies, and phase shifts. The analysis includes a discussion of Lissajous figures and their relation to the parametric equations. The student uses the parametric equations to generate a graph, selects critical points, and explains how their coordinates are derived. The Cartesian equation for the graph is also derived and verified. The assignment concludes with an analysis of how different parameters affect the shape and characteristics of the plotted graphs.
Document Page
1
Investigating Complex Pendulums
Student’s Name
Institutional Affiliation
Date
tabler-icon-diamond-filled.svg

Paraphrase This Document

Need a fresh take? Get an instant paraphrase of this document with our AI Paraphraser
Document Page
2
Aim
To explore the motion of a pendulum moving in two directions.
Method
a)
i)
x=cos 2t
y=sint
Document Page
3
i)
We choose the following points,
( 1,0 ) , ( 0,1 ) , ( 0,0.71 ) , ( 0 ,0.71 ) , ( 1 ,1 ) , ( 1,1 ) , ( 0.5,0 .5 ) ,(0.5 ,0.5)
These coordinates can be obtained by substituting the various values of t in the given parametric
equations,
For example consider point ( 1,0 )
For this point, x=1 , y=0. Therefore from x=cos 2t,
cos 2 t=1
2 t=cos1 1=0
t=0
Also,
sint=0
t=sin1 0=0
Therefore, by substituting the values of t in the given range of 0 t 2 π in the given parametric
equations for x and y, the coordinates on the graph can be obtained.
ii)
The given parametric equations are,
x=cos 2t
y=sint
Squaring both sides of y we have,
y2=sin2 t
We also know that cos 2 t can be written as,
cos 2 t=12 sin2 t
But cos 2 t=x
x=12sin2 t
And sin2 t= y2
x=12 y2
2 y2=1x
y2=0.50.5 x
y= 0.50.5 x
Document Page
4
b)
i)
x=cost
y=sin2 t
ii)
x=cost
y=sin2 t
tabler-icon-diamond-filled.svg

Paraphrase This Document

Need a fresh take? Get an instant paraphrase of this document with our AI Paraphraser
Document Page
5
We know that sin 2 t can be written as,
sin 2 t=2 sintcost
Therefore,
y=2 sintcost
But cost=x therefore sint= 1x2
y=2 1x2 cost
And cost=x
y=2 x 1 x2
Squaring both sides we have,
y2=4 x2 (1x2)
This Cartesian equation gives the graph below which is similar to the one plotted using parametric
equations.
Document Page
6
c)
x= Acos( at+c )
y=Bsin (bt +d)
0 t 2 π
With A=B=1 , c=d=0 ,a=b=1
Document Page
7
With A=B=2 , c=d=0 , a=b=1
tabler-icon-diamond-filled.svg

Paraphrase This Document

Need a fresh take? Get an instant paraphrase of this document with our AI Paraphraser
Document Page
8
With A=B=1 , c=1 , d=0 , a=b=1
Document Page
9
With A=B=1 , c=0 , d=1 , a=b=1
Document Page
10
With A=B=1 , c=5 , d=5 , a=b=1
tabler-icon-diamond-filled.svg

Paraphrase This Document

Need a fresh take? Get an instant paraphrase of this document with our AI Paraphraser
Document Page
11
With A=5 , B=4 , c=1, d=0 , a=2 , b=1
Document Page
12
With A=5 , B=4 , c=1, d=0 , a=3 , b=1
chevron_up_icon
1 out of 17
circle_padding
hide_on_mobile
zoom_out_icon
[object Object]