logo

Matern Child Health Journal


Added on  2022-09-14

7 Pages5431 Words12 Views
Data Science and Big DataHigher EducationDisease and DisordersPublic and Global HealthHealthcare and ResearchStatistics and Probability
 | 
 | 
 | 
145RESEARCHREPRINTED FROM AFP VOL.46, NO.3, MARCH 2017© The Royal Australian College of General Practitioners 2017
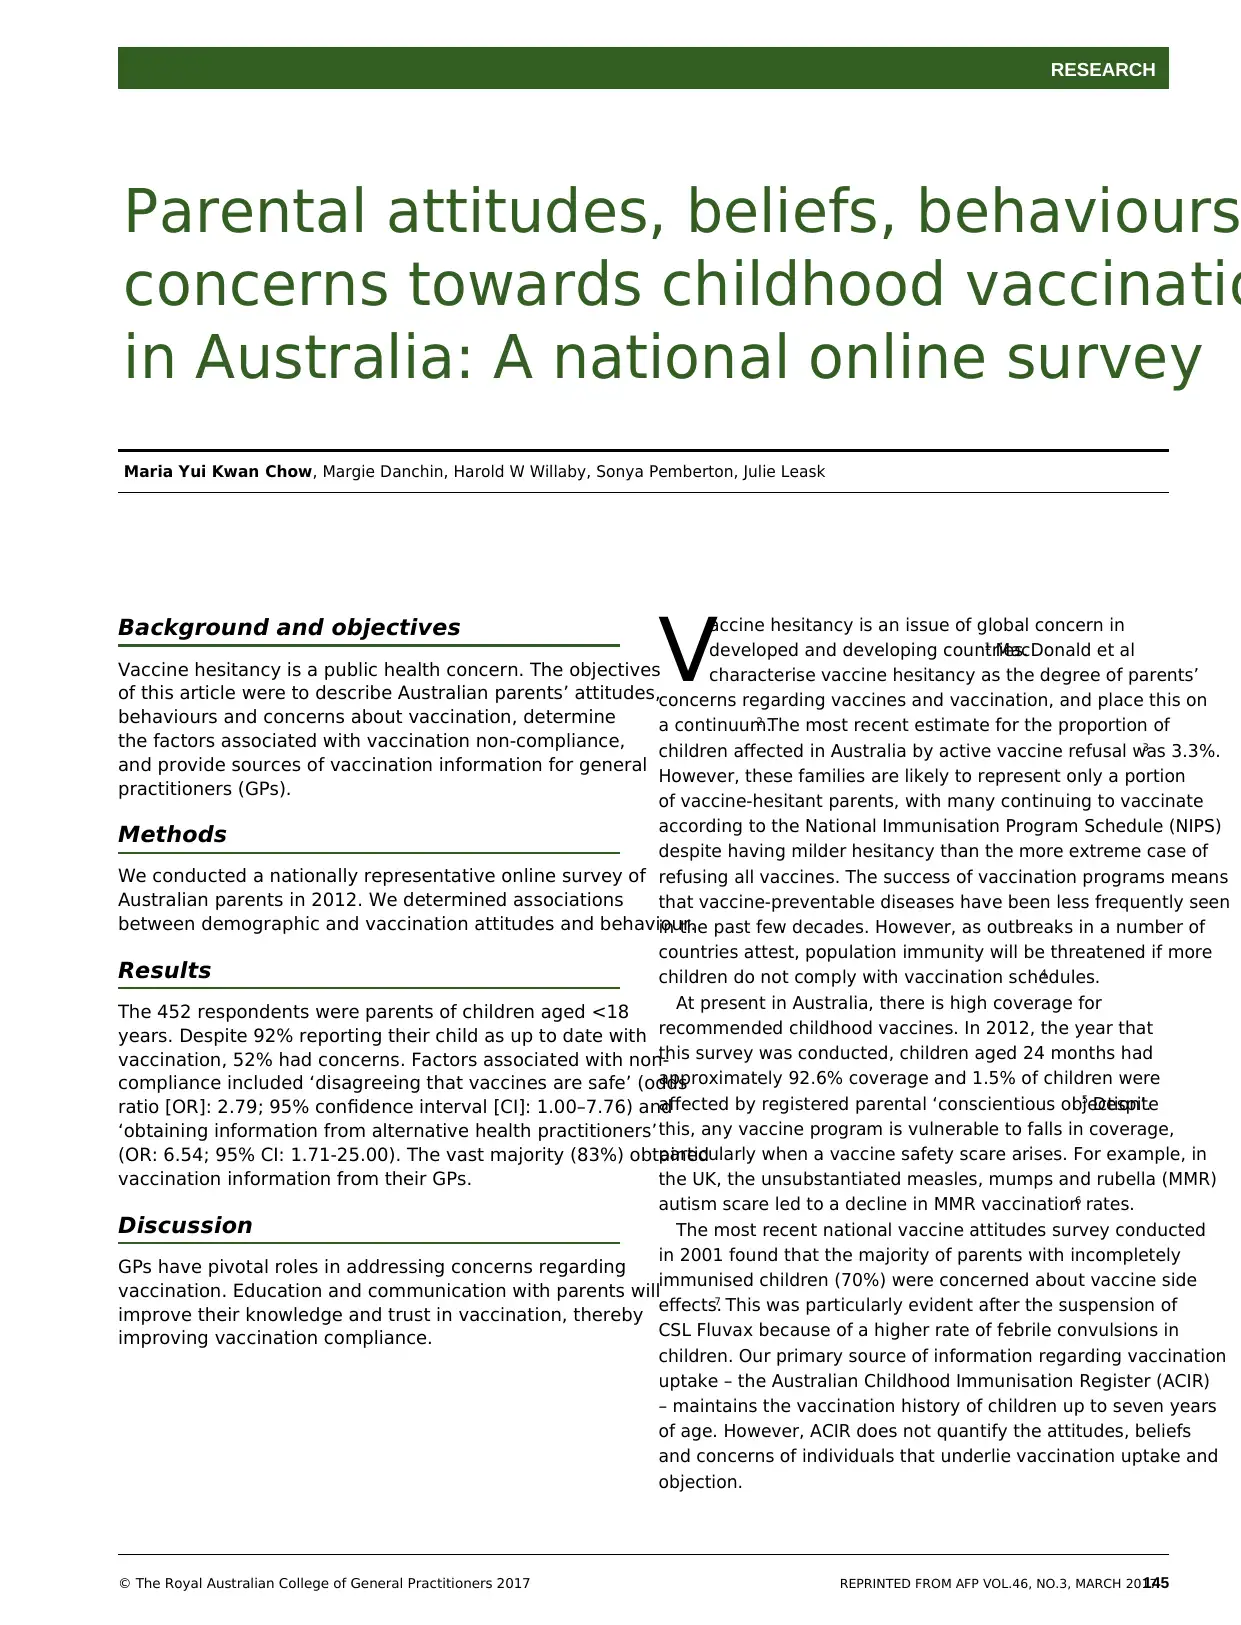
Parental attitudes, beliefs, behaviours and
concerns towards childhood vaccinations
in Australia: A national online survey
Maria Yui Kwan Chow, Margie Danchin, Harold W Willaby, Sonya Pemberton, Julie Leask
accine hesitancy is an issue of global concern in
developed and developing countries.1 MacDonald et al
characterise vaccine hesitancy as the degree of parents’
concerns regarding vaccines and vaccination, and place this on
a continuum.2 The most recent estimate for the proportion of
children affected in Australia by active vaccine refusal was 3.3%.3
However, these families are likely to represent only a portion
of vaccine-hesitant parents, with many continuing to vaccinate
according to the National Immunisation Program Schedule (NIPS)
despite having milder hesitancy than the more extreme case of
refusing all vaccines. The success of vaccination programs means
that vaccine-preventable diseases have been less frequently seen
in the past few decades. However, as outbreaks in a number of
countries attest, population immunity will be threatened if more
children do not comply with vaccination schedules.4
At present in Australia, there is high coverage for
recommended childhood vaccines. In 2012, the year that
this survey was conducted, children aged 24 months had
approximately 92.6% coverage and 1.5% of children were
affected by registered parental ‘conscientious objection’.5 Despite
this, any vaccine program is vulnerable to falls in coverage,
particularly when a vaccine safety scare arises. For example, in
the UK, the unsubstantiated measles, mumps and rubella (MMR)
autism scare led to a decline in MMR vaccination rates.6
The most recent national vaccine attitudes survey conducted
in 2001 found that the majority of parents with incompletely
immunised children (70%) were concerned about vaccine side
effects.7 This was particularly evident after the suspension of
CSL Fluvax because of a higher rate of febrile convulsions in
children. Our primary source of information regarding vaccination
uptake – the Australian Childhood Immunisation Register (ACIR)
– maintains the vaccination history of children up to seven years
of age. However, ACIR does not quantify the attitudes, beliefs
and concerns of individuals that underlie vaccination uptake and
objection.
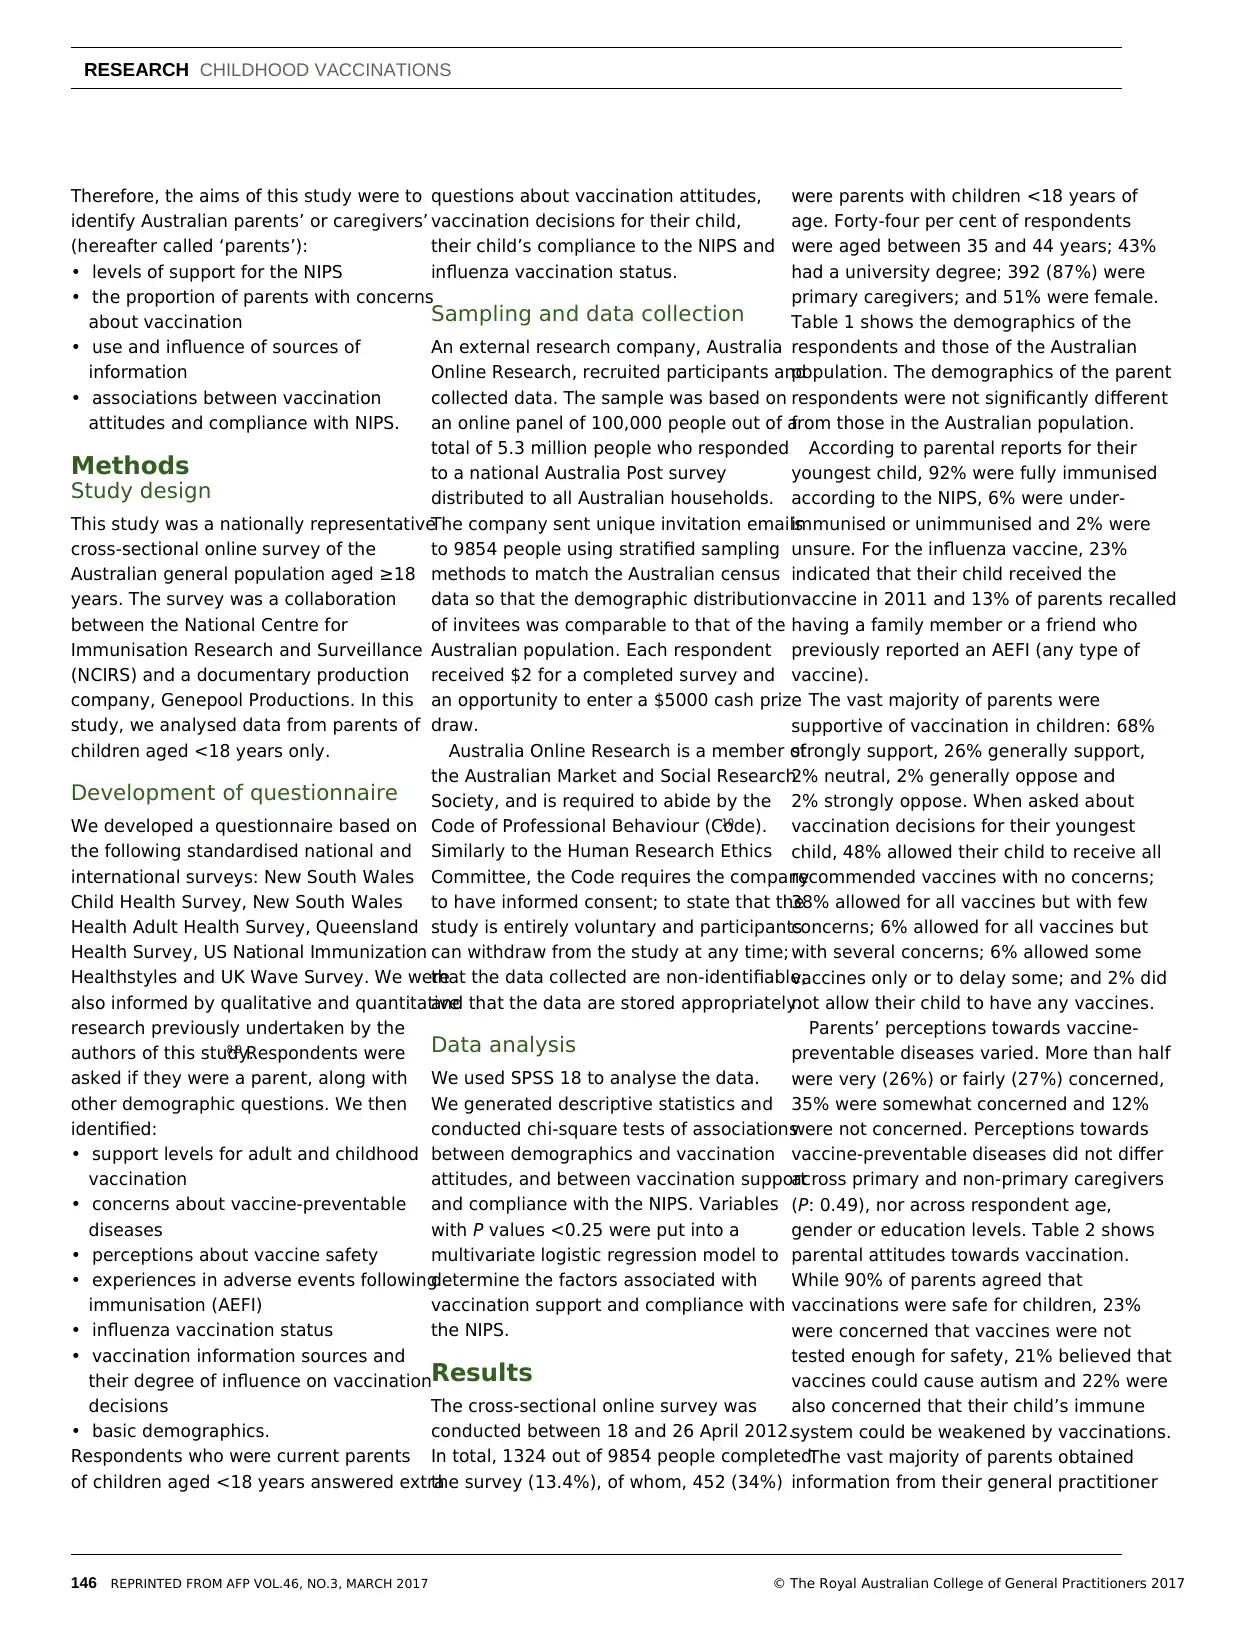
Background and objectives
Vaccine hesitancy is a public health concern. The objectives
of this article were to describe Australian parents’ attitudes,
behaviours and concerns about vaccination, determine
the factors associated with vaccination non-compliance,
and provide sources of vaccination information for general
practitioners (GPs).
Methods
We conducted a nationally representative online survey of
Australian parents in 2012. We determined associations
between demographic and vaccination attitudes and behaviour.
Results
The 452 respondents were parents of children aged <18
years. Despite 92% reporting their child as up to date with
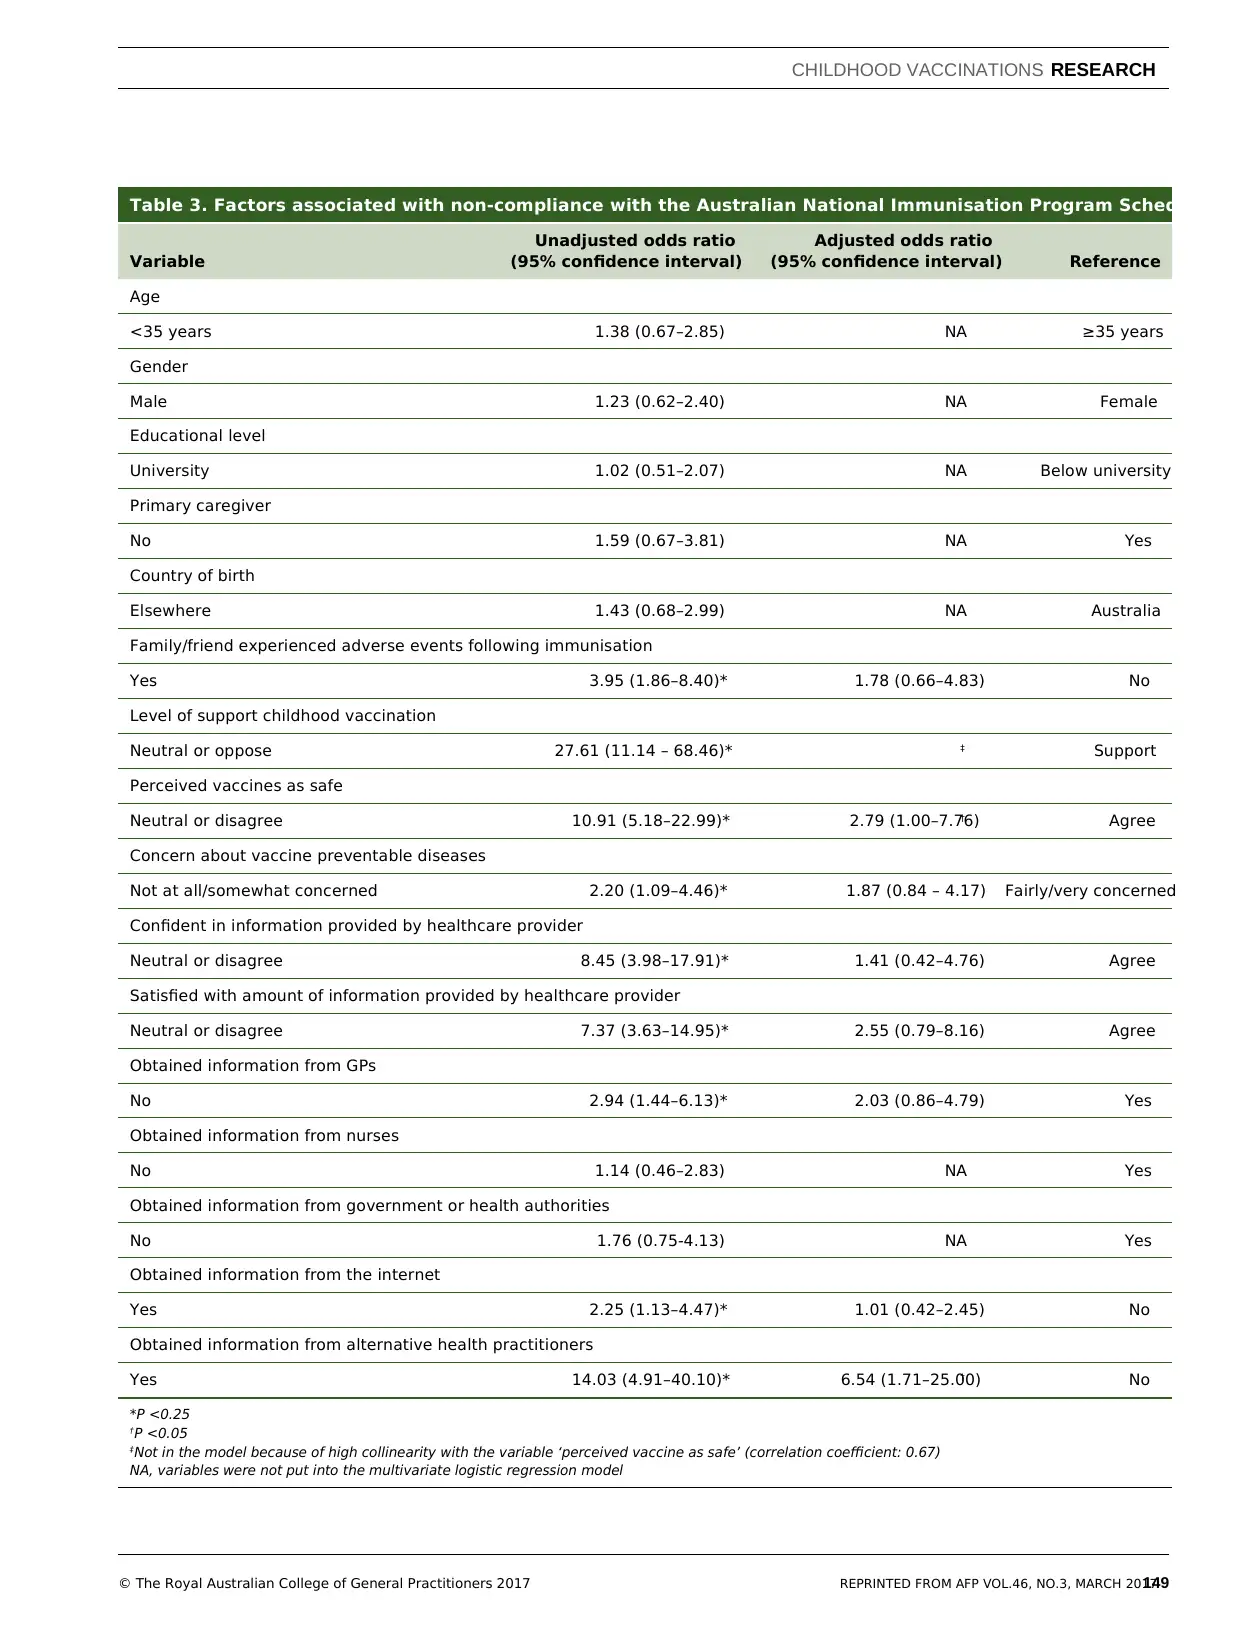
vaccination, 52% had concerns. Factors associated with non-
compliance included ‘disagreeing that vaccines are safe’ (odds
ratio [OR]: 2.79; 95% confidence interval [CI]: 1.00–7.76) and
‘obtaining information from alternative health practitioners’
(OR: 6.54; 95% CI: 1.71-25.00). The vast majority (83%) obtained
vaccination information from their GPs.
Discussion
GPs have pivotal roles in addressing concerns regarding
vaccination. Education and communication with parents will
improve their knowledge and trust in vaccination, thereby
improving vaccination compliance.
V
Matern Child Health Journal_1

146RESEARCHCHILDHOOD VACCINATIONS
REPRINTED FROM AFP VOL.46, NO.3, MARCH 2017 © The Royal Australian College of General Practitioners 2017
Therefore, the aims of this study were to
identify Australian parents’ or caregivers’
(hereafter called ‘parents’):
levels of support for the NIPS
the proportion of parents with concerns
about vaccination
use and influence of sources of
information
associations between vaccination
attitudes and compliance with NIPS.
Methods
Study design
This study was a nationally representative
cross-sectional online survey of the
Australian general population aged ≥18
years. The survey was a collaboration
between the National Centre for
Immunisation Research and Surveillance
(NCIRS) and a documentary production
company, Genepool Productions. In this
study, we analysed data from parents of
children aged <18 years only.
Development of questionnaire
We developed a questionnaire based on
the following standardised national and
international surveys: New South Wales
Child Health Survey, New South Wales
Health Adult Health Survey, Queensland
Health Survey, US National Immunization
Healthstyles and UK Wave Survey. We were
also informed by qualitative and quantitative
research previously undertaken by the
authors of this study.8,9 Respondents were
asked if they were a parent, along with
other demographic questions. We then
identified:
support levels for adult and childhood
vaccination
concerns about vaccine-preventable
diseases
perceptions about vaccine safety
experiences in adverse events following
immunisation (AEFI)
influenza vaccination status
vaccination information sources and
their degree of influence on vaccination
decisions
basic demographics.
Respondents who were current parents
of children aged <18 years answered extra
questions about vaccination attitudes,
vaccination decisions for their child,
their child’s compliance to the NIPS and
influenza vaccination status.
Sampling and data collection
An external research company, Australia
Online Research, recruited participants and
collected data. The sample was based on
an online panel of 100,000 people out of a
total of 5.3 million people who responded
to a national Australia Post survey
distributed to all Australian households.
The company sent unique invitation emails
to 9854 people using stratified sampling
methods to match the Australian census
data so that the demographic distribution
of invitees was comparable to that of the
Australian population. Each respondent
received $2 for a completed survey and
an opportunity to enter a $5000 cash prize
draw.
Australia Online Research is a member of
the Australian Market and Social Research
Society, and is required to abide by the
Code of Professional Behaviour (Code).10
Similarly to the Human Research Ethics
Committee, the Code requires the company
to have informed consent; to state that the
study is entirely voluntary and participants
can withdraw from the study at any time;
that the data collected are non-identifiable;
and that the data are stored appropriately.
Data analysis
We used SPSS 18 to analyse the data.
We generated descriptive statistics and
conducted chi-square tests of associations
between demographics and vaccination
attitudes, and between vaccination support
and compliance with the NIPS. Variables
with P values <0.25 were put into a
multivariate logistic regression model to
determine the factors associated with
vaccination support and compliance with
the NIPS.
Results
The cross-sectional online survey was
conducted between 18 and 26 April 2012.
In total, 1324 out of 9854 people completed
the survey (13.4%), of whom, 452 (34%)
were parents with children <18 years of
age. Forty-four per cent of respondents
were aged between 35 and 44 years; 43%
had a university degree; 392 (87%) were
primary caregivers; and 51% were female.
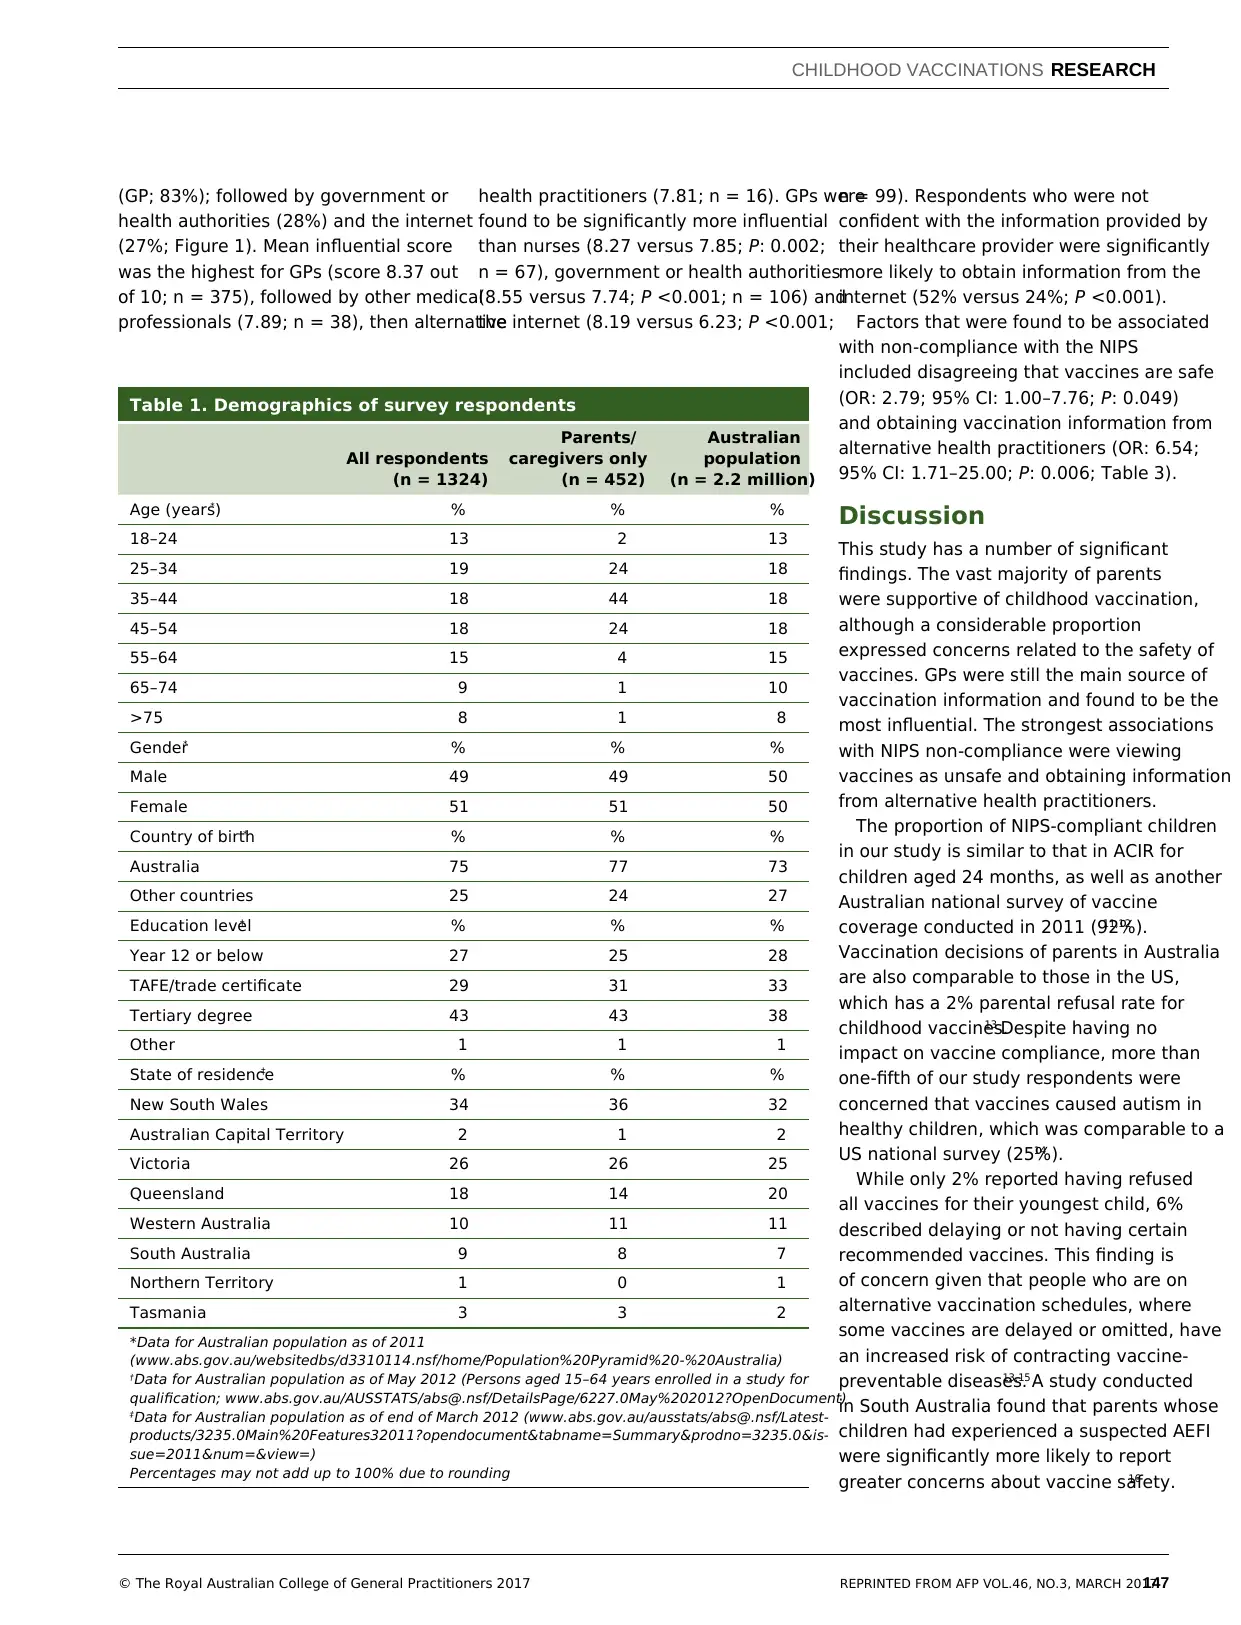
Table 1 shows the demographics of the
respondents and those of the Australian
population. The demographics of the parent
respondents were not significantly different
from those in the Australian population.
According to parental reports for their
youngest child, 92% were fully immunised
according to the NIPS, 6% were under-
immunised or unimmunised and 2% were
unsure. For the influenza vaccine, 23%
indicated that their child received the
vaccine in 2011 and 13% of parents recalled
having a family member or a friend who
previously reported an AEFI (any type of
vaccine).
The vast majority of parents were
supportive of vaccination in children: 68%
strongly support, 26% generally support,
2% neutral, 2% generally oppose and
2% strongly oppose. When asked about
vaccination decisions for their youngest
child, 48% allowed their child to receive all
recommended vaccines with no concerns;
38% allowed for all vaccines but with few
concerns; 6% allowed for all vaccines but
with several concerns; 6% allowed some
vaccines only or to delay some; and 2% did
not allow their child to have any vaccines.
Parents’ perceptions towards vaccine-
preventable diseases varied. More than half
were very (26%) or fairly (27%) concerned,
35% were somewhat concerned and 12%
were not concerned. Perceptions towards
vaccine-preventable diseases did not differ
across primary and non-primary caregivers
(P: 0.49), nor across respondent age,
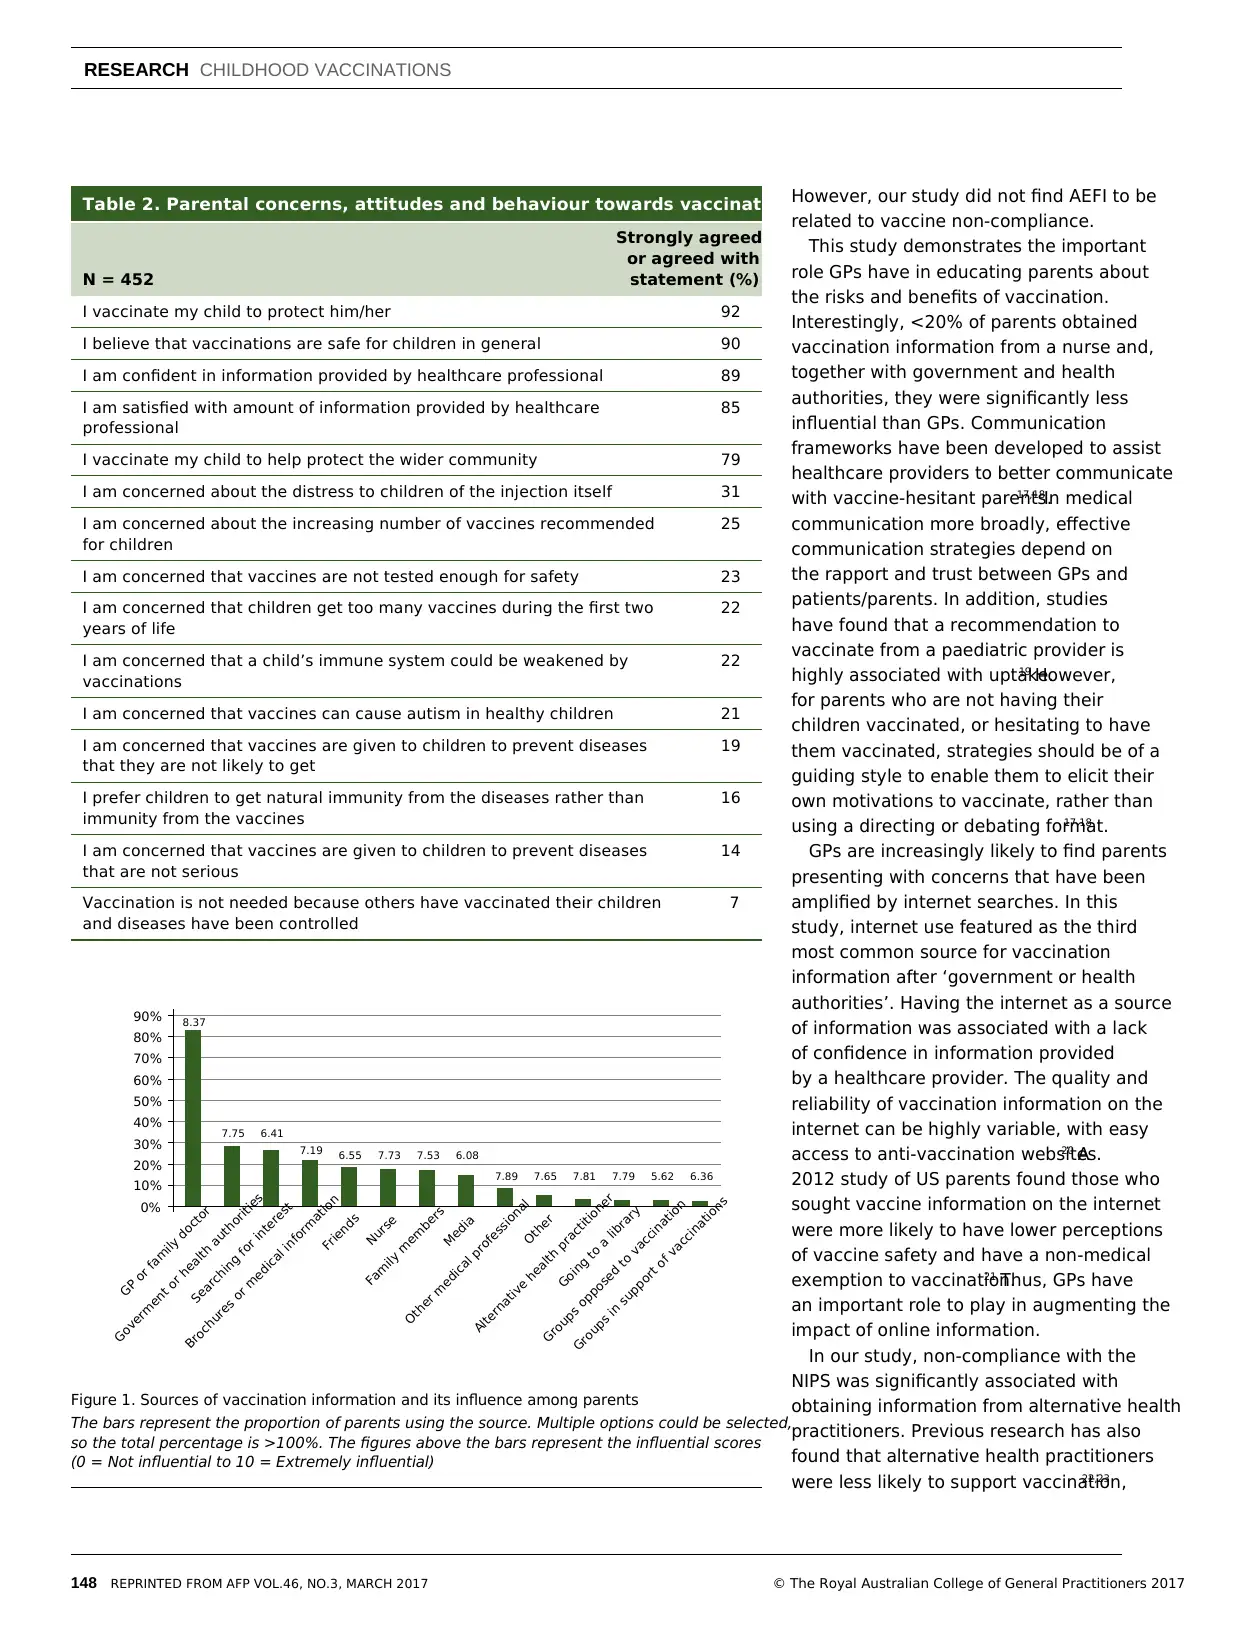
gender or education levels. Table 2 shows
parental attitudes towards vaccination.
While 90% of parents agreed that
vaccinations were safe for children, 23%
were concerned that vaccines were not
tested enough for safety, 21% believed that
vaccines could cause autism and 22% were
also concerned that their child’s immune
system could be weakened by vaccinations.
The vast majority of parents obtained
information from their general practitioner
Matern Child Health Journal_2

147CHILDHOOD VACCINATIONSRESEARCH
REPRINTED FROM AFP VOL.46, NO.3, MARCH 2017© The Royal Australian College of General Practitioners 2017
n = 99). Respondents who were not
confident with the information provided by
their healthcare provider were significantly
more likely to obtain information from the
internet (52% versus 24%; P <0.001).
Factors that were found to be associated
with non-compliance with the NIPS
included disagreeing that vaccines are safe
(OR: 2.79; 95% CI: 1.00–7.76; P: 0.049)
and obtaining vaccination information from
alternative health practitioners (OR: 6.54;
95% CI: 1.71–25.00; P: 0.006; Table 3).
Discussion
This study has a number of significant
findings. The vast majority of parents
were supportive of childhood vaccination,
although a considerable proportion
expressed concerns related to the safety of
vaccines. GPs were still the main source of
vaccination information and found to be the
most influential. The strongest associations
with NIPS non-compliance were viewing
vaccines as unsafe and obtaining information
from alternative health practitioners.
The proportion of NIPS-compliant children
in our study is similar to that in ACIR for
children aged 24 months, as well as another
Australian national survey of vaccine
coverage conducted in 2011 (92%).11,12
Vaccination decisions of parents in Australia
are also comparable to those in the US,
which has a 2% parental refusal rate for
childhood vaccines.13 Despite having no
impact on vaccine compliance, more than
one-fifth of our study respondents were
concerned that vaccines caused autism in
healthy children, which was comparable to a
US national survey (25%).14
While only 2% reported having refused
all vaccines for their youngest child, 6%
described delaying or not having certain
recommended vaccines. This finding is
of concern given that people who are on
alternative vaccination schedules, where
some vaccines are delayed or omitted, have
an increased risk of contracting vaccine-
preventable diseases.13,15 A study conducted
in South Australia found that parents whose
children had experienced a suspected AEFI
were significantly more likely to report
greater concerns about vaccine safety.16
Table 1. Demographics of survey respondents
All respondents
(n = 1324)
Parents/
caregivers only
(n = 452)
Australian
population
(n = 2.2 million)
Age (years)* % % %
18–24 13 2 13
25–34 19 24 18
35–44 18 44 18
45–54 18 24 18
55–64 15 4 15
65–74 9 1 10
>75 8 1 8
Gender* % % %
Male 49 49 50
Female 51 51 50
Country of birth* % % %
Australia 75 77 73
Other countries 25 24 27
Education level % % %
Year 12 or below 27 25 28
TAFE/trade certificate 29 31 33
Tertiary degree 43 43 38
Other 1 1 1
State of residence % % %
New South Wales 34 36 32
Australian Capital Territory 2 1 2
Victoria 26 26 25
Queensland 18 14 20
Western Australia 10 11 11
South Australia 9 8 7
Northern Territory 1 0 1
Tasmania 3 3 2
*Data for Australian population as of 2011
(www.abs.gov.au/websitedbs/d3310114.nsf/home/Population%20Pyramid%20-%20Australia)

Data for Australian population as of May 2012 (Persons aged 15–64 years enrolled in a study for
qualification; www.abs.gov.au/AUSSTATS/abs@.nsf/DetailsPage/6227.0May%202012?OpenDocument)

Data for Australian population as of end of March 2012 (www.abs.gov.au/ausstats/abs@.nsf/Latest-
products/3235.0Main%20Features32011?opendocument&tabname=Summary&prodno=3235.0&is-
sue=2011&num=&view=)
Percentages may not add up to 100% due to rounding
(GP; 83%); followed by government or
health authorities (28%) and the internet
(27%; Figure 1). Mean influential score
was the highest for GPs (score 8.37 out
of 10; n = 375), followed by other medical
professionals (7.89; n = 38), then alternative
health practitioners (7.81; n = 16). GPs were
found to be significantly more influential
than nurses (8.27 versus 7.85; P: 0.002;
n = 67), government or health authorities
(8.55 versus 7.74; P <0.001; n = 106) and
the internet (8.19 versus 6.23; P <0.001;
Matern Child Health Journal_3

End of preview

Want to access all the pages? Upload your documents or become a member.

Related Documents
Patient Education and Counseling Journal Homepage
|8
|9374
|17