Craniometrics Data Analysis using R Programming: Assignment Solution

Verified

Added on  2022/09/07

|10
|634
|20
Practical Assignment
AI Summary
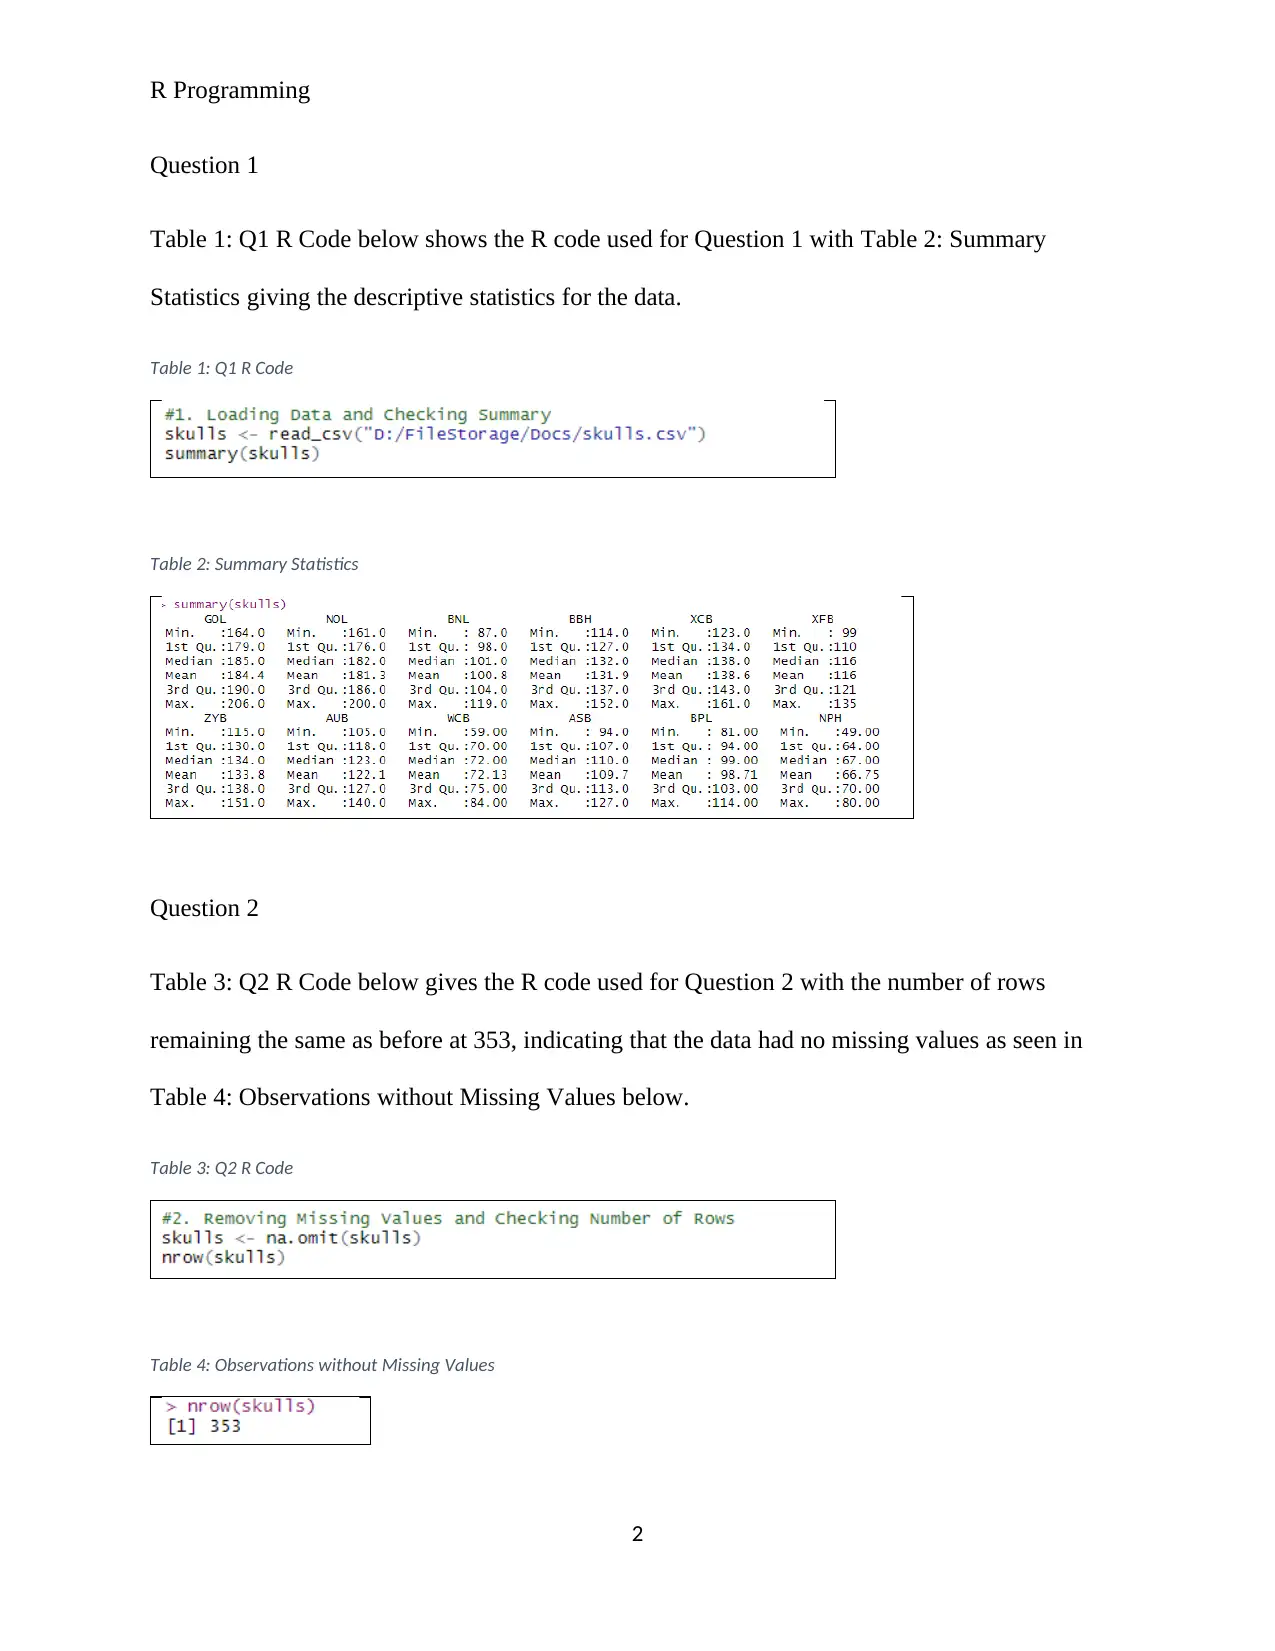
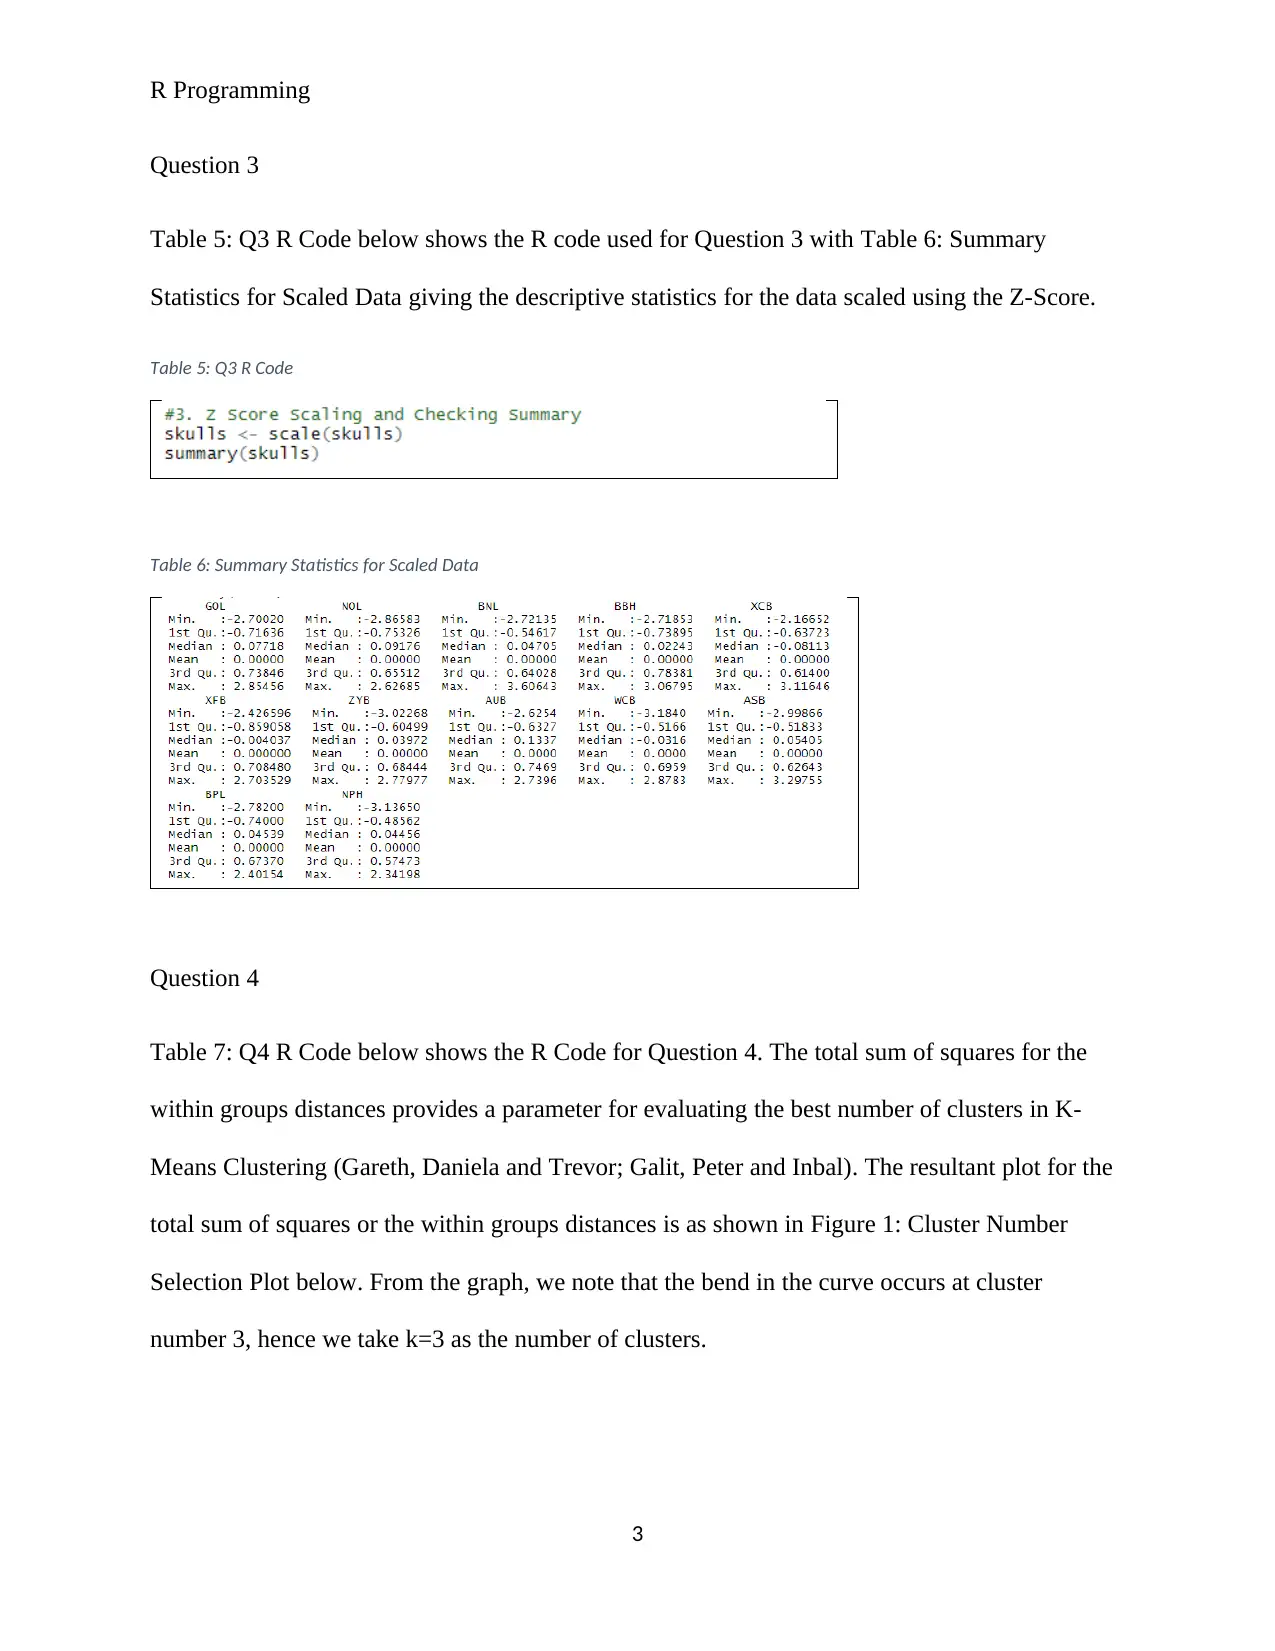
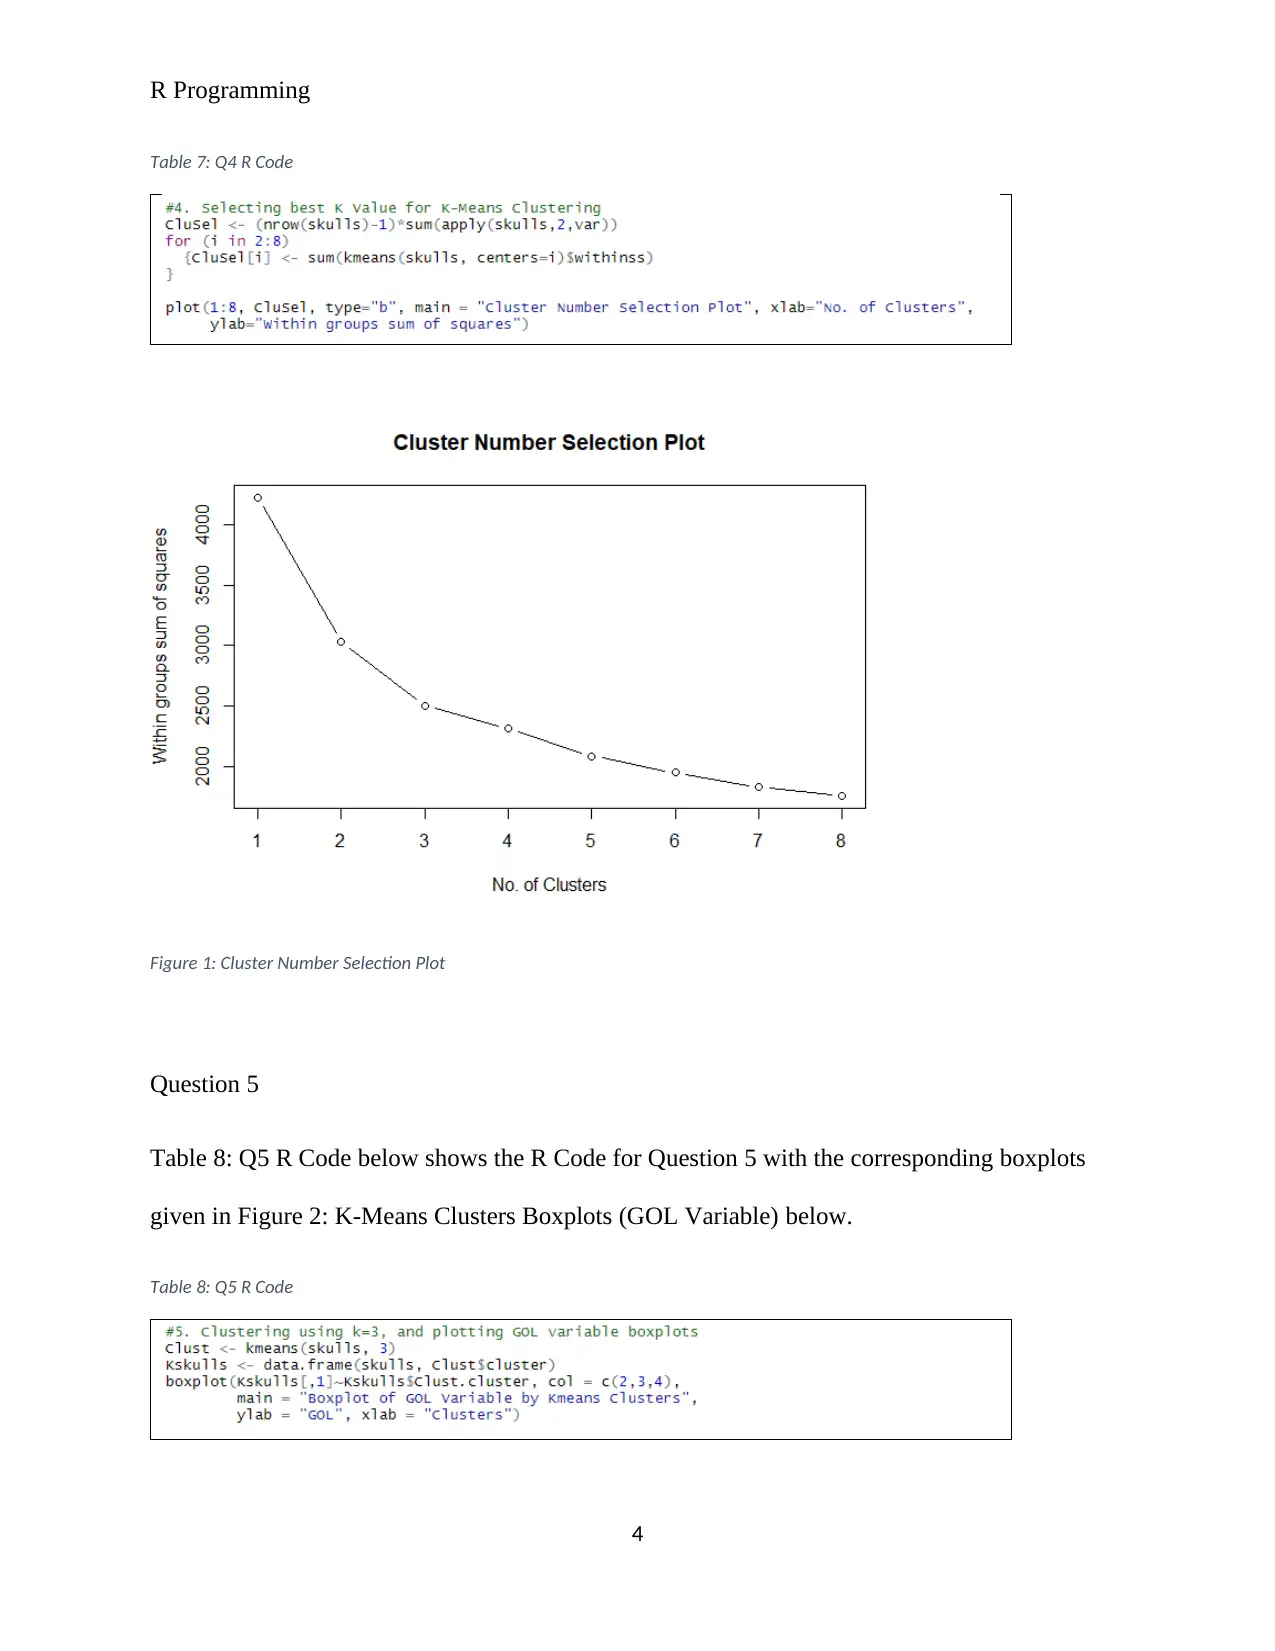
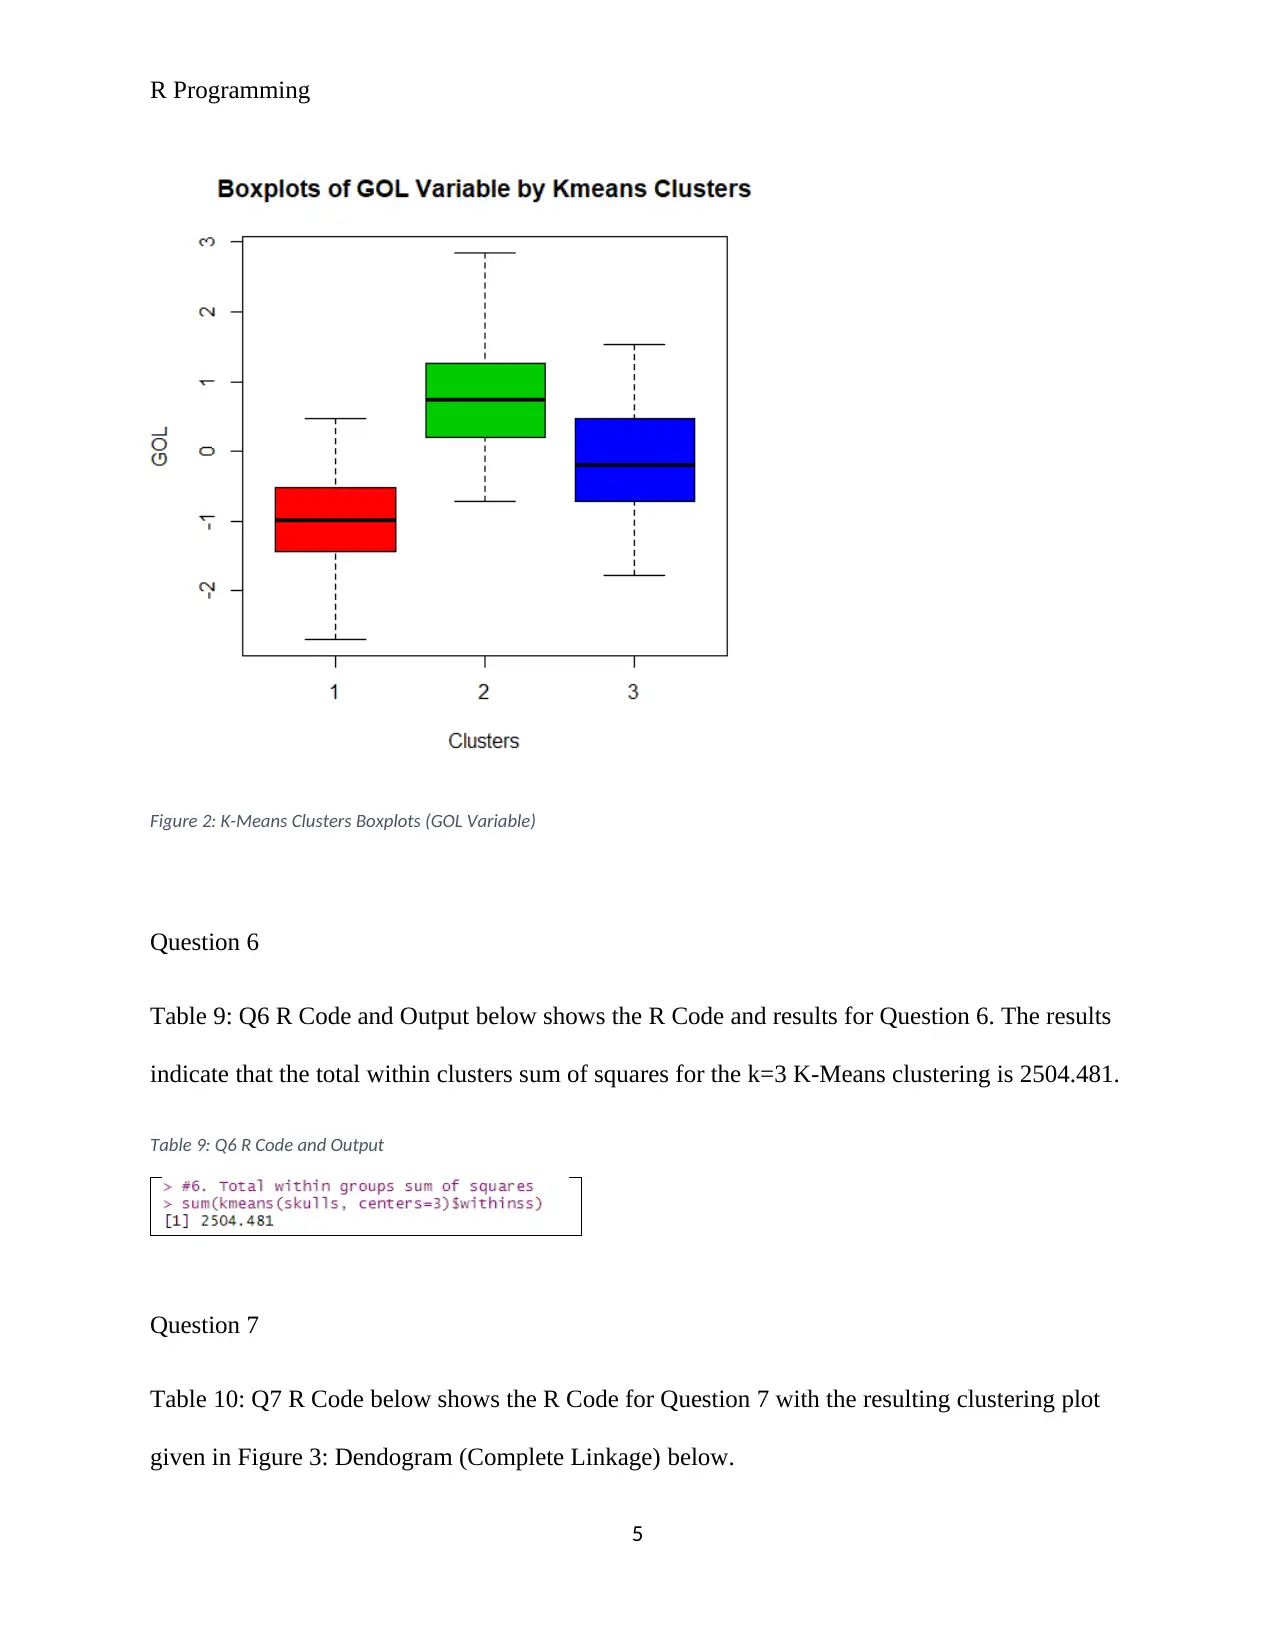
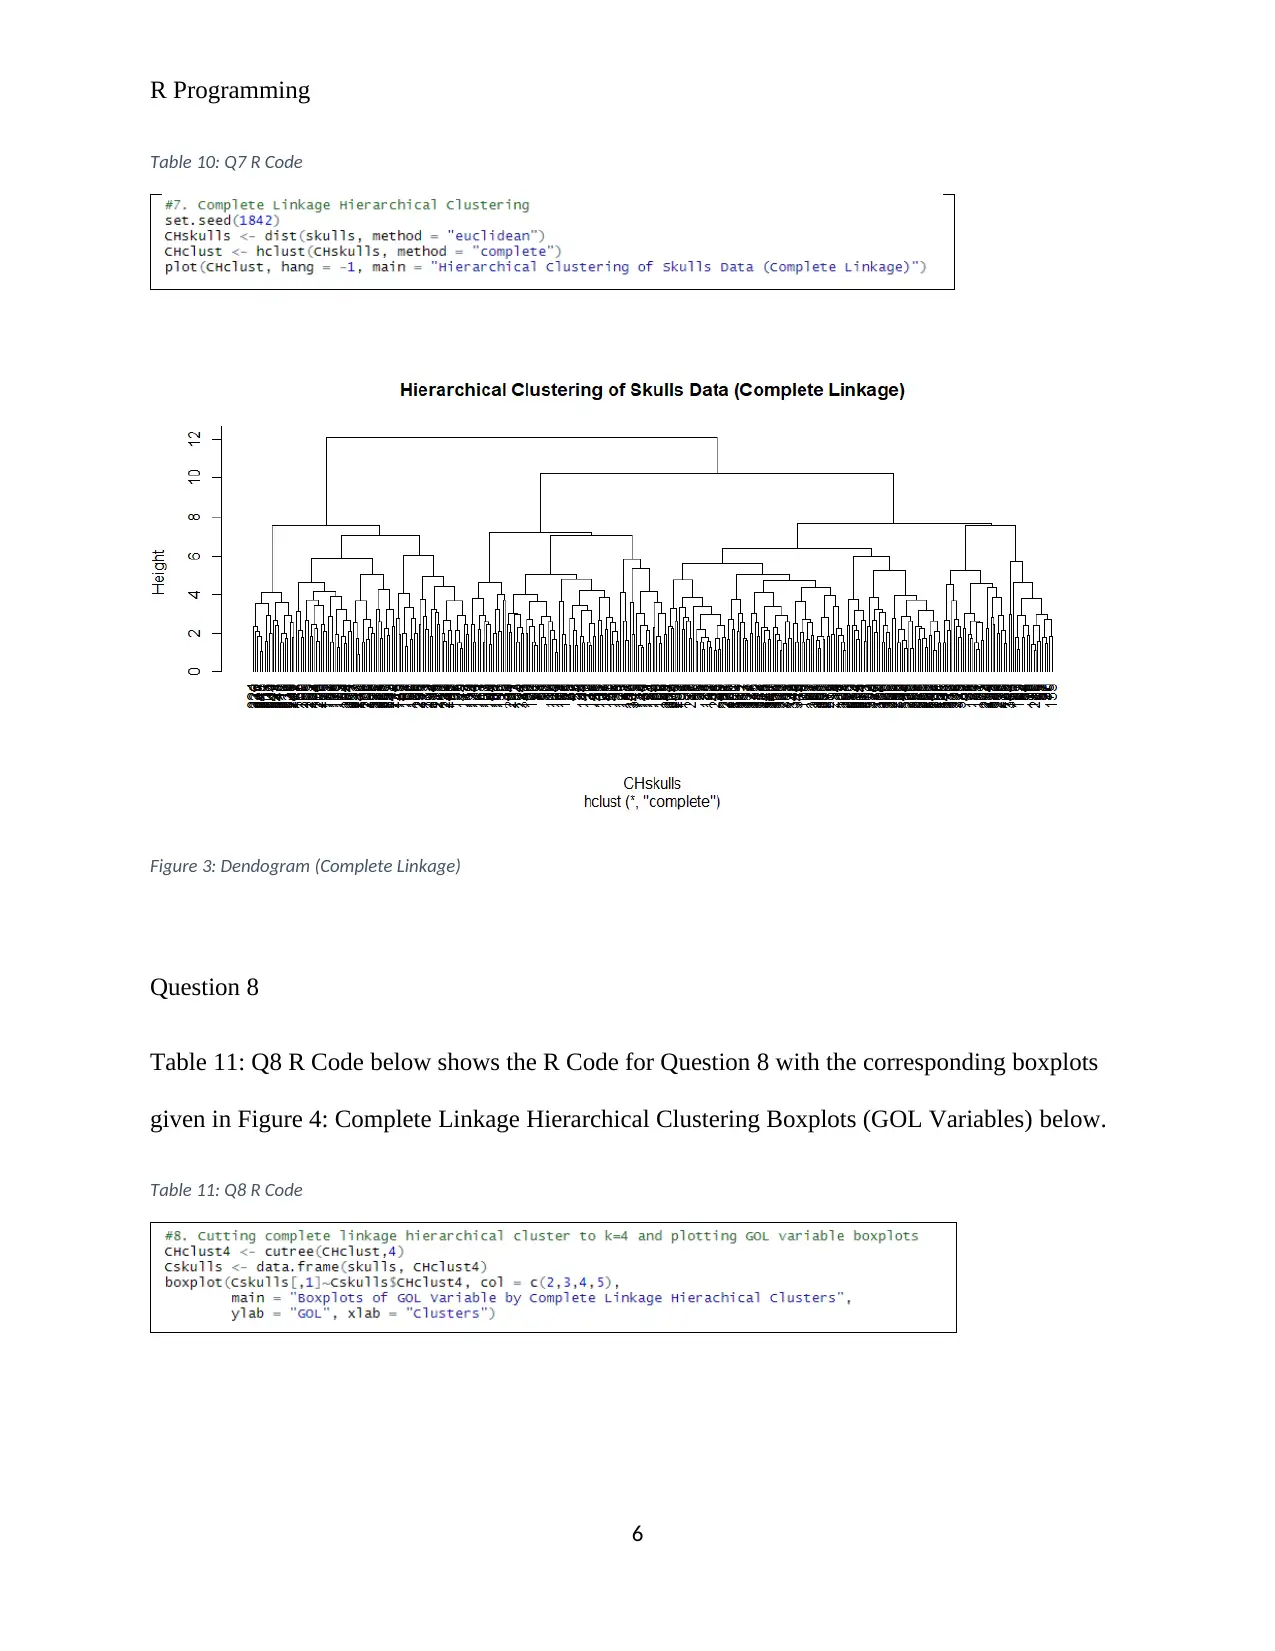
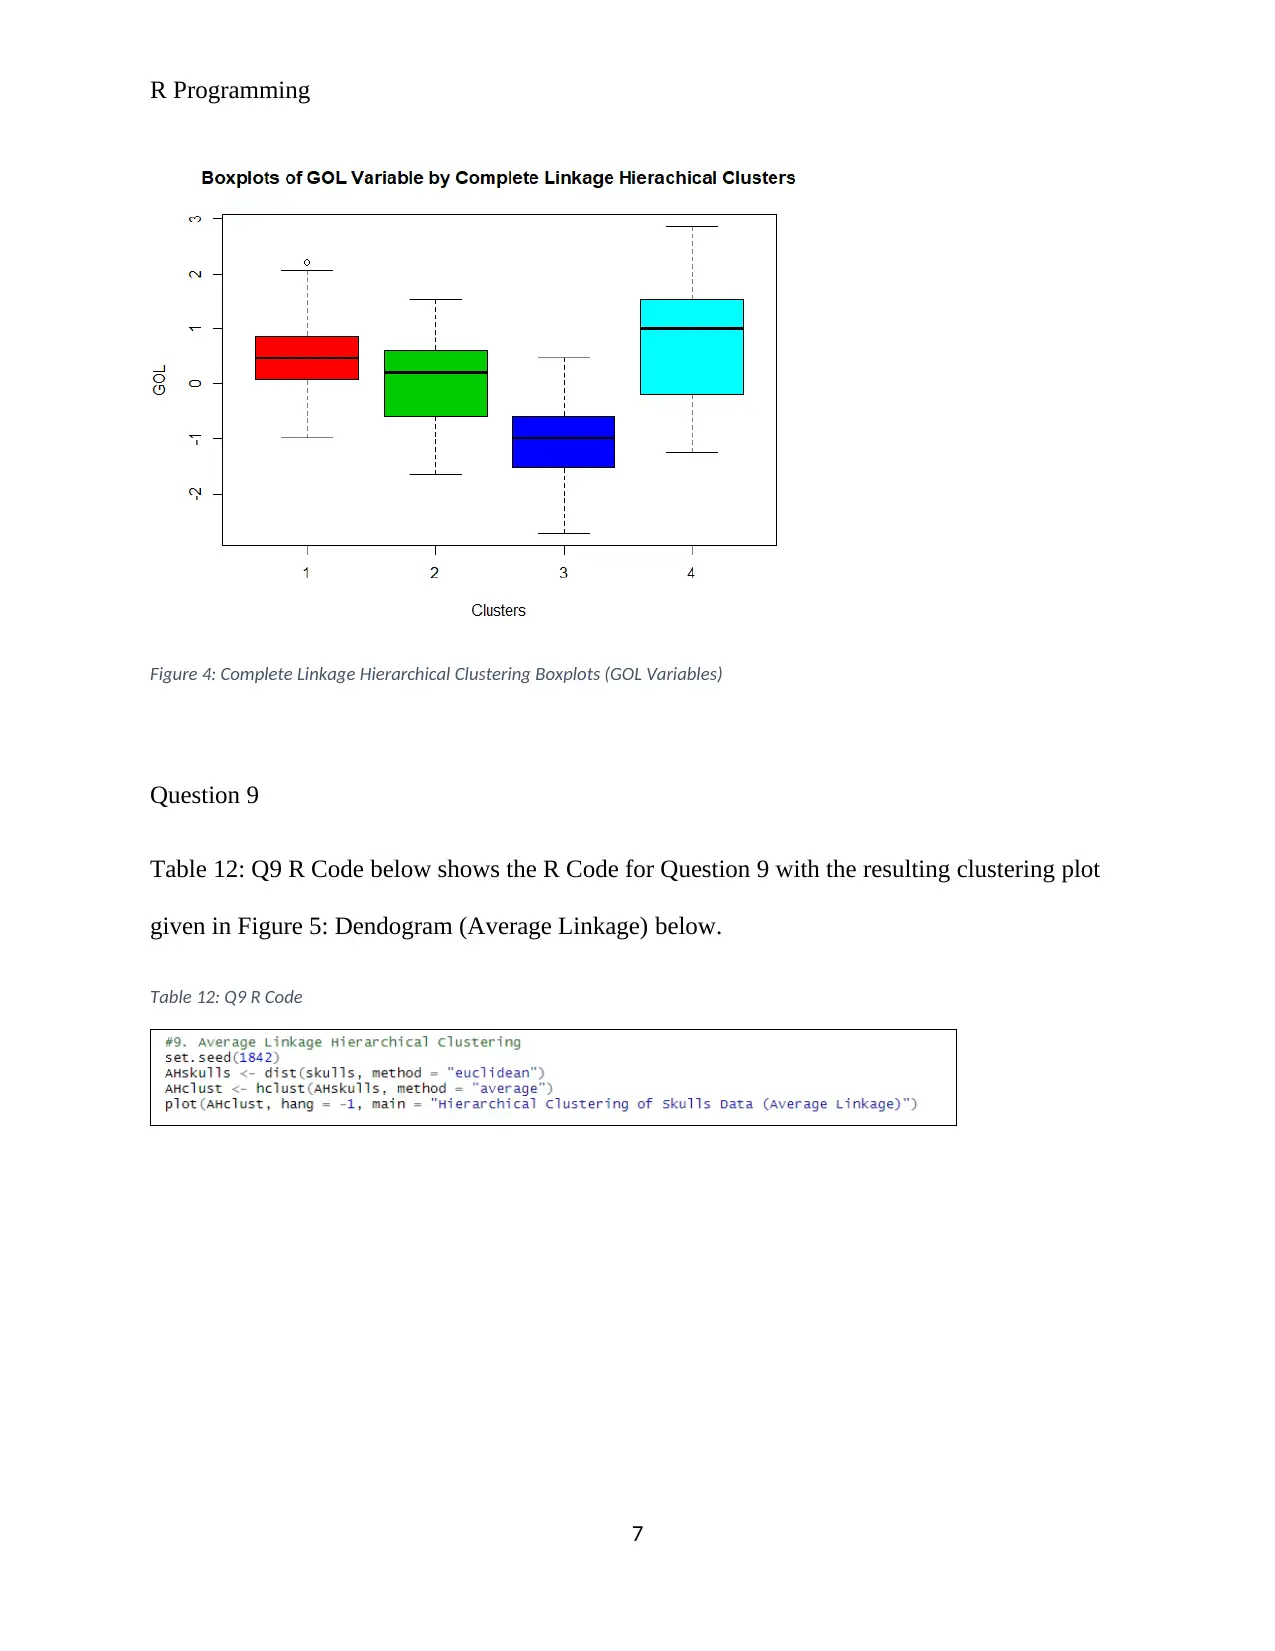
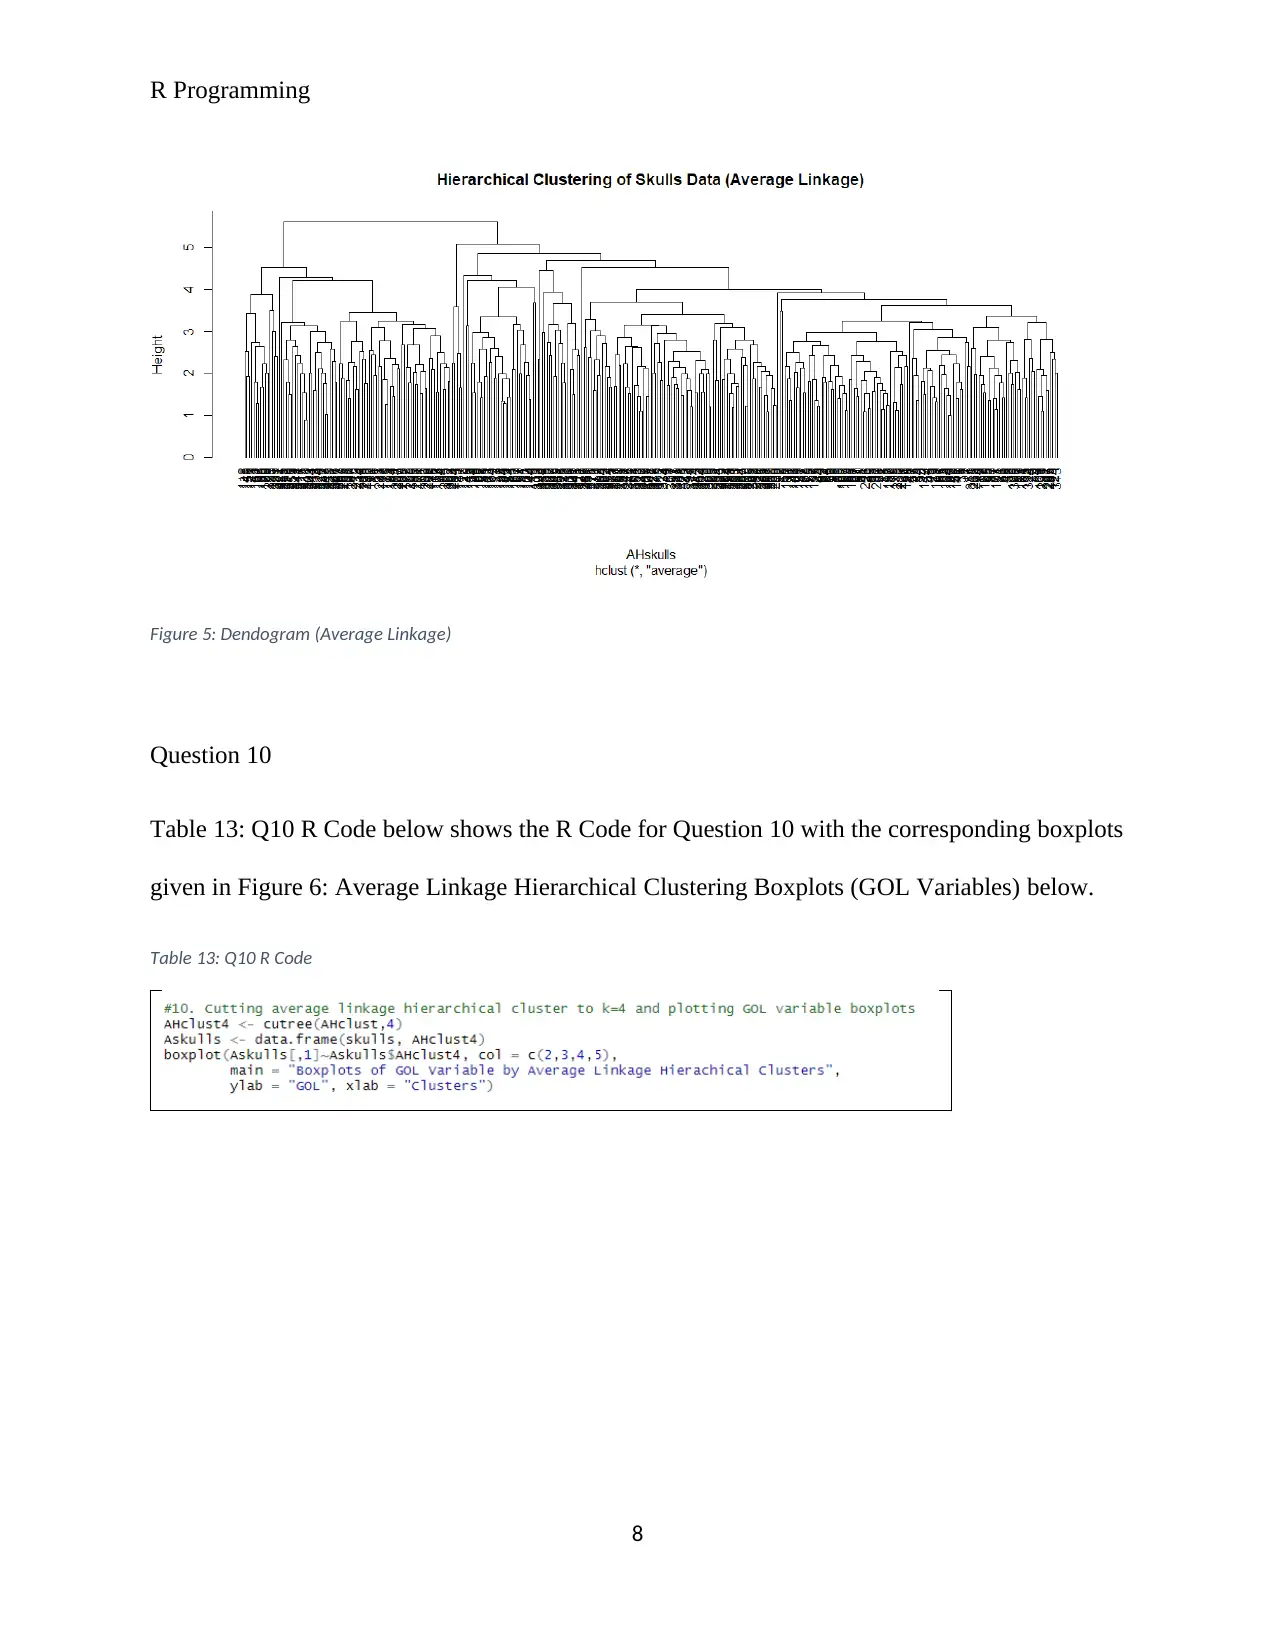
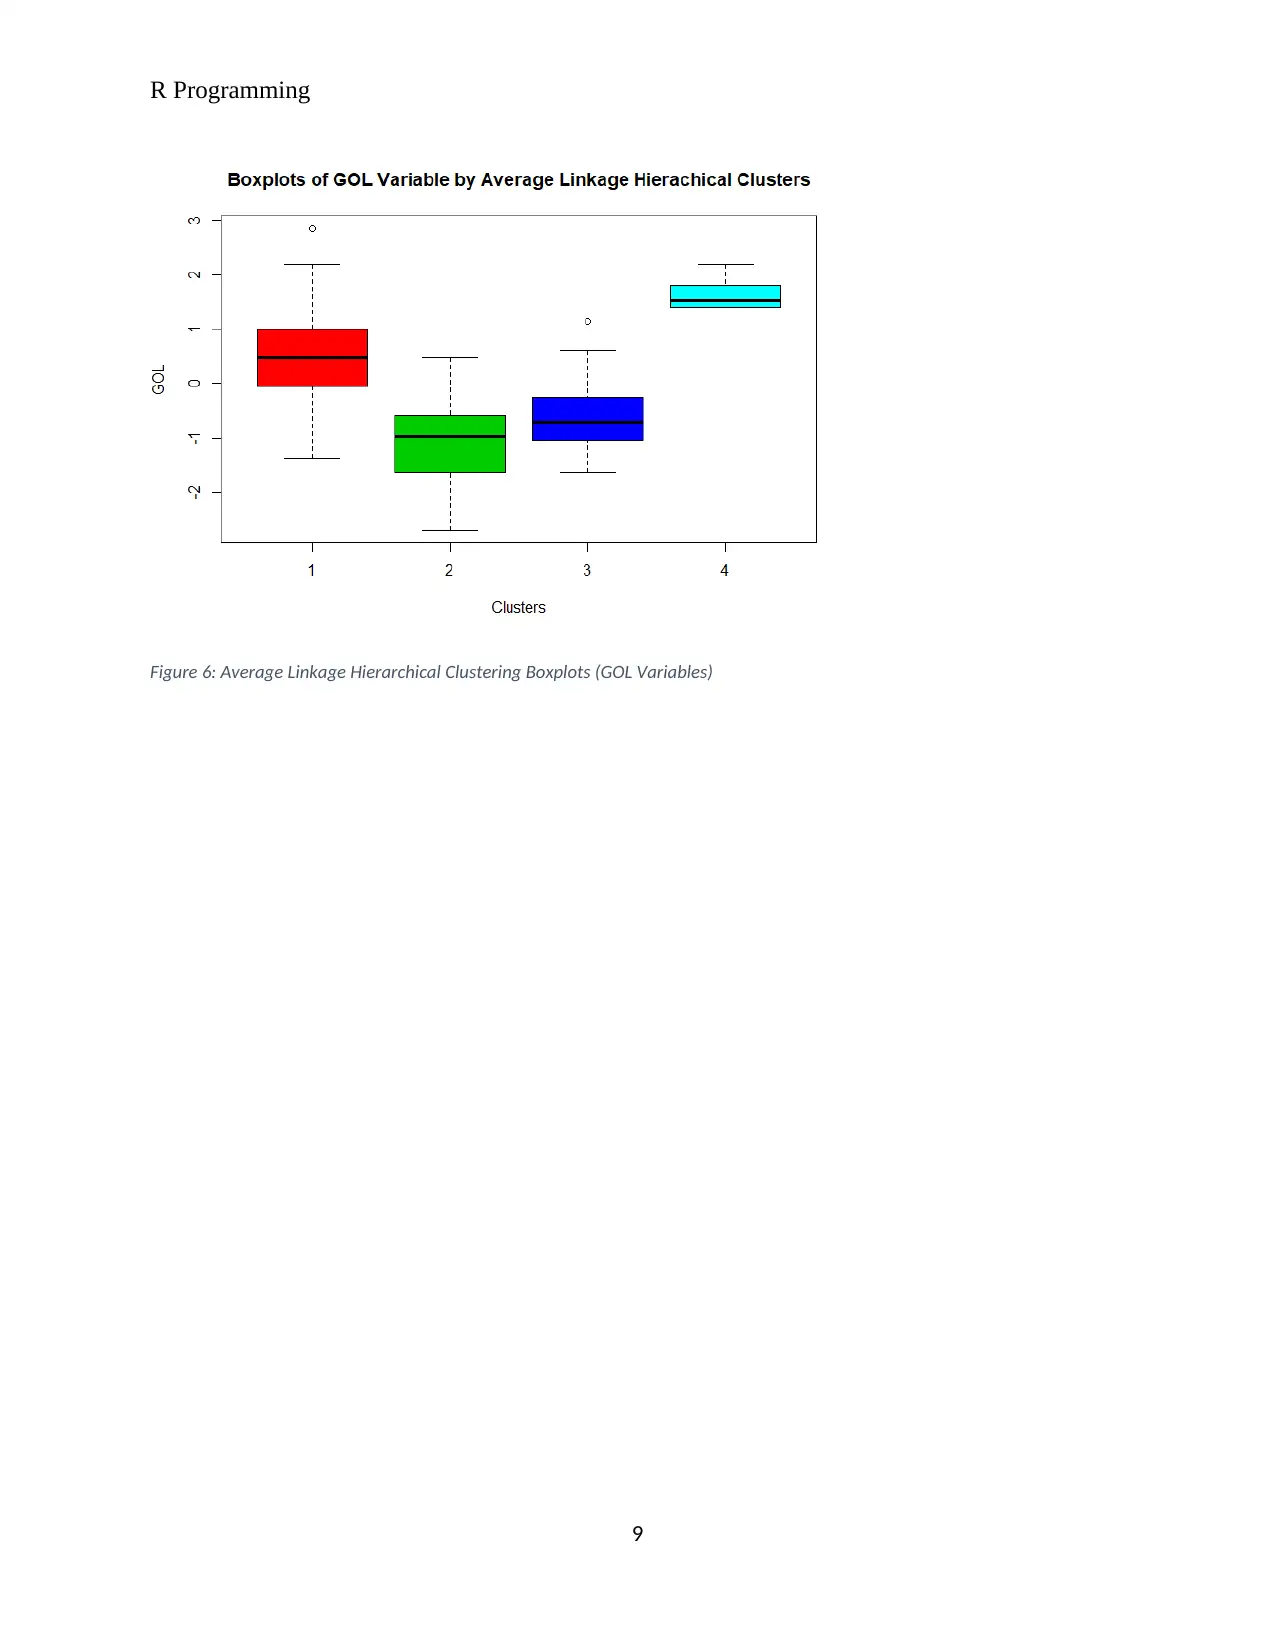
This assignment solution demonstrates the use of R programming for analyzing craniometrics data, which involves the measurement of skulls. The solution encompasses several key steps: reading and examining the data, handling missing values using `na.omit()`, and rescaling the data using Z-scores. Furthermore, the solution explores k-means clustering to identify the optimal number of clusters (k) through an iterative loop and plot analysis. The solution also includes hierarchical clustering with complete and average linkage methods, generating corresponding boxplots and dendrograms for visualization and interpretation. The code, plots, and descriptive statistics are provided to thoroughly address all assignment requirements. The analysis is based on a dataset containing 12 skull measurements from over 300 skulls, providing a practical application of data analysis techniques in the context of craniometrics. The assignment covers various aspects of data analysis like descriptive statistics, data cleaning, data scaling, and clustering techniques to provide a complete solution to the assignment.
Document Page
R Programming
tabler-icon-diamond-filled.svg

Paraphrase This Document

Need a fresh take? Get an instant paraphrase of this document with our AI Paraphraser
Document Page
R Programming
Question 1
Table 1: Q1 R Code below shows the R code used for Question 1 with Table 2: Summary
Statistics giving the descriptive statistics for the data.
Table 1: Q1 R Code
Table 2: Summary Statistics
Question 2
Table 3: Q2 R Code below gives the R code used for Question 2 with the number of rows
remaining the same as before at 353, indicating that the data had no missing values as seen in
Table 4: Observations without Missing Values below.
Table 3: Q2 R Code
Table 4: Observations without Missing Values
2
Document Page
R Programming
Question 3
Table 5: Q3 R Code below shows the R code used for Question 3 with Table 6: Summary
Statistics for Scaled Data giving the descriptive statistics for the data scaled using the Z-Score.
Table 5: Q3 R Code
Table 6: Summary Statistics for Scaled Data
Question 4
Table 7: Q4 R Code below shows the R Code for Question 4. The total sum of squares for the
within groups distances provides a parameter for evaluating the best number of clusters in K-
Means Clustering (Gareth, Daniela and Trevor; Galit, Peter and Inbal). The resultant plot for the
total sum of squares or the within groups distances is as shown in Figure 1: Cluster Number
Selection Plot below. From the graph, we note that the bend in the curve occurs at cluster
number 3, hence we take k=3 as the number of clusters.
3
Document Page
R Programming
Table 7: Q4 R Code
Figure 1: Cluster Number Selection Plot
Question 5
Table 8: Q5 R Code below shows the R Code for Question 5 with the corresponding boxplots
given in Figure 2: K-Means Clusters Boxplots (GOL Variable) below.
Table 8: Q5 R Code
4
tabler-icon-diamond-filled.svg

Paraphrase This Document

Need a fresh take? Get an instant paraphrase of this document with our AI Paraphraser
Document Page
R Programming
Figure 2: K-Means Clusters Boxplots (GOL Variable)
Question 6
Table 9: Q6 R Code and Output below shows the R Code and results for Question 6. The results
indicate that the total within clusters sum of squares for the k=3 K-Means clustering is 2504.481.
Table 9: Q6 R Code and Output
Question 7
Table 10: Q7 R Code below shows the R Code for Question 7 with the resulting clustering plot
given in Figure 3: Dendogram (Complete Linkage) below.
5
Document Page
R Programming
Table 10: Q7 R Code
Figure 3: Dendogram (Complete Linkage)
Question 8
Table 11: Q8 R Code below shows the R Code for Question 8 with the corresponding boxplots
given in Figure 4: Complete Linkage Hierarchical Clustering Boxplots (GOL Variables) below.
Table 11: Q8 R Code
6
Document Page
R Programming
Figure 4: Complete Linkage Hierarchical Clustering Boxplots (GOL Variables)
Question 9
Table 12: Q9 R Code below shows the R Code for Question 9 with the resulting clustering plot
given in Figure 5: Dendogram (Average Linkage) below.
Table 12: Q9 R Code
7
tabler-icon-diamond-filled.svg

Paraphrase This Document

Need a fresh take? Get an instant paraphrase of this document with our AI Paraphraser
Document Page
R Programming
Figure 5: Dendogram (Average Linkage)
Question 10
Table 13: Q10 R Code below shows the R Code for Question 10 with the corresponding boxplots
given in Figure 6: Average Linkage Hierarchical Clustering Boxplots (GOL Variables) below.
Table 13: Q10 R Code
8
Document Page
R Programming
Figure 6: Average Linkage Hierarchical Clustering Boxplots (GOL Variables)
9
Document Page
R Programming
References
Galit, S, et al. Data Mining for Business Analytics. 1st. New Delhi: John Wiley & Sons, Inc.,
2018.
Gareth, James, et al. An Introduction to Statistical Learning. 3rd. New York: Springer, 2013.
10
chevron_up_icon
1 out of 10
circle_padding
hide_on_mobile
zoom_out_icon
[object Object]