Project Management Analysis: Xemba Translations Case Study Report
VerifiedAdded on 2022/08/19
|19
|3729
|14
Report
AI Summary
This report presents a comprehensive analysis of the Xemba Translations project, addressing the challenges faced by the project manager in accommodating an increased number of telecommuters. It begins with a risk assessment matrix, identifying potential risks such as budget overruns, insufficient resource allocation, and changes in project scope, along with mitigation strategies. The report then delves into performance measurement metrics, including schedule variance, earned value, cost and schedule performance indices, and estimate at completion, providing justifications for their use and detailed calculations based on project data. The analysis reveals a potential increase in project budget, a lag in the project schedule, and identifies problems related to resource leveling and project quality. The report concludes with an executive summary for the project sponsor, highlighting key findings and recommendations for project improvement.

Running head: PROJECT MANAGEMENT
Xemba Translations Case Study
Name of the Student:
Name of the University:
Xemba Translations Case Study
Name of the Student:
Name of the University:
Paraphrase This Document
Need a fresh take? Get an instant paraphrase of this document with our AI Paraphraser
2PROJECT MANAGEMENT
Table of Contents
A. Risk Assessment Matrix.....................................................................................................1
B. Performance measurement metrics....................................................................................4
1. Justification of metrics appropriate to use for Xemba Translations Project......................5
2. Interpretation of current performance of project based on calculations............................7
3. Three problems based on project performance metrics...................................................12
a. Identification of problems............................................................................................12
C. Executive Summary for the project sponsor....................................................................13
References................................................................................................................................16
1PROJECT MANAGEMENT
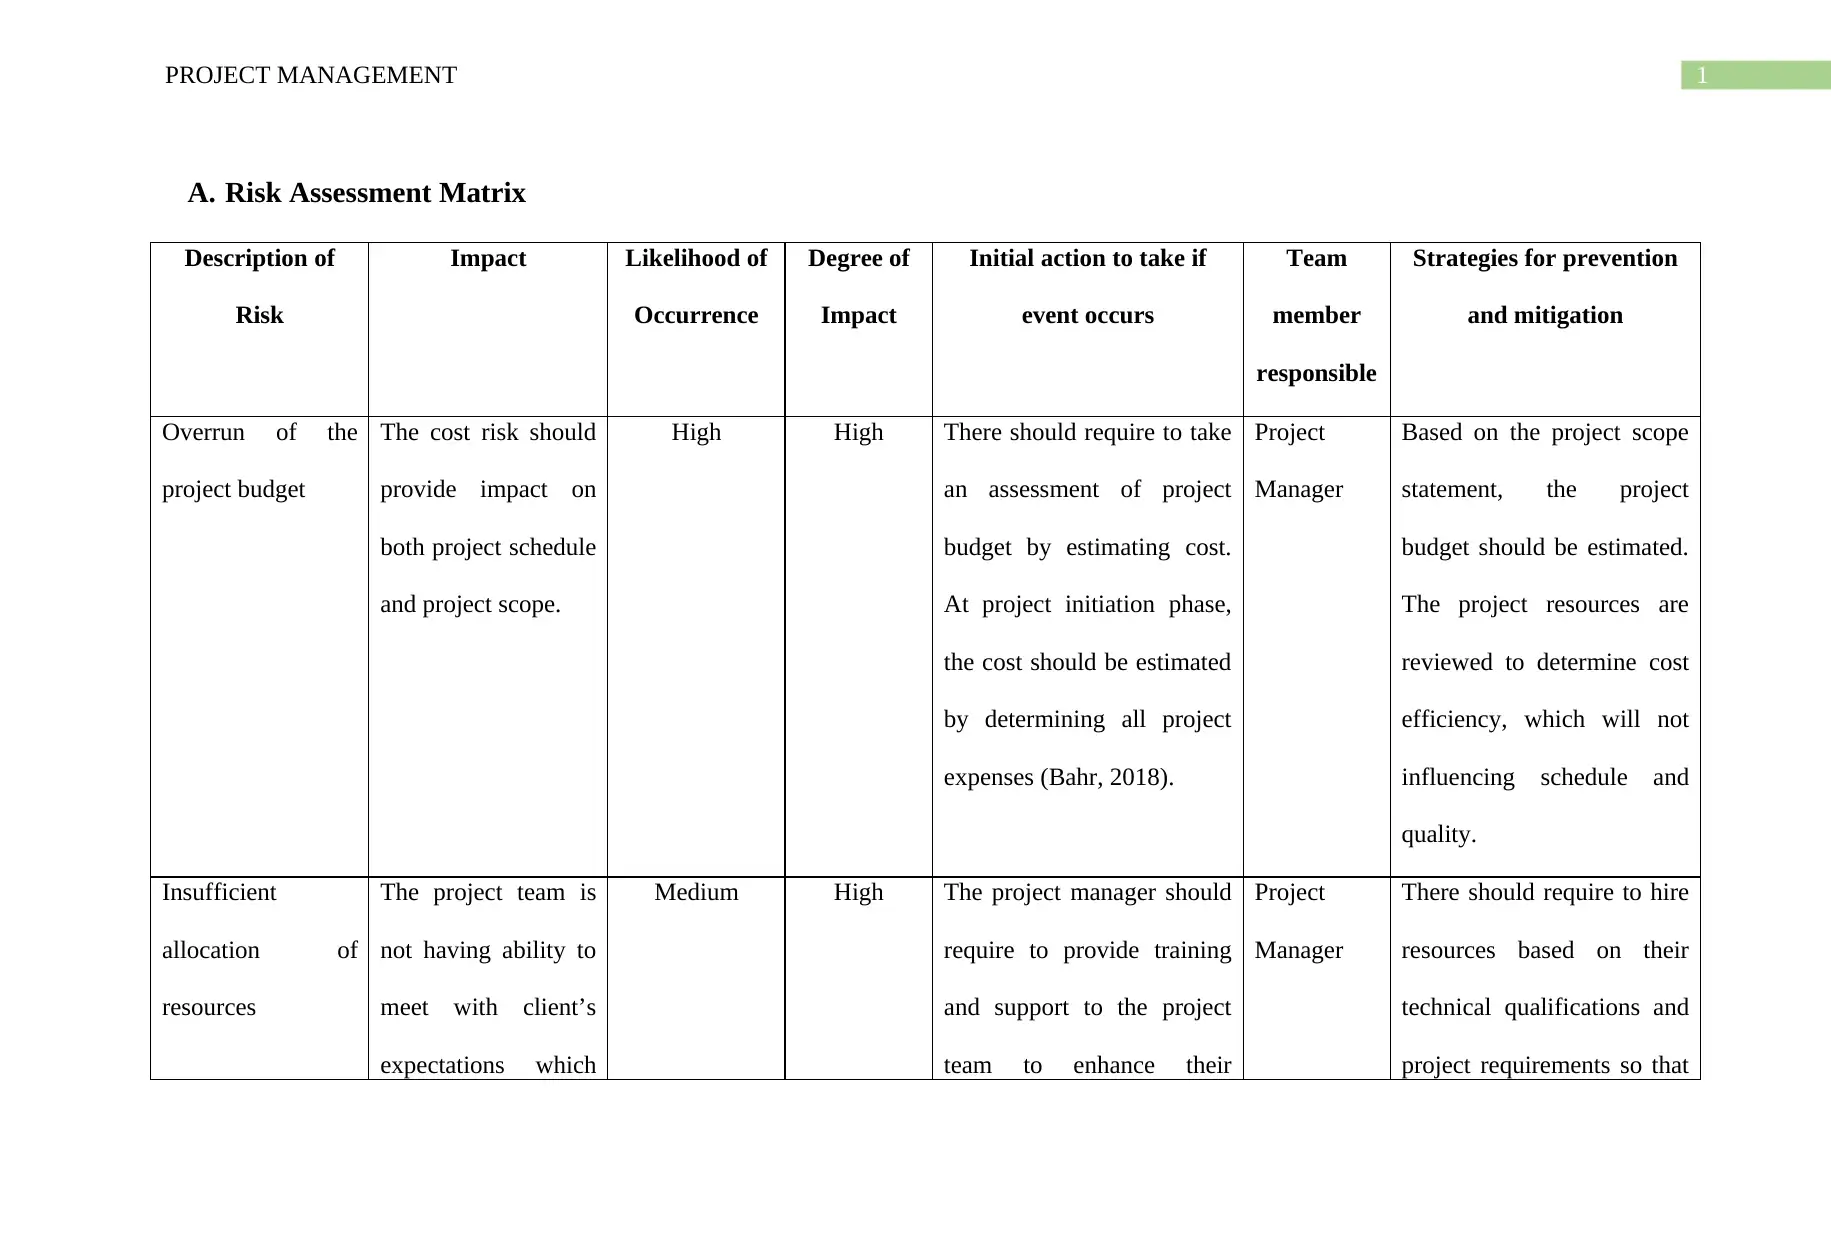
A. Risk Assessment Matrix
Description of
Risk
Impact Likelihood of
Occurrence
Degree of
Impact
Initial action to take if
event occurs
Team
member
responsible
Strategies for prevention
and mitigation
Overrun of the
project budget
The cost risk should
provide impact on
both project schedule
and project scope.
High High There should require to take
an assessment of project
budget by estimating cost.
At project initiation phase,
the cost should be estimated
by determining all project
expenses (Bahr, 2018).
Project
Manager
Based on the project scope
statement, the project
budget should be estimated.
The project resources are
reviewed to determine cost
efficiency, which will not
influencing schedule and
quality.
Insufficient
allocation of
resources
The project team is
not having ability to
meet with client’s
expectations which
Medium High The project manager should
require to provide training
and support to the project
team to enhance their
Project
Manager
There should require to hire
resources based on their
technical qualifications and
project requirements so that
⊘ This is a preview!⊘
Do you want full access?
Subscribe today to unlock all pages.
Trusted by 1+ million students worldwide
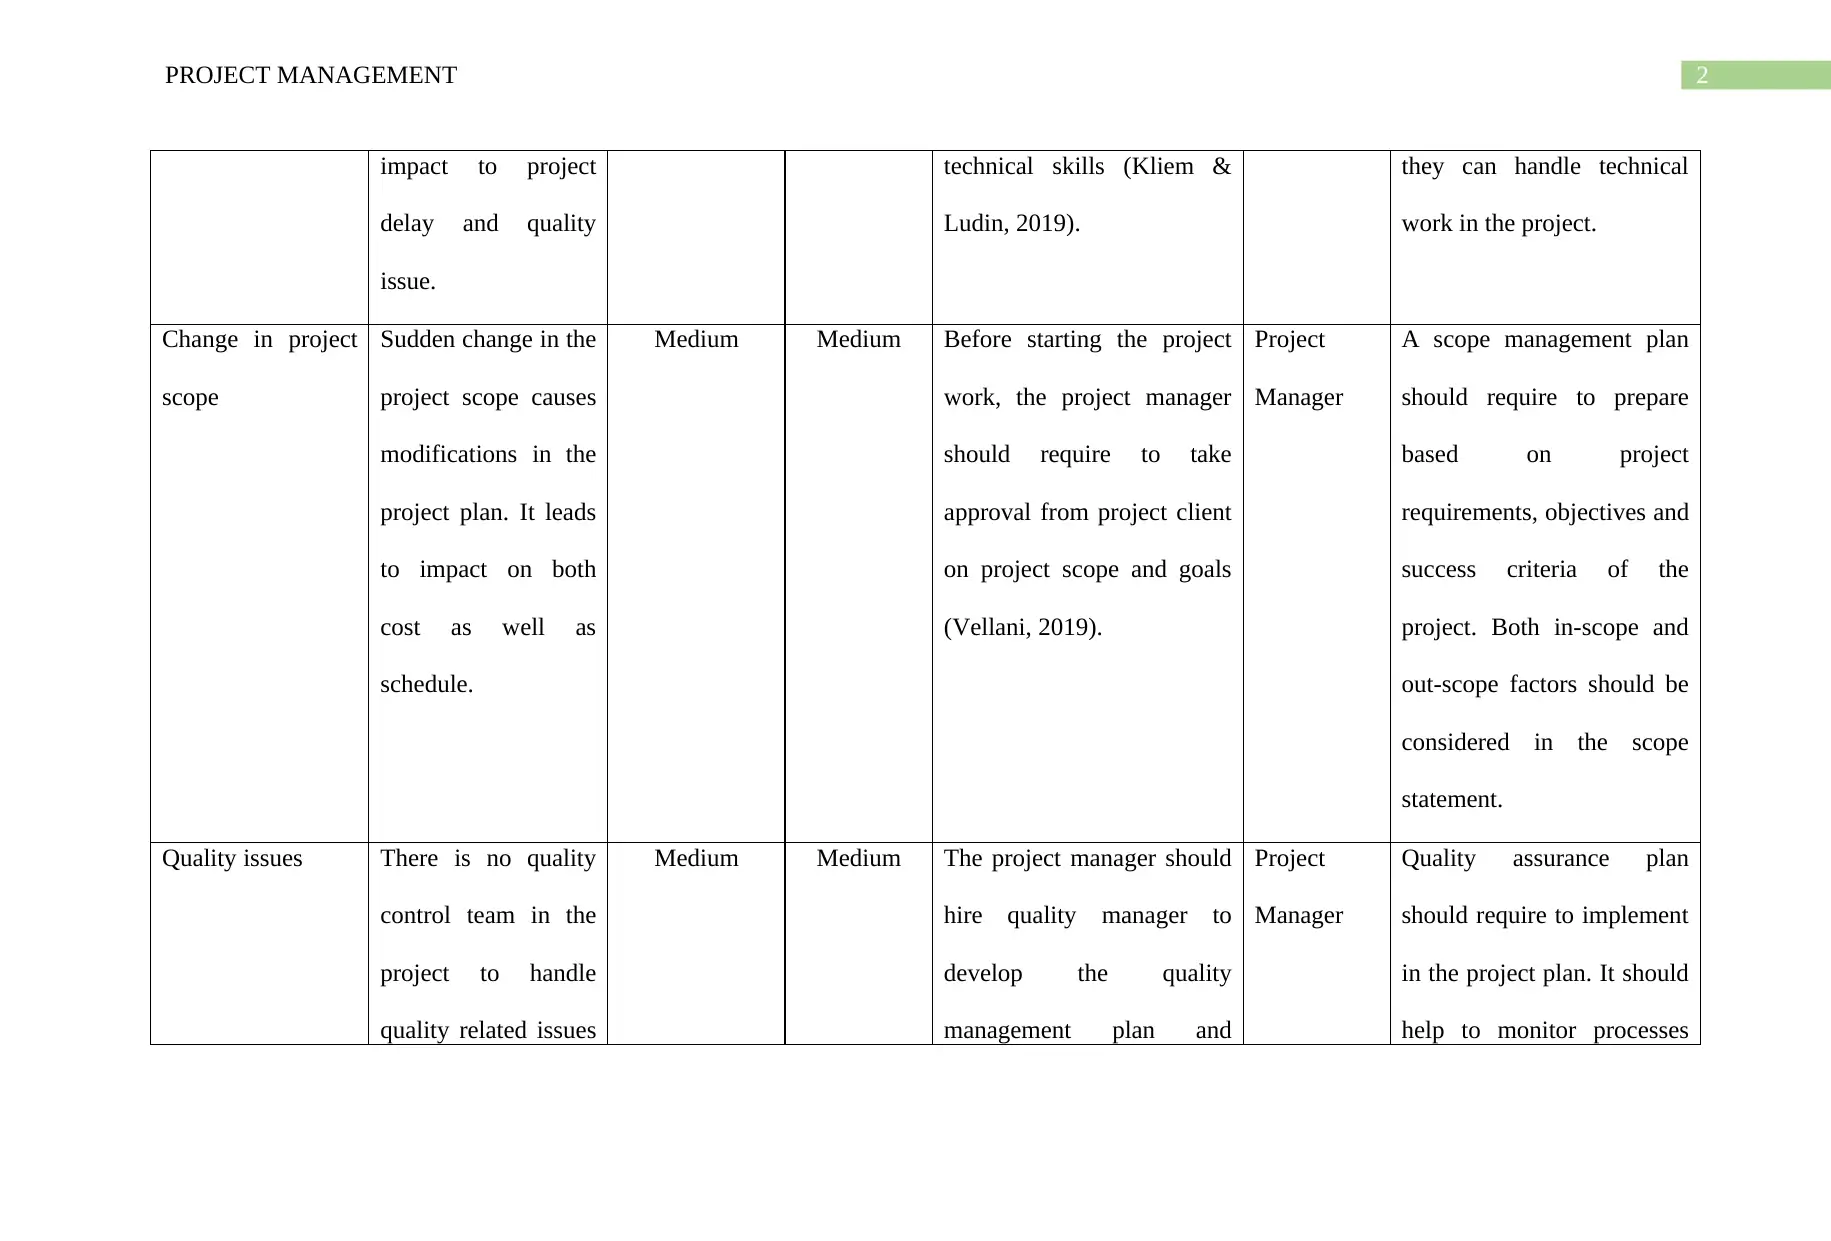
2PROJECT MANAGEMENT
impact to project
delay and quality
issue.
technical skills (Kliem &
Ludin, 2019).
they can handle technical
work in the project.
Change in project
scope
Sudden change in the
project scope causes
modifications in the
project plan. It leads
to impact on both
cost as well as
schedule.
Medium Medium Before starting the project
work, the project manager
should require to take
approval from project client
on project scope and goals
(Vellani, 2019).
Project
Manager
A scope management plan
should require to prepare
based on project
requirements, objectives and
success criteria of the
project. Both in-scope and
out-scope factors should be
considered in the scope
statement.
Quality issues There is no quality
control team in the
project to handle
quality related issues
Medium Medium The project manager should
hire quality manager to
develop the quality
management plan and
Project
Manager
Quality assurance plan
should require to implement
in the project plan. It should
help to monitor processes
Paraphrase This Document
Need a fresh take? Get an instant paraphrase of this document with our AI Paraphraser
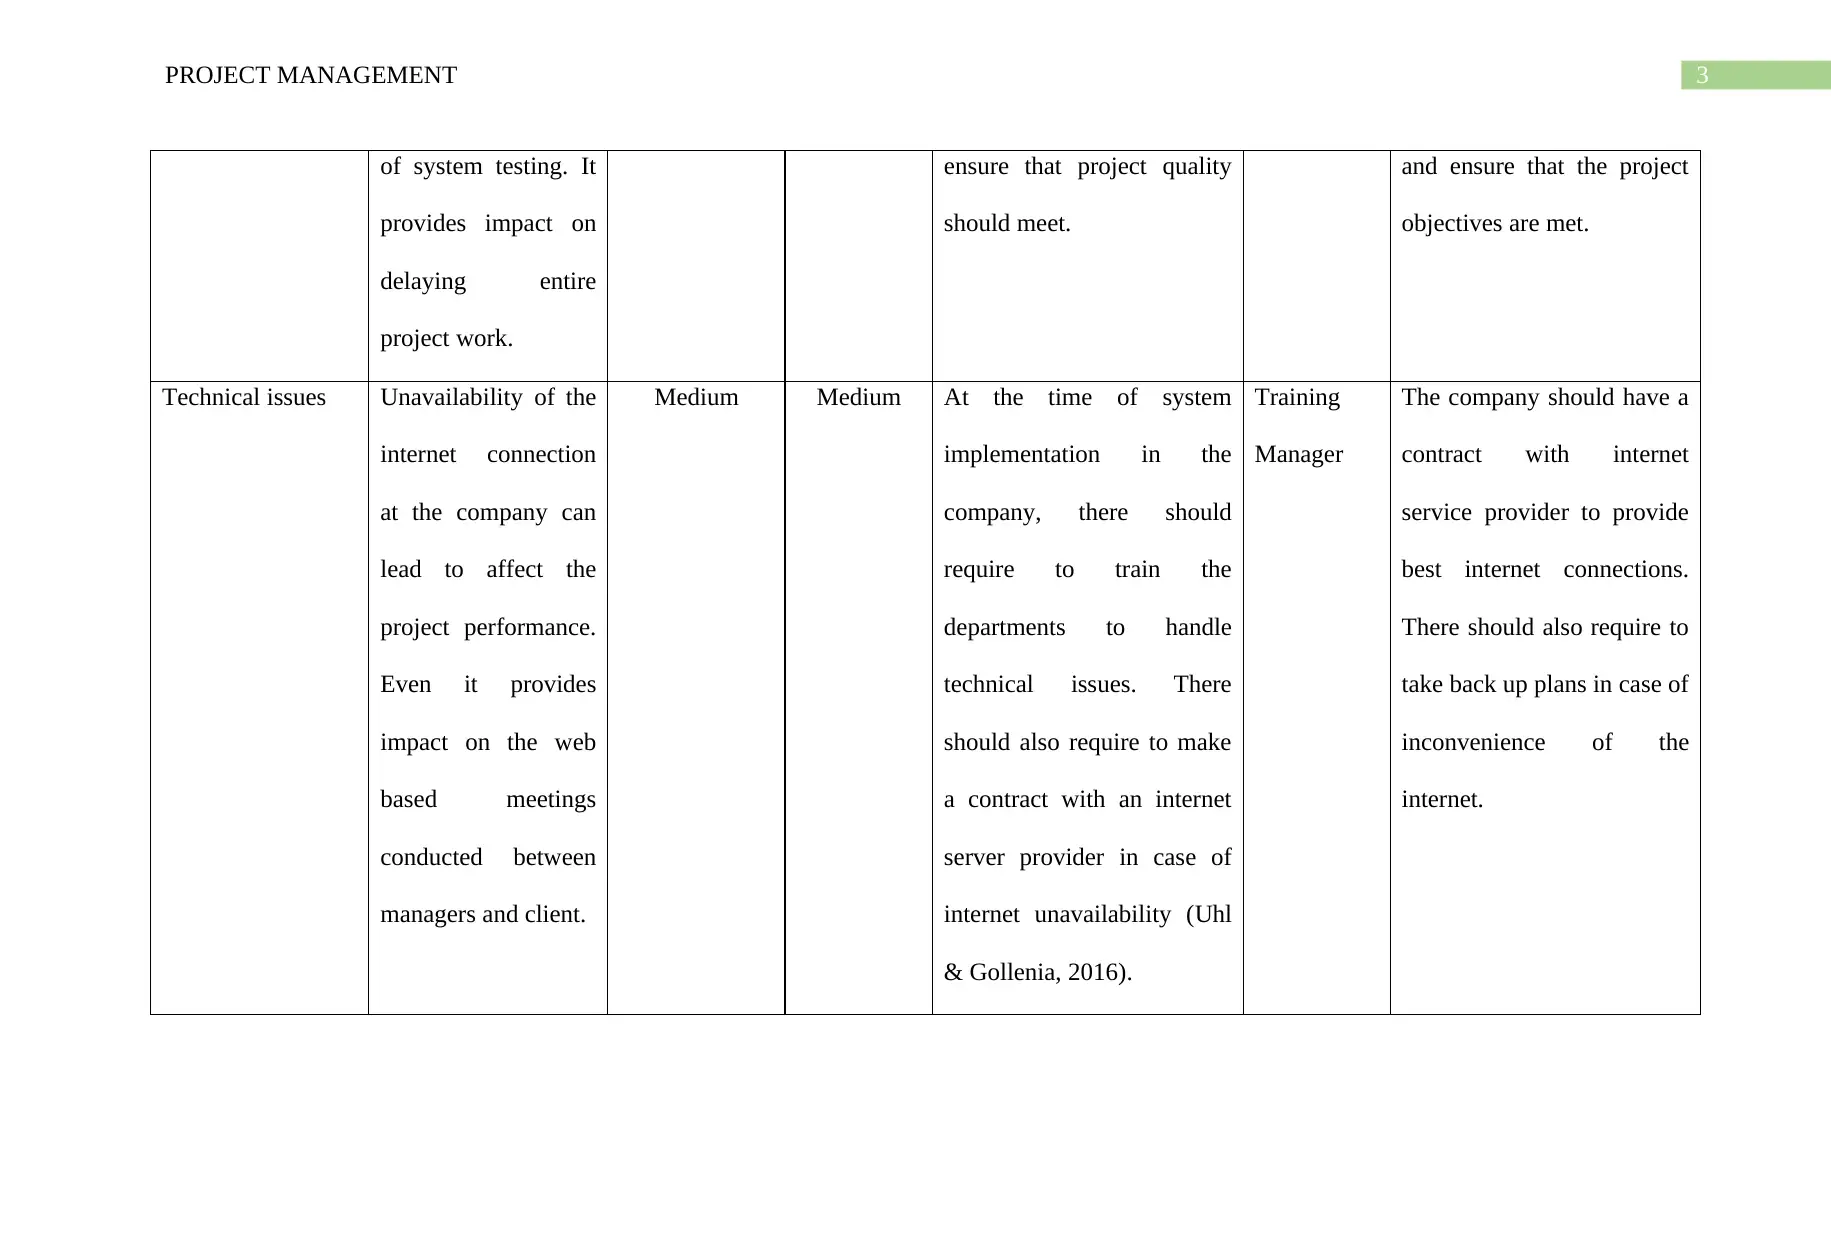
3PROJECT MANAGEMENT
of system testing. It
provides impact on
delaying entire
project work.
ensure that project quality
should meet.
and ensure that the project
objectives are met.
Technical issues Unavailability of the
internet connection
at the company can
lead to affect the
project performance.
Even it provides
impact on the web
based meetings
conducted between
managers and client.
Medium Medium At the time of system
implementation in the
company, there should
require to train the
departments to handle
technical issues. There
should also require to make
a contract with an internet
server provider in case of
internet unavailability (Uhl
& Gollenia, 2016).
Training
Manager
The company should have a
contract with internet
service provider to provide
best internet connections.
There should also require to
take back up plans in case of
inconvenience of the
internet.
4PROJECT MANAGEMENT
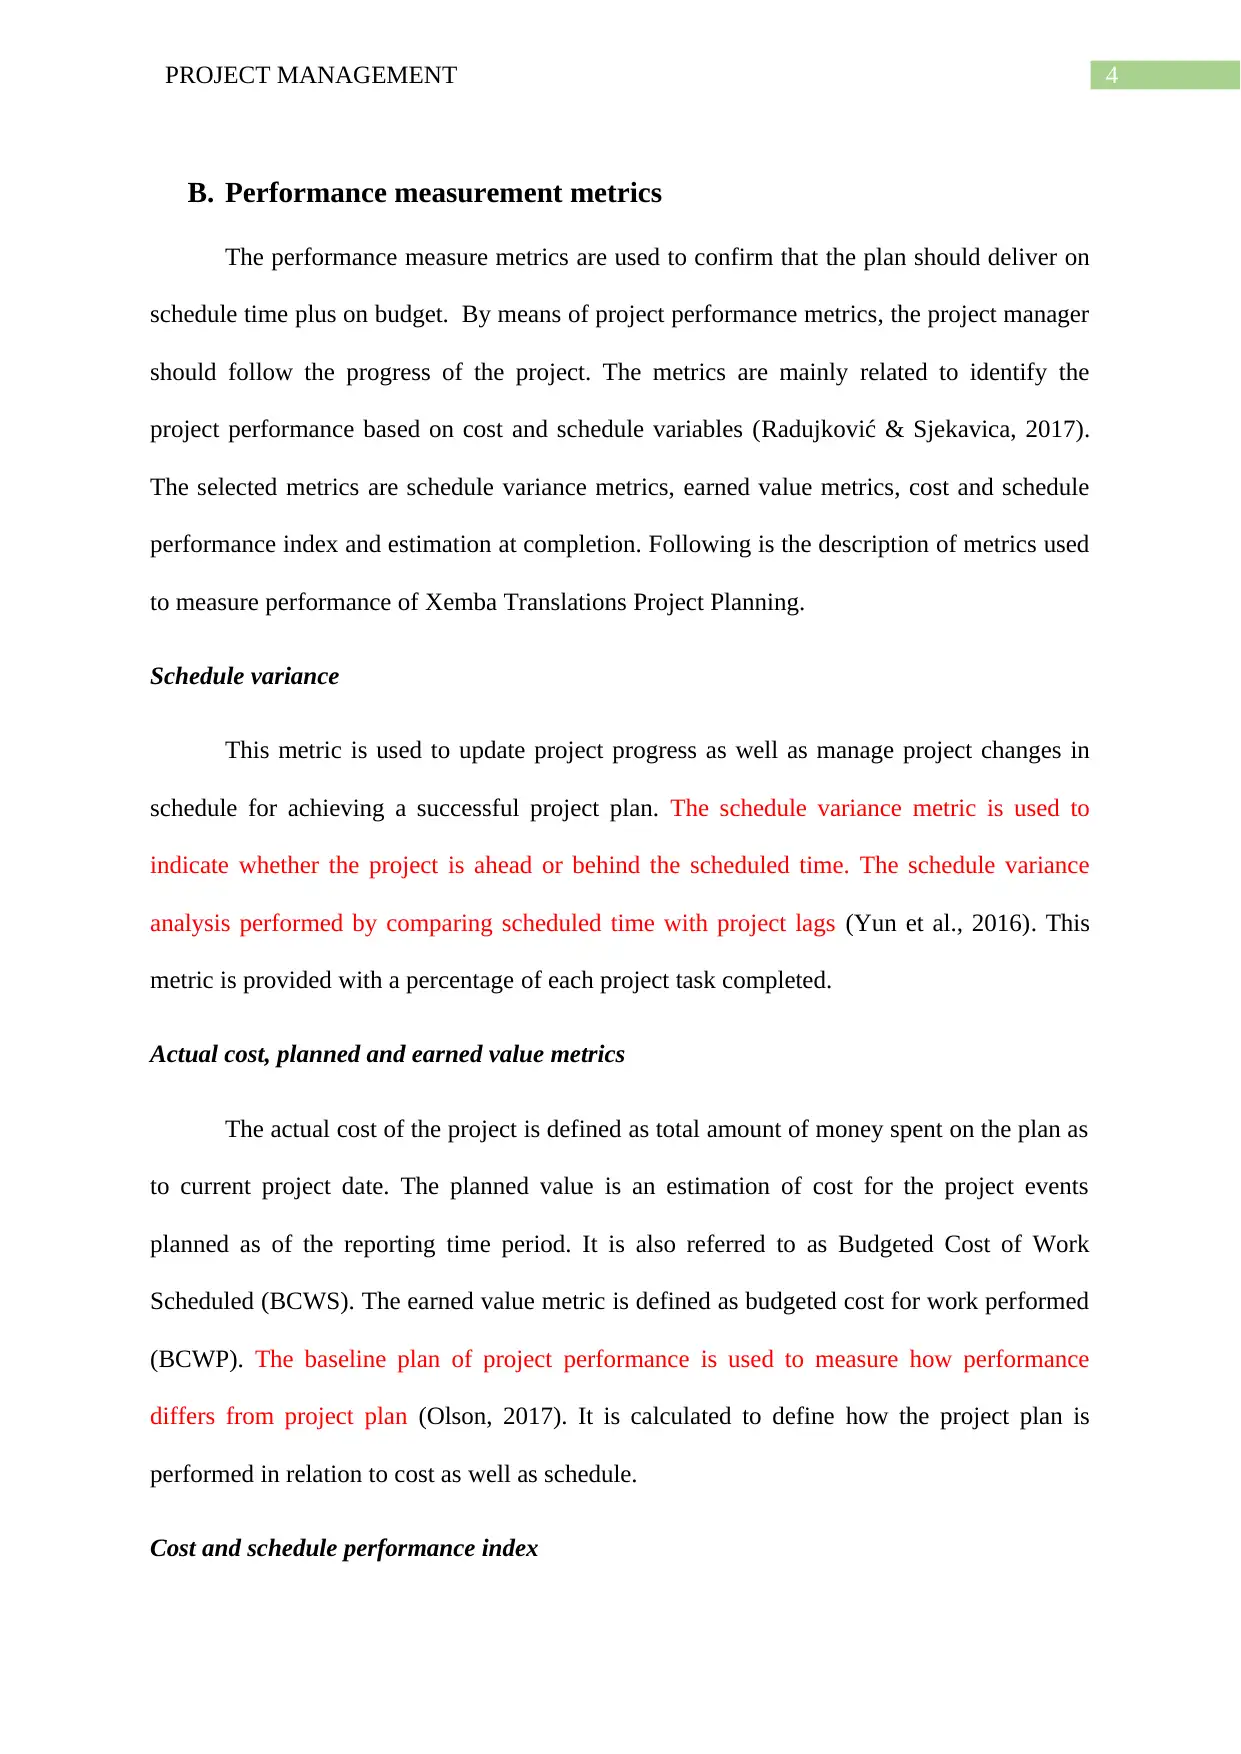
B. Performance measurement metrics
The performance measure metrics are used to confirm that the plan should deliver on
schedule time plus on budget. By means of project performance metrics, the project manager
should follow the progress of the project. The metrics are mainly related to identify the
project performance based on cost and schedule variables (Radujković & Sjekavica, 2017).
The selected metrics are schedule variance metrics, earned value metrics, cost and schedule
performance index and estimation at completion. Following is the description of metrics used
to measure performance of Xemba Translations Project Planning.
Schedule variance
This metric is used to update project progress as well as manage project changes in
schedule for achieving a successful project plan. The schedule variance metric is used to
indicate whether the project is ahead or behind the scheduled time. The schedule variance
analysis performed by comparing scheduled time with project lags (Yun et al., 2016). This
metric is provided with a percentage of each project task completed.
Actual cost, planned and earned value metrics
The actual cost of the project is defined as total amount of money spent on the plan as
to current project date. The planned value is an estimation of cost for the project events
planned as of the reporting time period. It is also referred to as Budgeted Cost of Work
Scheduled (BCWS). The earned value metric is defined as budgeted cost for work performed
(BCWP). The baseline plan of project performance is used to measure how performance
differs from project plan (Olson, 2017). It is calculated to define how the project plan is
performed in relation to cost as well as schedule.
Cost and schedule performance index
⊘ This is a preview!⊘
Do you want full access?
Subscribe today to unlock all pages.
Trusted by 1+ million students worldwide
5PROJECT MANAGEMENT
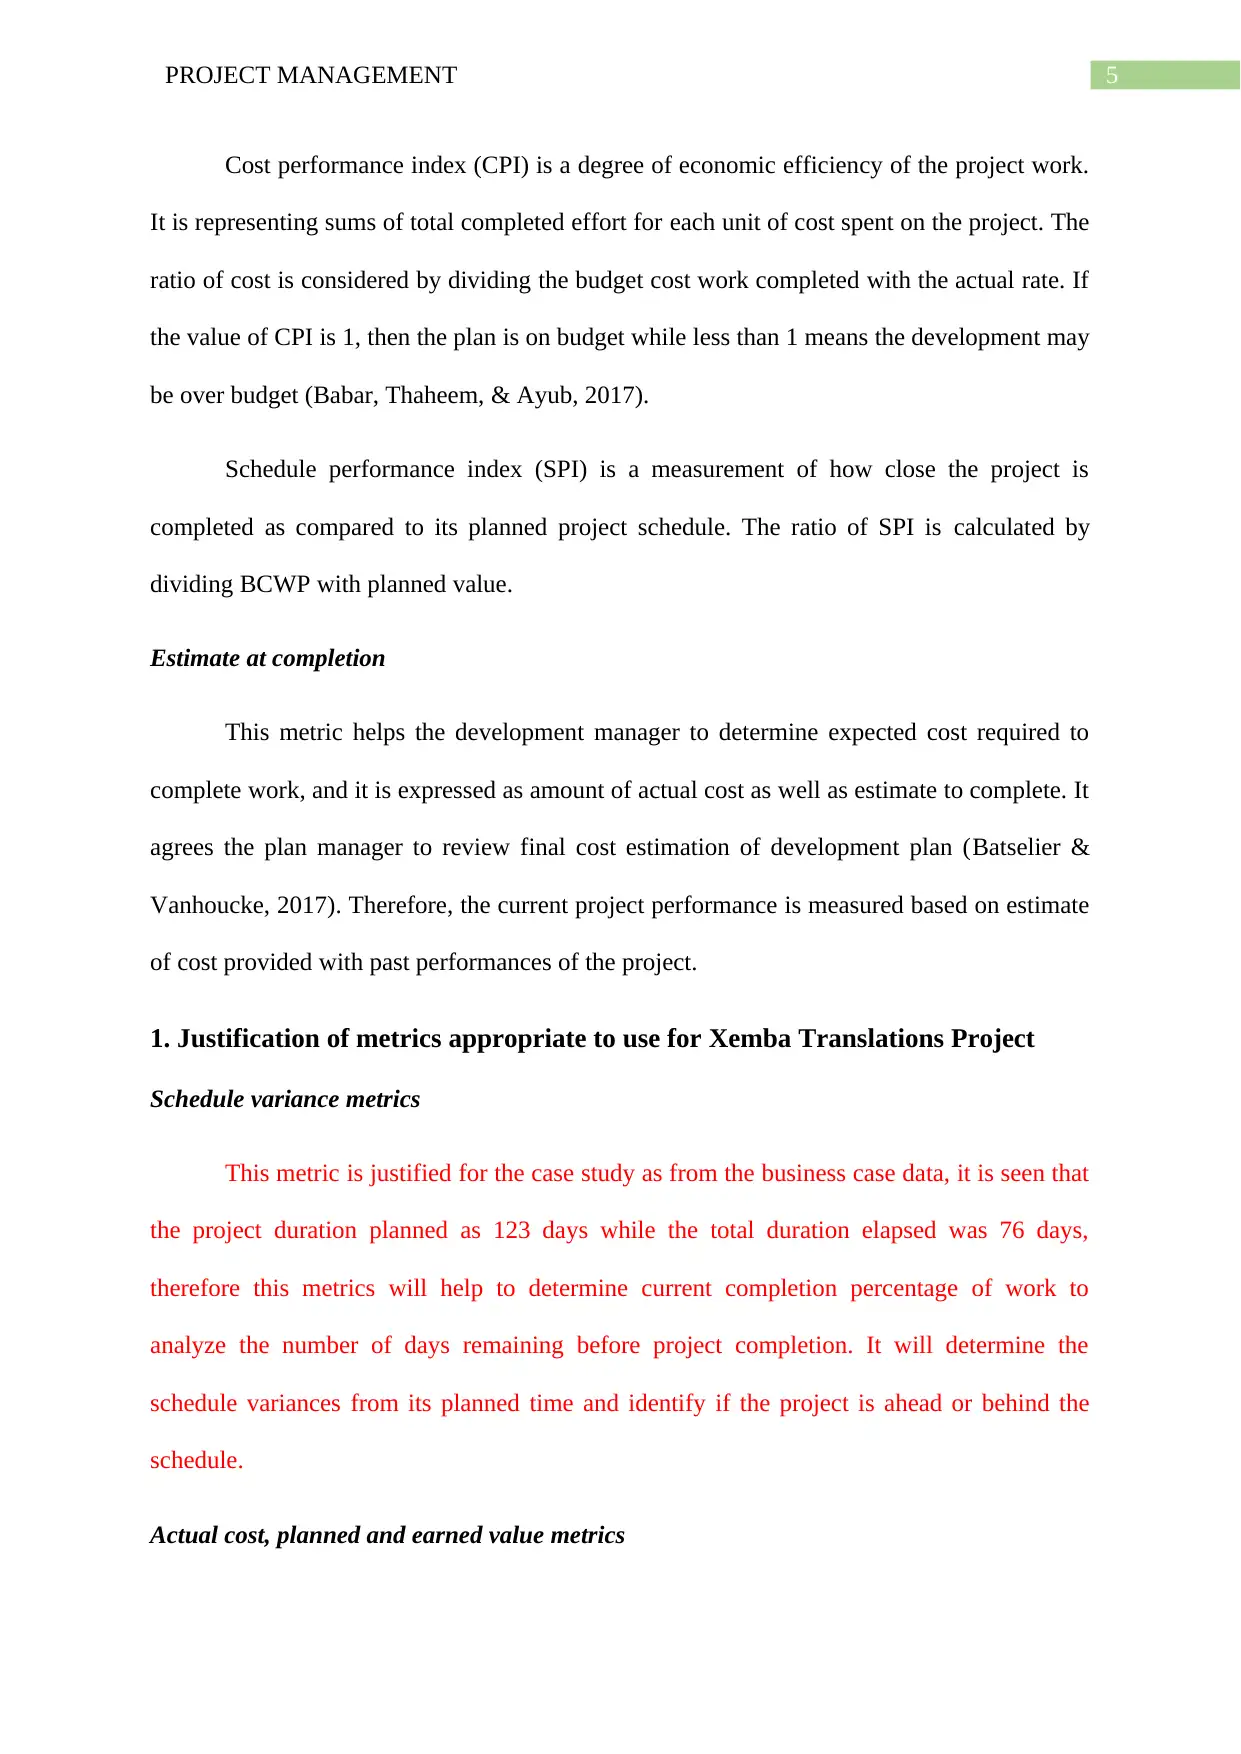
Cost performance index (CPI) is a degree of economic efficiency of the project work.
It is representing sums of total completed effort for each unit of cost spent on the project. The
ratio of cost is considered by dividing the budget cost work completed with the actual rate. If
the value of CPI is 1, then the plan is on budget while less than 1 means the development may
be over budget (Babar, Thaheem, & Ayub, 2017).
Schedule performance index (SPI) is a measurement of how close the project is
completed as compared to its planned project schedule. The ratio of SPI is calculated by
dividing BCWP with planned value.
Estimate at completion
This metric helps the development manager to determine expected cost required to
complete work, and it is expressed as amount of actual cost as well as estimate to complete. It
agrees the plan manager to review final cost estimation of development plan (Batselier &
Vanhoucke, 2017). Therefore, the current project performance is measured based on estimate
of cost provided with past performances of the project.
1. Justification of metrics appropriate to use for Xemba Translations Project
Schedule variance metrics
This metric is justified for the case study as from the business case data, it is seen that
the project duration planned as 123 days while the total duration elapsed was 76 days,
therefore this metrics will help to determine current completion percentage of work to
analyze the number of days remaining before project completion. It will determine the
schedule variances from its planned time and identify if the project is ahead or behind the
schedule.
Actual cost, planned and earned value metrics
Paraphrase This Document
Need a fresh take? Get an instant paraphrase of this document with our AI Paraphraser
6PROJECT MANAGEMENT
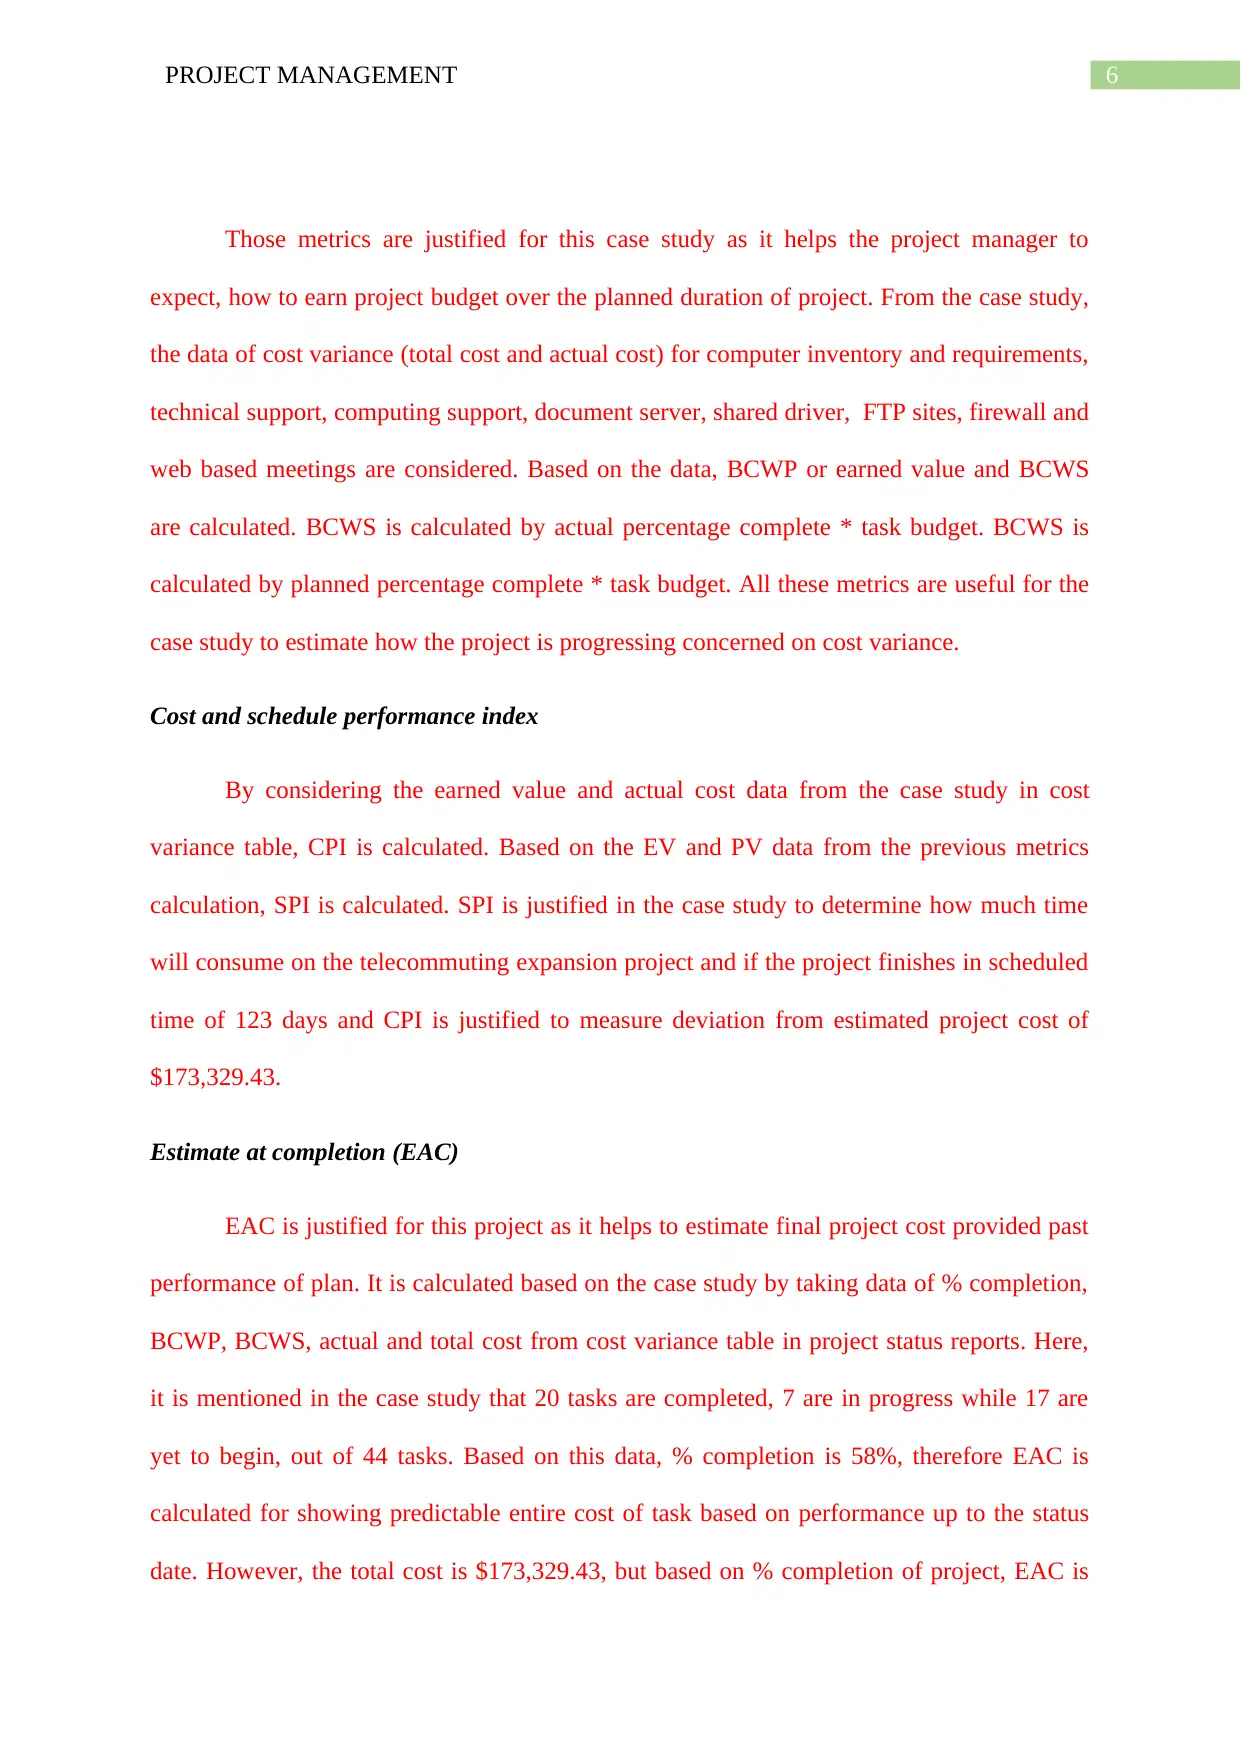
Those metrics are justified for this case study as it helps the project manager to
expect, how to earn project budget over the planned duration of project. From the case study,
the data of cost variance (total cost and actual cost) for computer inventory and requirements,
technical support, computing support, document server, shared driver, FTP sites, firewall and
web based meetings are considered. Based on the data, BCWP or earned value and BCWS
are calculated. BCWS is calculated by actual percentage complete * task budget. BCWS is
calculated by planned percentage complete * task budget. All these metrics are useful for the
case study to estimate how the project is progressing concerned on cost variance.
Cost and schedule performance index
By considering the earned value and actual cost data from the case study in cost
variance table, CPI is calculated. Based on the EV and PV data from the previous metrics
calculation, SPI is calculated. SPI is justified in the case study to determine how much time
will consume on the telecommuting expansion project and if the project finishes in scheduled
time of 123 days and CPI is justified to measure deviation from estimated project cost of
$173,329.43.
Estimate at completion (EAC)
EAC is justified for this project as it helps to estimate final project cost provided past
performance of plan. It is calculated based on the case study by taking data of % completion,
BCWP, BCWS, actual and total cost from cost variance table in project status reports. Here,
it is mentioned in the case study that 20 tasks are completed, 7 are in progress while 17 are
yet to begin, out of 44 tasks. Based on this data, % completion is 58%, therefore EAC is
calculated for showing predictable entire cost of task based on performance up to the status
date. However, the total cost is $173,329.43, but based on % completion of project, EAC is
7PROJECT MANAGEMENT
calculated. Till the status time of 58%, the actual cost is $93,771.83, therefore there is
estimation of total cost to determine if the budget is overrun or within estimated cost.
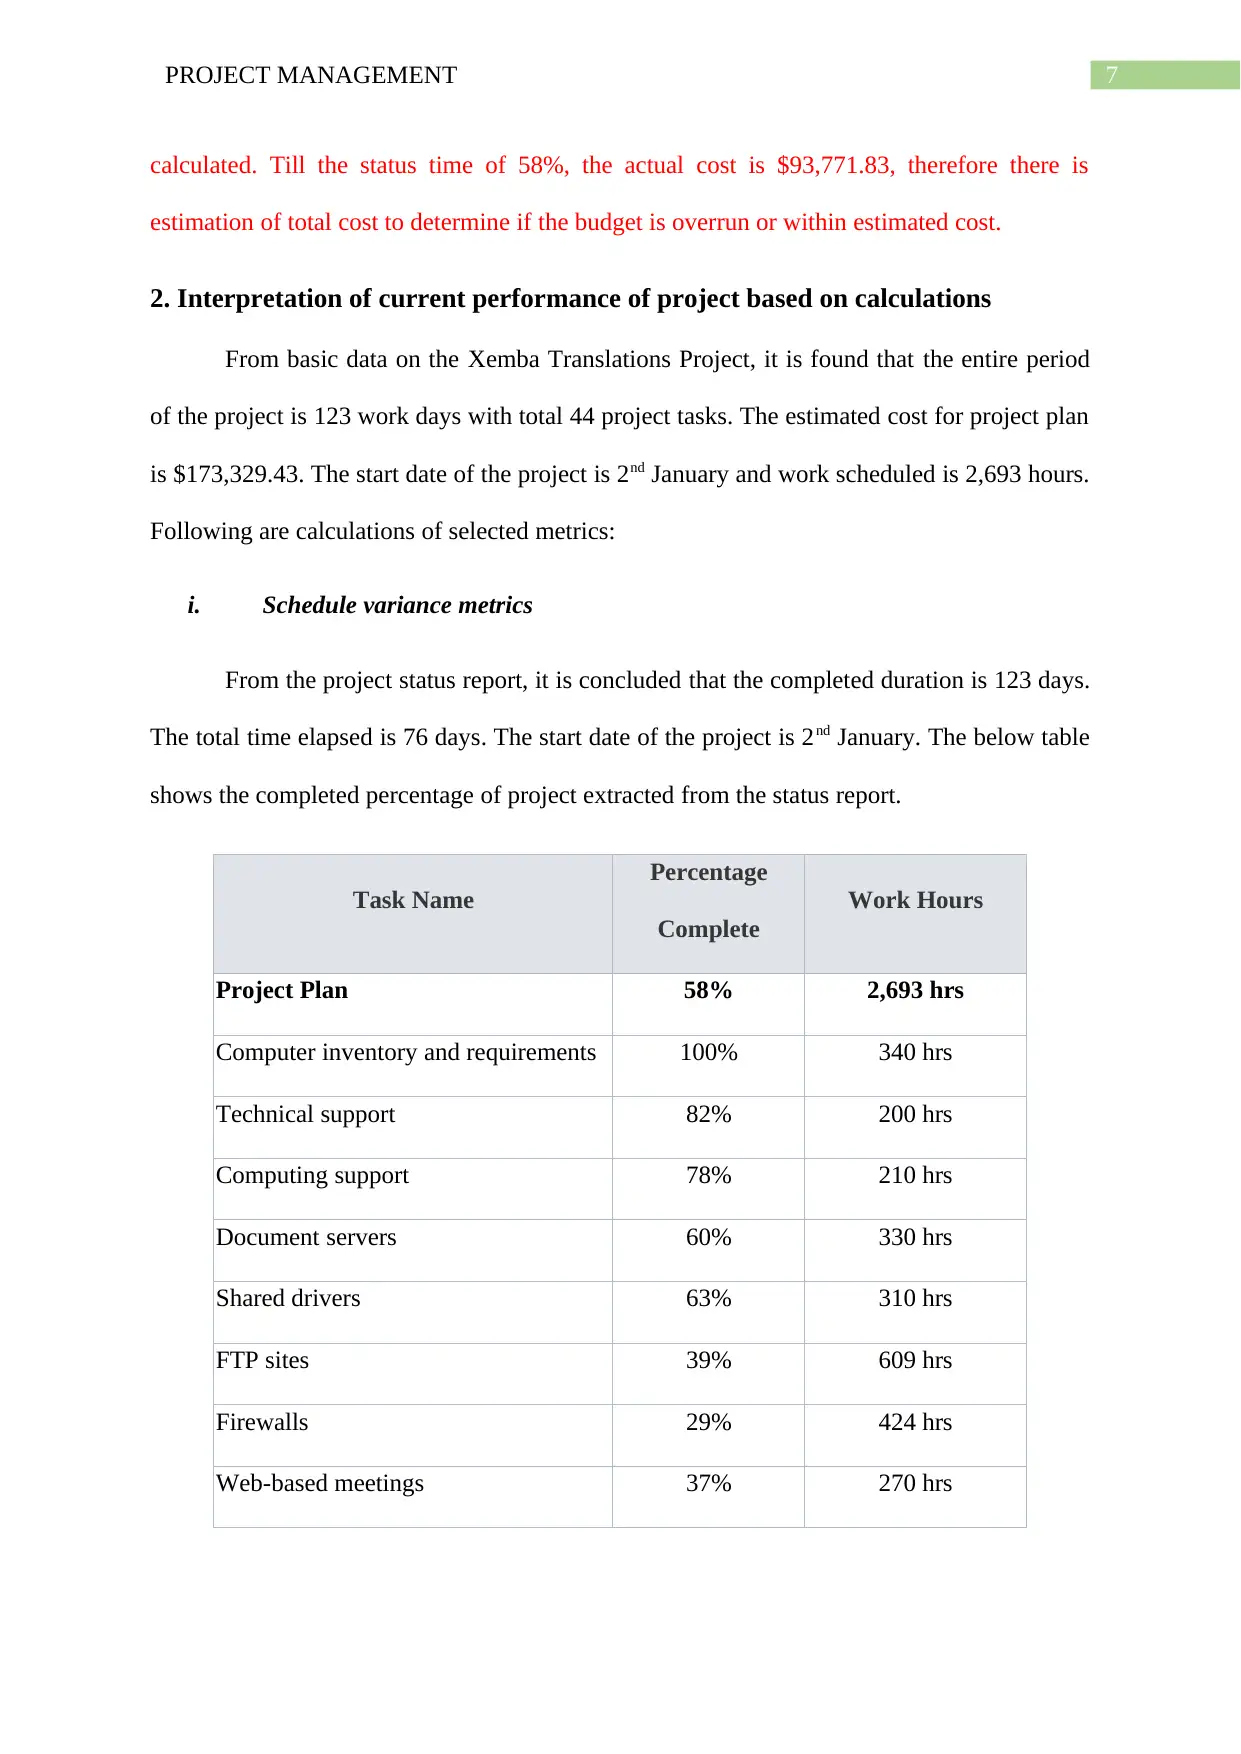
2. Interpretation of current performance of project based on calculations
From basic data on the Xemba Translations Project, it is found that the entire period
of the project is 123 work days with total 44 project tasks. The estimated cost for project plan
is $173,329.43. The start date of the project is 2nd January and work scheduled is 2,693 hours.
Following are calculations of selected metrics:
i. Schedule variance metrics
From the project status report, it is concluded that the completed duration is 123 days.
The total time elapsed is 76 days. The start date of the project is 2nd January. The below table
shows the completed percentage of project extracted from the status report.
Task Name
Percentage
Complete
Work Hours
Project Plan 58% 2,693 hrs
Computer inventory and requirements 100% 340 hrs
Technical support 82% 200 hrs
Computing support 78% 210 hrs
Document servers 60% 330 hrs
Shared drivers 63% 310 hrs
FTP sites 39% 609 hrs
Firewalls 29% 424 hrs
Web-based meetings 37% 270 hrs
calculated. Till the status time of 58%, the actual cost is $93,771.83, therefore there is
estimation of total cost to determine if the budget is overrun or within estimated cost.
2. Interpretation of current performance of project based on calculations
From basic data on the Xemba Translations Project, it is found that the entire period
of the project is 123 work days with total 44 project tasks. The estimated cost for project plan
is $173,329.43. The start date of the project is 2nd January and work scheduled is 2,693 hours.
Following are calculations of selected metrics:
i. Schedule variance metrics
From the project status report, it is concluded that the completed duration is 123 days.
The total time elapsed is 76 days. The start date of the project is 2nd January. The below table
shows the completed percentage of project extracted from the status report.
Task Name
Percentage
Complete
Work Hours
Project Plan 58% 2,693 hrs
Computer inventory and requirements 100% 340 hrs
Technical support 82% 200 hrs
Computing support 78% 210 hrs
Document servers 60% 330 hrs
Shared drivers 63% 310 hrs
FTP sites 39% 609 hrs
Firewalls 29% 424 hrs
Web-based meetings 37% 270 hrs
⊘ This is a preview!⊘
Do you want full access?
Subscribe today to unlock all pages.
Trusted by 1+ million students worldwide
8PROJECT MANAGEMENT
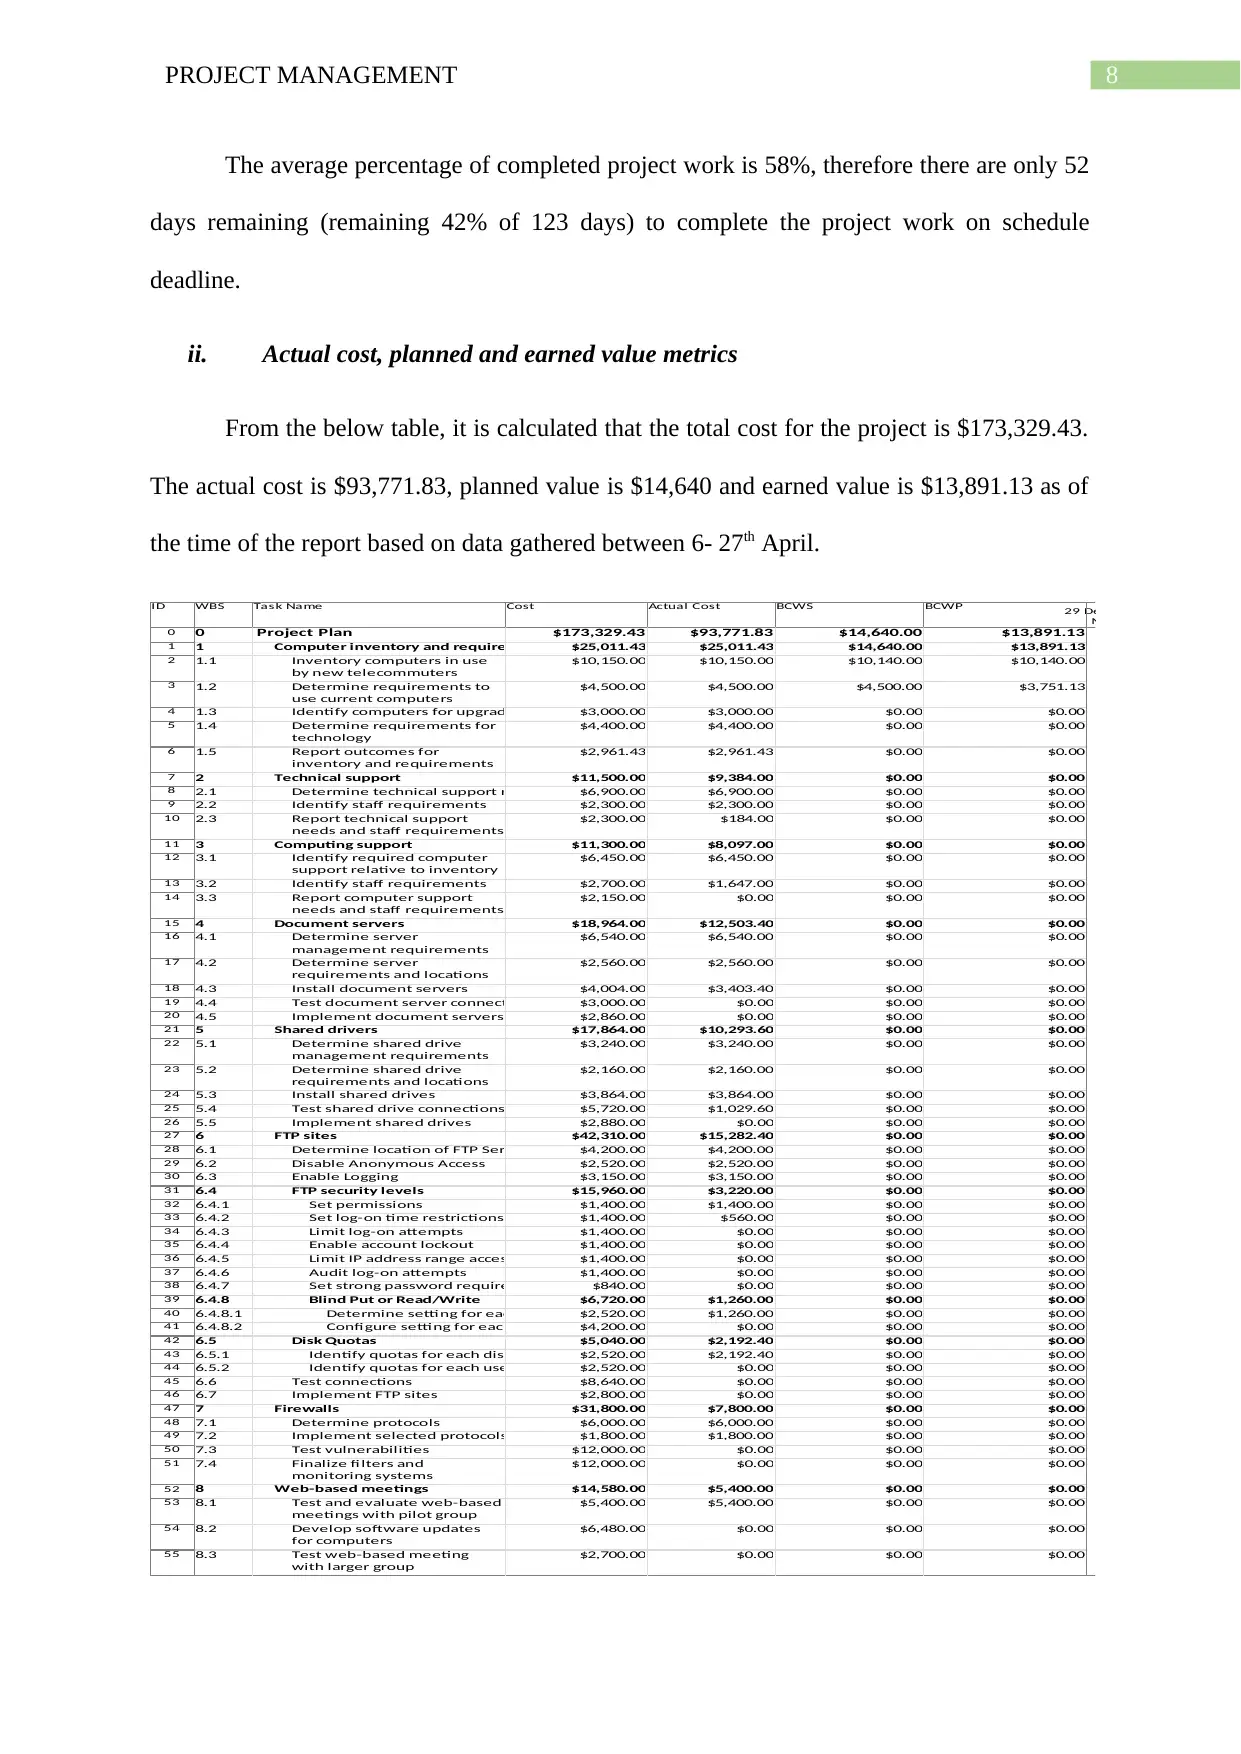
The average percentage of completed project work is 58%, therefore there are only 52
days remaining (remaining 42% of 123 days) to complete the project work on schedule
deadline.
ii. Actual cost, planned and earned value metrics
From the below table, it is calculated that the total cost for the project is $173,329.43.
The actual cost is $93,771.83, planned value is $14,640 and earned value is $13,891.13 as of
the time of the report based on data gathered between 6- 27th April.
ID WBS Task Name Cost Actual Cost BCWS BCWP
0 0 Project Plan $173,329.43 $93,771.83 $14,640.00 $13,891.13
1 1 Computer inventory and requirements $25,011.43 $25,011.43 $14,640.00 $13,891.13
2 1.1 Inventory computers in use
by new telecommuters
$10,150.00 $10,150.00 $10,140.00 $10,140.00
3 1.2 Determine requirements to
use current computers
$4,500.00 $4,500.00 $4,500.00 $3,751.13
4 1.3 Identify computers for upgrade $3,000.00 $3,000.00 $0.00 $0.00
5 1.4 Determine requirements for
technology
$4,400.00 $4,400.00 $0.00 $0.00
6 1.5 Report outcomes for
inventory and requirements
$2,961.43 $2,961.43 $0.00 $0.00
7 2 Technical support $11,500.00 $9,384.00 $0.00 $0.00
8 2.1 Determine technical support needed $6,900.00 $6,900.00 $0.00 $0.00
9 2.2 Identify staff requirements $2,300.00 $2,300.00 $0.00 $0.00
10 2.3 Report technical support
needs and staff requirements
$2,300.00 $184.00 $0.00 $0.00
11 3 Computing support $11,300.00 $8,097.00 $0.00 $0.00
12 3.1 Identify required computer
support relative to inventory
$6,450.00 $6,450.00 $0.00 $0.00
13 3.2 Identify staff requirements $2,700.00 $1,647.00 $0.00 $0.00
14 3.3 Report computer support
needs and staff requirements
$2,150.00 $0.00 $0.00 $0.00
15 4 Document servers $18,964.00 $12,503.40 $0.00 $0.00
16 4.1 Determine server
management requirements
$6,540.00 $6,540.00 $0.00 $0.00
17 4.2 Determine server
requirements and locations
$2,560.00 $2,560.00 $0.00 $0.00
18 4.3 Install document servers $4,004.00 $3,403.40 $0.00 $0.00
19 4.4 Test document server connections $3,000.00 $0.00 $0.00 $0.00
20 4.5 Implement document servers $2,860.00 $0.00 $0.00 $0.00
21 5 Shared drivers $17,864.00 $10,293.60 $0.00 $0.00
22 5.1 Determine shared drive
management requirements
$3,240.00 $3,240.00 $0.00 $0.00
23 5.2 Determine shared drive
requirements and locations
$2,160.00 $2,160.00 $0.00 $0.00
24 5.3 Install shared drives $3,864.00 $3,864.00 $0.00 $0.00
25 5.4 Test shared drive connections $5,720.00 $1,029.60 $0.00 $0.00
26 5.5 Implement shared drives $2,880.00 $0.00 $0.00 $0.00
27 6 FTP sites $42,310.00 $15,282.40 $0.00 $0.00
28 6.1 Determine location of FTP Services $4,200.00 $4,200.00 $0.00 $0.00
29 6.2 Disable Anonymous Access $2,520.00 $2,520.00 $0.00 $0.00
30 6.3 Enable Logging $3,150.00 $3,150.00 $0.00 $0.00
31 6.4 FTP security levels $15,960.00 $3,220.00 $0.00 $0.00
32 6.4.1 Set permissions $1,400.00 $1,400.00 $0.00 $0.00
33 6.4.2 Set log-on time restrictions $1,400.00 $560.00 $0.00 $0.00
34 6.4.3 Limit log-on attempts $1,400.00 $0.00 $0.00 $0.00
35 6.4.4 Enable account lockout $1,400.00 $0.00 $0.00 $0.00
36 6.4.5 Limit IP address range access $1,400.00 $0.00 $0.00 $0.00
37 6.4.6 Audit log-on attempts $1,400.00 $0.00 $0.00 $0.00
38 6.4.7 Set strong password requirement $840.00 $0.00 $0.00 $0.00
39 6.4.8 Blind Put or Read/Write $6,720.00 $1,260.00 $0.00 $0.00
40 6.4.8.1 Determine setting for each user $2,520.00 $1,260.00 $0.00 $0.00
41 6.4.8.2 Configure setting for each user $4,200.00 $0.00 $0.00 $0.00
42 6.5 Disk Quotas $5,040.00 $2,192.40 $0.00 $0.00
43 6.5.1 Identify quotas for each disk $2,520.00 $2,192.40 $0.00 $0.00
44 6.5.2 Identify quotas for each user $2,520.00 $0.00 $0.00 $0.00
45 6.6 Test connections $8,640.00 $0.00 $0.00 $0.00
46 6.7 Implement FTP sites $2,800.00 $0.00 $0.00 $0.00
47 7 Firewalls $31,800.00 $7,800.00 $0.00 $0.00
48 7.1 Determine protocols $6,000.00 $6,000.00 $0.00 $0.00
49 7.2 Implement selected protocols $1,800.00 $1,800.00 $0.00 $0.00
50 7.3 Test vulnerabilities $12,000.00 $0.00 $0.00 $0.00
51 7.4 Finalize filters and
monitoring systems
$12,000.00 $0.00 $0.00 $0.00
52 8 Web-based meetings $14,580.00 $5,400.00 $0.00 $0.00
53 8.1 Test and evaluate web-based
meetings with pilot group
$5,400.00 $5,400.00 $0.00 $0.00
54 8.2 Develop software updates
for computers
$6,480.00 $0.00 $0.00 $0.00
55 8.3 Test web-based meeting
with larger group
$2,700.00 $0.00 $0.00 $0.00
M
29 Dec '19
Paraphrase This Document
Need a fresh take? Get an instant paraphrase of this document with our AI Paraphraser
9PROJECT MANAGEMENT
Figure 1: Actual cost, planned and earned value calculation
(Source: Created by author using MS project)
iii. Cost and schedule performance index
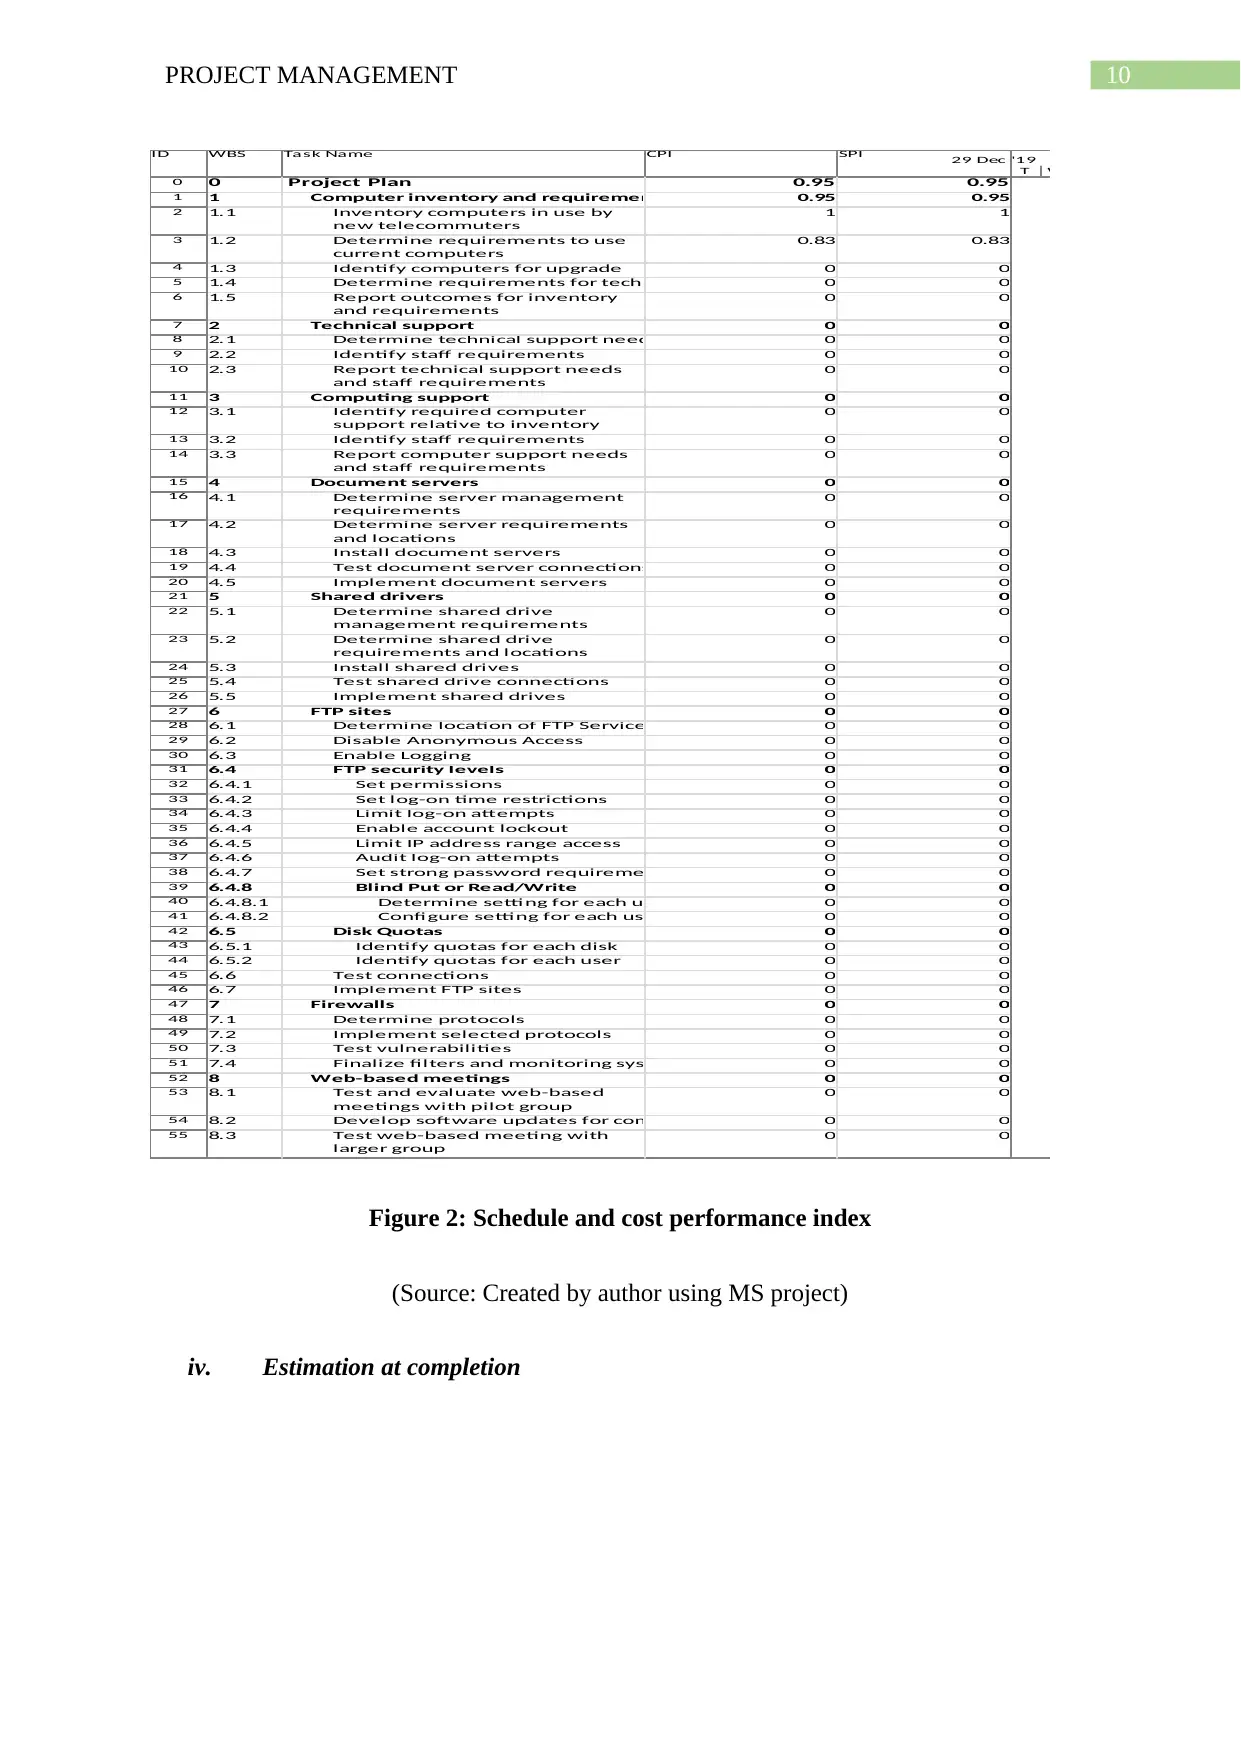
Value of CPI will determine the performance based on its project efficiency. From the
below table, it is seen that the CPI for this project plan is 0.95. As the value of CPI is less
than 1, therefore it indicates that there is a possibility to increase in project budget. Value of
SPI indicates effectiveness of the project. After tracking the project plan for the first four
weeks, it is seen that the project started to lag behind during 6th of March. It is recovered from
month of April and the data show that the project started to lag behind schedule plan date.
From the below table, it is calculated that SPI is 0.95, indicated that the estimated hour of
work, the project team is able to complete is 0.95 hours.
Figure 1: Actual cost, planned and earned value calculation
(Source: Created by author using MS project)
iii. Cost and schedule performance index
Value of CPI will determine the performance based on its project efficiency. From the
below table, it is seen that the CPI for this project plan is 0.95. As the value of CPI is less
than 1, therefore it indicates that there is a possibility to increase in project budget. Value of
SPI indicates effectiveness of the project. After tracking the project plan for the first four
weeks, it is seen that the project started to lag behind during 6th of March. It is recovered from
month of April and the data show that the project started to lag behind schedule plan date.
From the below table, it is calculated that SPI is 0.95, indicated that the estimated hour of
work, the project team is able to complete is 0.95 hours.
10PROJECT MANAGEMENT
ID WBS Task Name CPI SPI
0 0 Project Plan 0.95 0.95
1 1 Computer inventory and requirements 0.95 0.95
2 1.1 Inventory computers in use by
new telecommuters
1 1
3 1.2 Determine requirements to use
current computers
0.83 0.83
4 1.3 Identify computers for upgrade 0 0
5 1.4 Determine requirements for technology 0 0
6 1.5 Report outcomes for inventory
and requirements
0 0
7 2 Technical support 0 0
8 2.1 Determine technical support needed 0 0
9 2.2 Identify staff requirements 0 0
10 2.3 Report technical support needs
and staff requirements
0 0
11 3 Computing support 0 0
12 3.1 Identify required computer
support relative to inventory
0 0
13 3.2 Identify staff requirements 0 0
14 3.3 Report computer support needs
and staff requirements
0 0
15 4 Document servers 0 0
16 4.1 Determine server management
requirements
0 0
17 4.2 Determine server requirements
and locations
0 0
18 4.3 Install document servers 0 0
19 4.4 Test document server connections 0 0
20 4.5 Implement document servers 0 0
21 5 Shared drivers 0 0
22 5.1 Determine shared drive
management requirements
0 0
23 5.2 Determine shared drive
requirements and locations
0 0
24 5.3 Install shared drives 0 0
25 5.4 Test shared drive connections 0 0
26 5.5 Implement shared drives 0 0
27 6 FTP sites 0 0
28 6.1 Determine location of FTP Services 0 0
29 6.2 Disable Anonymous Access 0 0
30 6.3 Enable Logging 0 0
31 6.4 FTP security levels 0 0
32 6.4.1 Set permissions 0 0
33 6.4.2 Set log-on time restrictions 0 0
34 6.4.3 Limit log-on attempts 0 0
35 6.4.4 Enable account lockout 0 0
36 6.4.5 Limit IP address range access 0 0
37 6.4.6 Audit log-on attempts 0 0
38 6.4.7 Set strong password requirement 0 0
39 6.4.8 Blind Put or Read/Write 0 0
40 6.4.8.1 Determine setting for each user 0 0
41 6.4.8.2 Configure setting for each user 0 0
42 6.5 Disk Quotas 0 0
43 6.5.1 Identify quotas for each disk 0 0
44 6.5.2 Identify quotas for each user 0 0
45 6.6 Test connections 0 0
46 6.7 Implement FTP sites 0 0
47 7 Firewalls 0 0
48 7.1 Determine protocols 0 0
49 7.2 Implement selected protocols 0 0
50 7.3 Test vulnerabilities 0 0
51 7.4 Finalize filters and monitoring systems 0 0
52 8 Web-based meetings 0 0
53 8.1 Test and evaluate web-based
meetings with pilot group
0 0
54 8.2 Develop software updates for computers 0 0
55 8.3 Test web-based meeting with
larger group
0 0
T W
29 Dec '19
Figure 2: Schedule and cost performance index
(Source: Created by author using MS project)
iv. Estimation at completion
⊘ This is a preview!⊘
Do you want full access?
Subscribe today to unlock all pages.
Trusted by 1+ million students worldwide
1 out of 19
Related Documents


Your All-in-One AI-Powered Toolkit for Academic Success.
+13062052269
info@desklib.com
Available 24*7 on WhatsApp / Email
![[object Object]](/_next/static/media/star-bottom.7253800d.svg)
Unlock your academic potential
Copyright © 2020–2025 A2Z Services. All Rights Reserved. Developed and managed by ZUCOL.