Comprehensive Report: Groundwater Analysis in Barka, Oman
VerifiedAdded on 2022/09/11
|10
|1797
|24
Report
AI Summary
This report presents an analysis of groundwater level data, evapotranspiration, and rainfall in Barka, Oman, utilizing data collected from 1989 to 2019. The study focuses on methodologies for evaluating groundwater levels across four catchments. It details the data collection process, including groundwater, rainfall, and evaporation data, and explains the data processing techniques using Ms Excel. The core of the report involves data analysis, aiming to assess temporal changes in groundwater levels, link groundwater levels to evapotranspiration and rainfall using statistical models, and determine the impact of climate changes. Linear regression models are developed to quantify the relationships between these variables. The findings include correlation and regression analyses to understand the influences of evapotranspiration and rainfall on groundwater levels, offering insights into the environmental dynamics of the region. References to relevant literature support the methodologies and findings.
Geography 1
GEOGRAPHY
By Name
Course
Instructor
Institution
Location
Date
GEOGRAPHY
By Name
Course
Instructor
Institution
Location
Date
Paraphrase This Document
Need a fresh take? Get an instant paraphrase of this document with our AI Paraphraser
Geography 2
This chapter presents an overview of the methodologies used for evaluation of the
groundwater level data, evapotranspiration and rainfall in Barka. The definition and concept
under this methodology outline a brief introduction of the calculation recharge basis which
includes several formulae and variables. The whole process is categorized into three key
steps which are explained below;
Step 1: Data collection
Groundwater data
In this thesis, groundwater level data collected every month from the year 1989 to 2019
for 4 catchments were obtained from the Ministry of Regional Municipality,
Environment, and Water Resources. Even though the data were recorded from the year
1989, these groundwater data for the year 1973 were as well available. Nevertheless, the
groundwater level date from the year 1989 was used to give some consistency in analysis.
Sultanate of Oman has a more intense network of hydrometric network monitoring the
amount of precipitation, discharges and groundwater level, these always focus on regions
having more demand of water like Batinag Plains (Osman Abdalla, 2017). About 2064
monitoring wells are distributed through the Sultanate of Oman to help in measuring the
quality and quantity of water. Oman has been using manual measurement but recently
satellite-based telemetry is being installed in the country to give automatic data loggings.
Monitoring is a regular basic measurement that is employed in this country to check on
the change in the values of the groundwater level (Glennie, 2010). As per now, there are
about 4000 monitoring stations where groundwater levels and the groundwater quality
can be monitored.
The location of the four catchments to the study area Barka can be illustrated in the
Geography 3
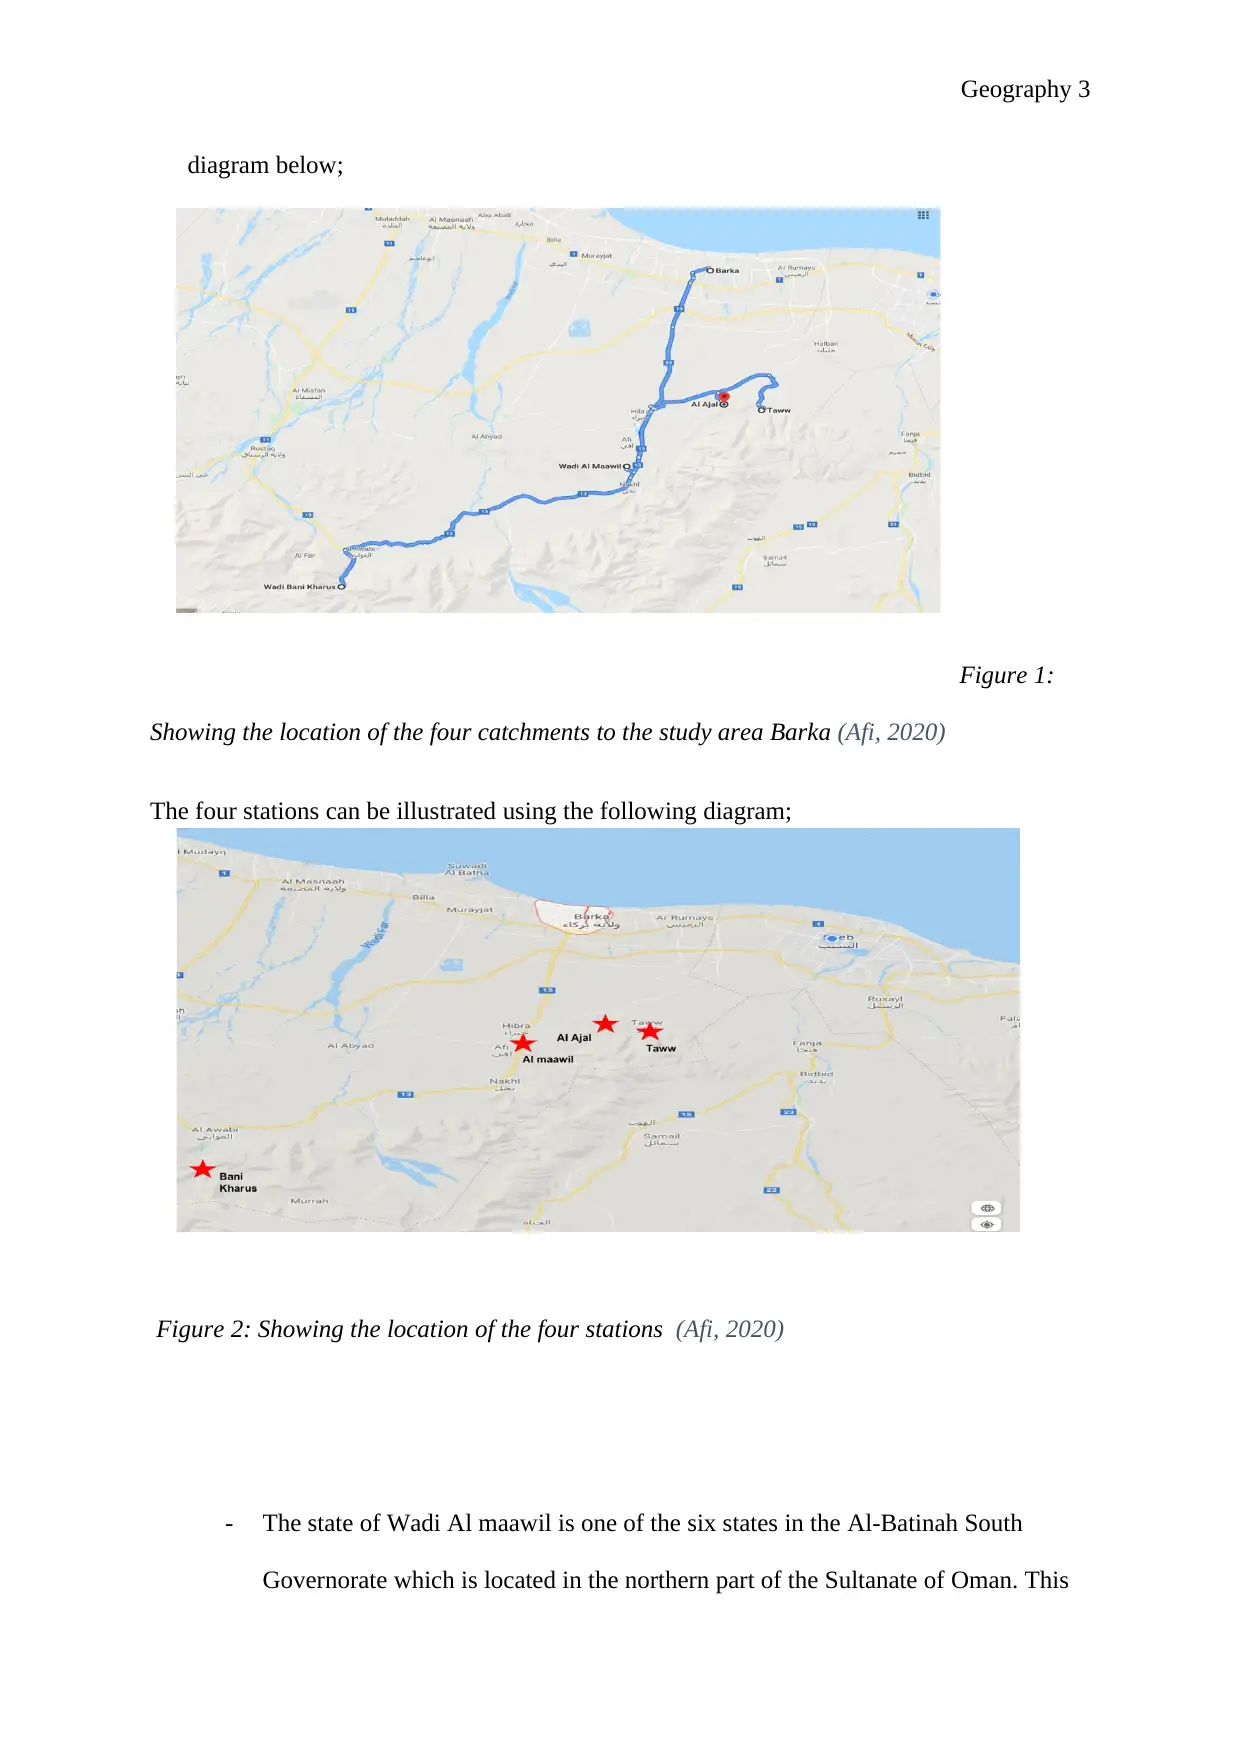
diagram below;
Figure 1:
Showing the location of the four catchments to the study area Barka (Afi, 2020)
The four stations can be illustrated using the following diagram;
Figure 2: Showing the location of the four stations (Afi, 2020)
- The state of Wadi Al maawil is one of the six states in the Al-Batinah South
Governorate which is located in the northern part of the Sultanate of Oman. This
⊘ This is a preview!⊘
Do you want full access?
Subscribe today to unlock all pages.
Trusted by 1+ million students worldwide
Geography 4
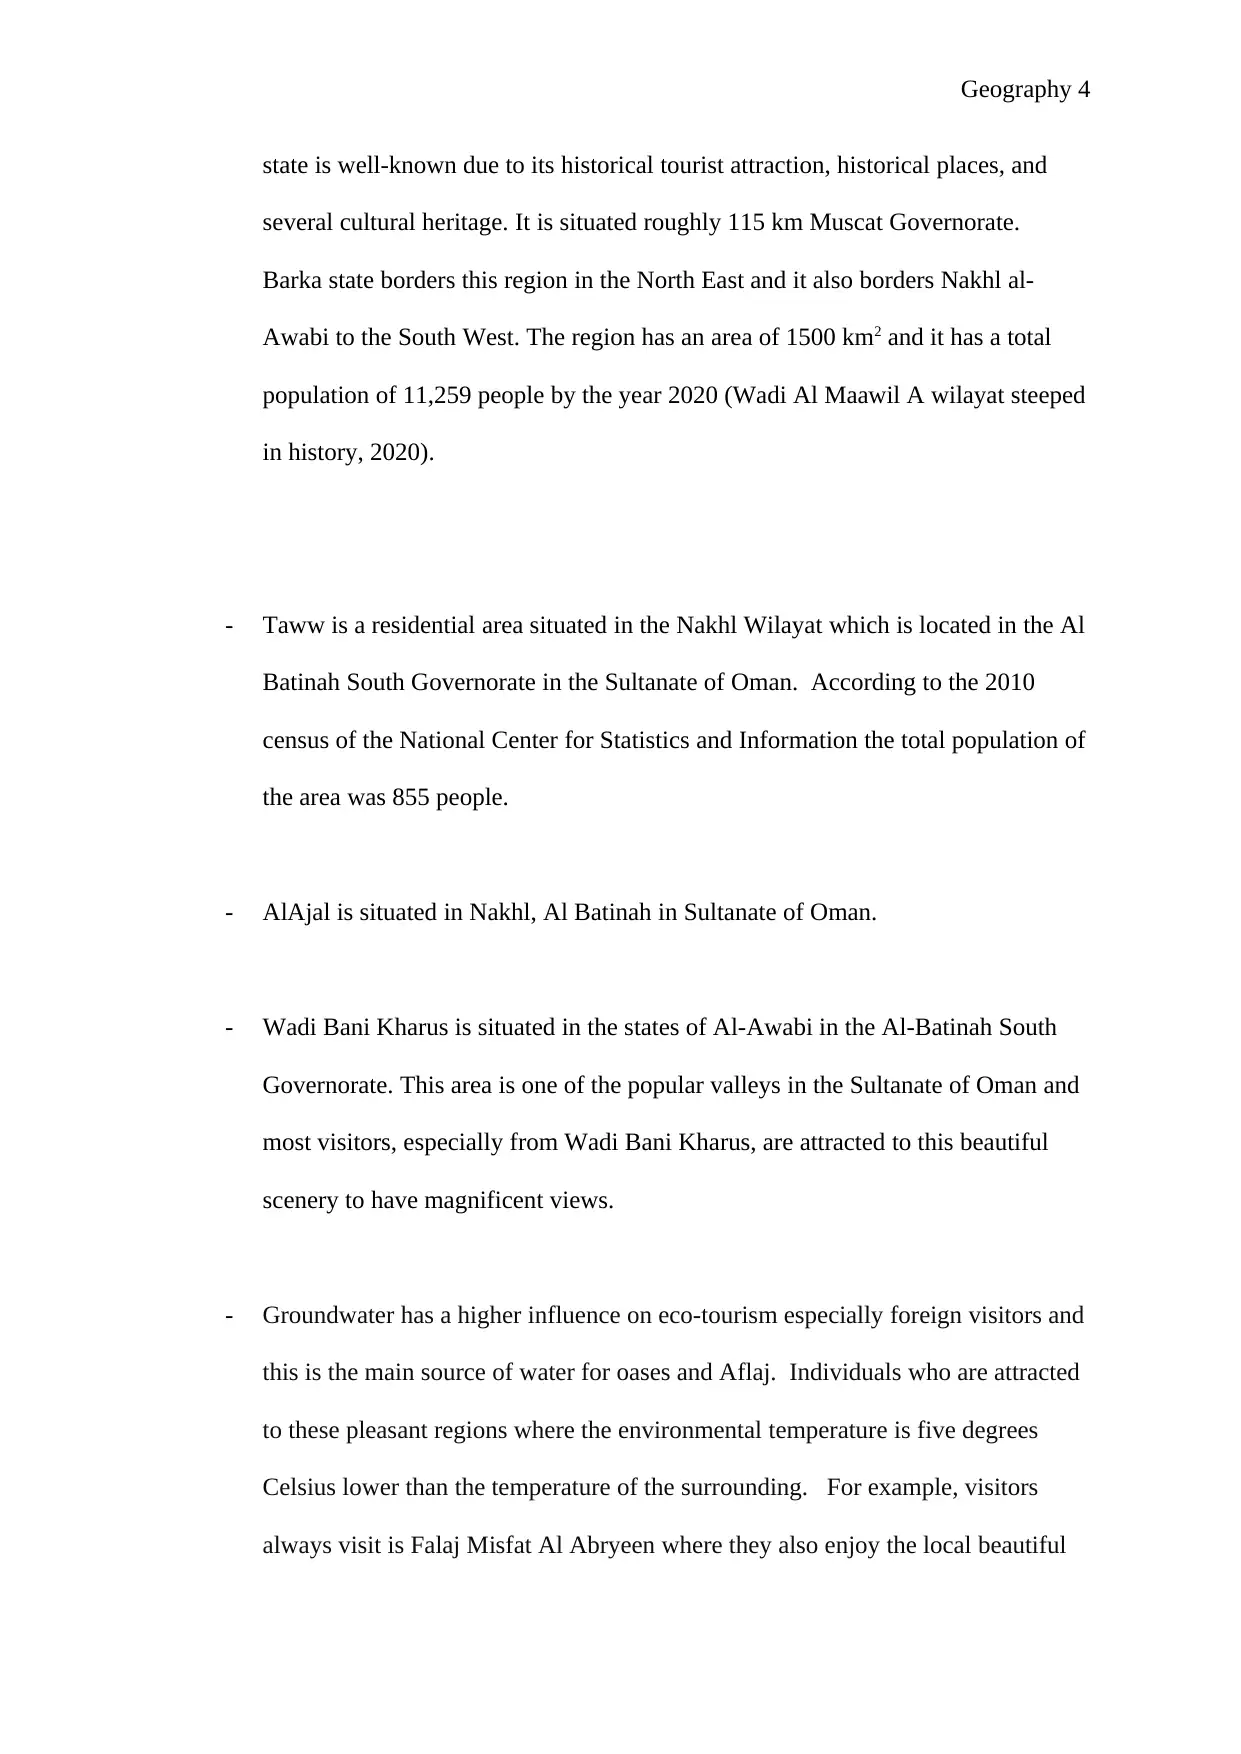
state is well-known due to its historical tourist attraction, historical places, and
several cultural heritage. It is situated roughly 115 km Muscat Governorate.
Barka state borders this region in the North East and it also borders Nakhl al-
Awabi to the South West. The region has an area of 1500 km2 and it has a total
population of 11,259 people by the year 2020 (Wadi Al Maawil A wilayat steeped
in history, 2020).
- Taww is a residential area situated in the Nakhl Wilayat which is located in the Al
Batinah South Governorate in the Sultanate of Oman. According to the 2010
census of the National Center for Statistics and Information the total population of
the area was 855 people.
- AlAjal is situated in Nakhl, Al Batinah in Sultanate of Oman.
- Wadi Bani Kharus is situated in the states of Al-Awabi in the Al-Batinah South
Governorate. This area is one of the popular valleys in the Sultanate of Oman and
most visitors, especially from Wadi Bani Kharus, are attracted to this beautiful
scenery to have magnificent views.
- Groundwater has a higher influence on eco-tourism especially foreign visitors and
this is the main source of water for oases and Aflaj. Individuals who are attracted
to these pleasant regions where the environmental temperature is five degrees
Celsius lower than the temperature of the surrounding. For example, visitors
always visit is Falaj Misfat Al Abryeen where they also enjoy the local beautiful
Paraphrase This Document
Need a fresh take? Get an instant paraphrase of this document with our AI Paraphraser
Geography 5
sceneries. The oilfields in the Sultanate of Oman are less productive and also
more challenging as compared to those from the Southern Gulf, the water
production is almost equal to the global average which is 1 barrel of oil to nine
barrels of water. This is in contrary to Saudi Arabia´s which is 2.5 barrels of oil to
1 barrel of water and Kuwait´s which is 5 barrels of oil to 1 of water
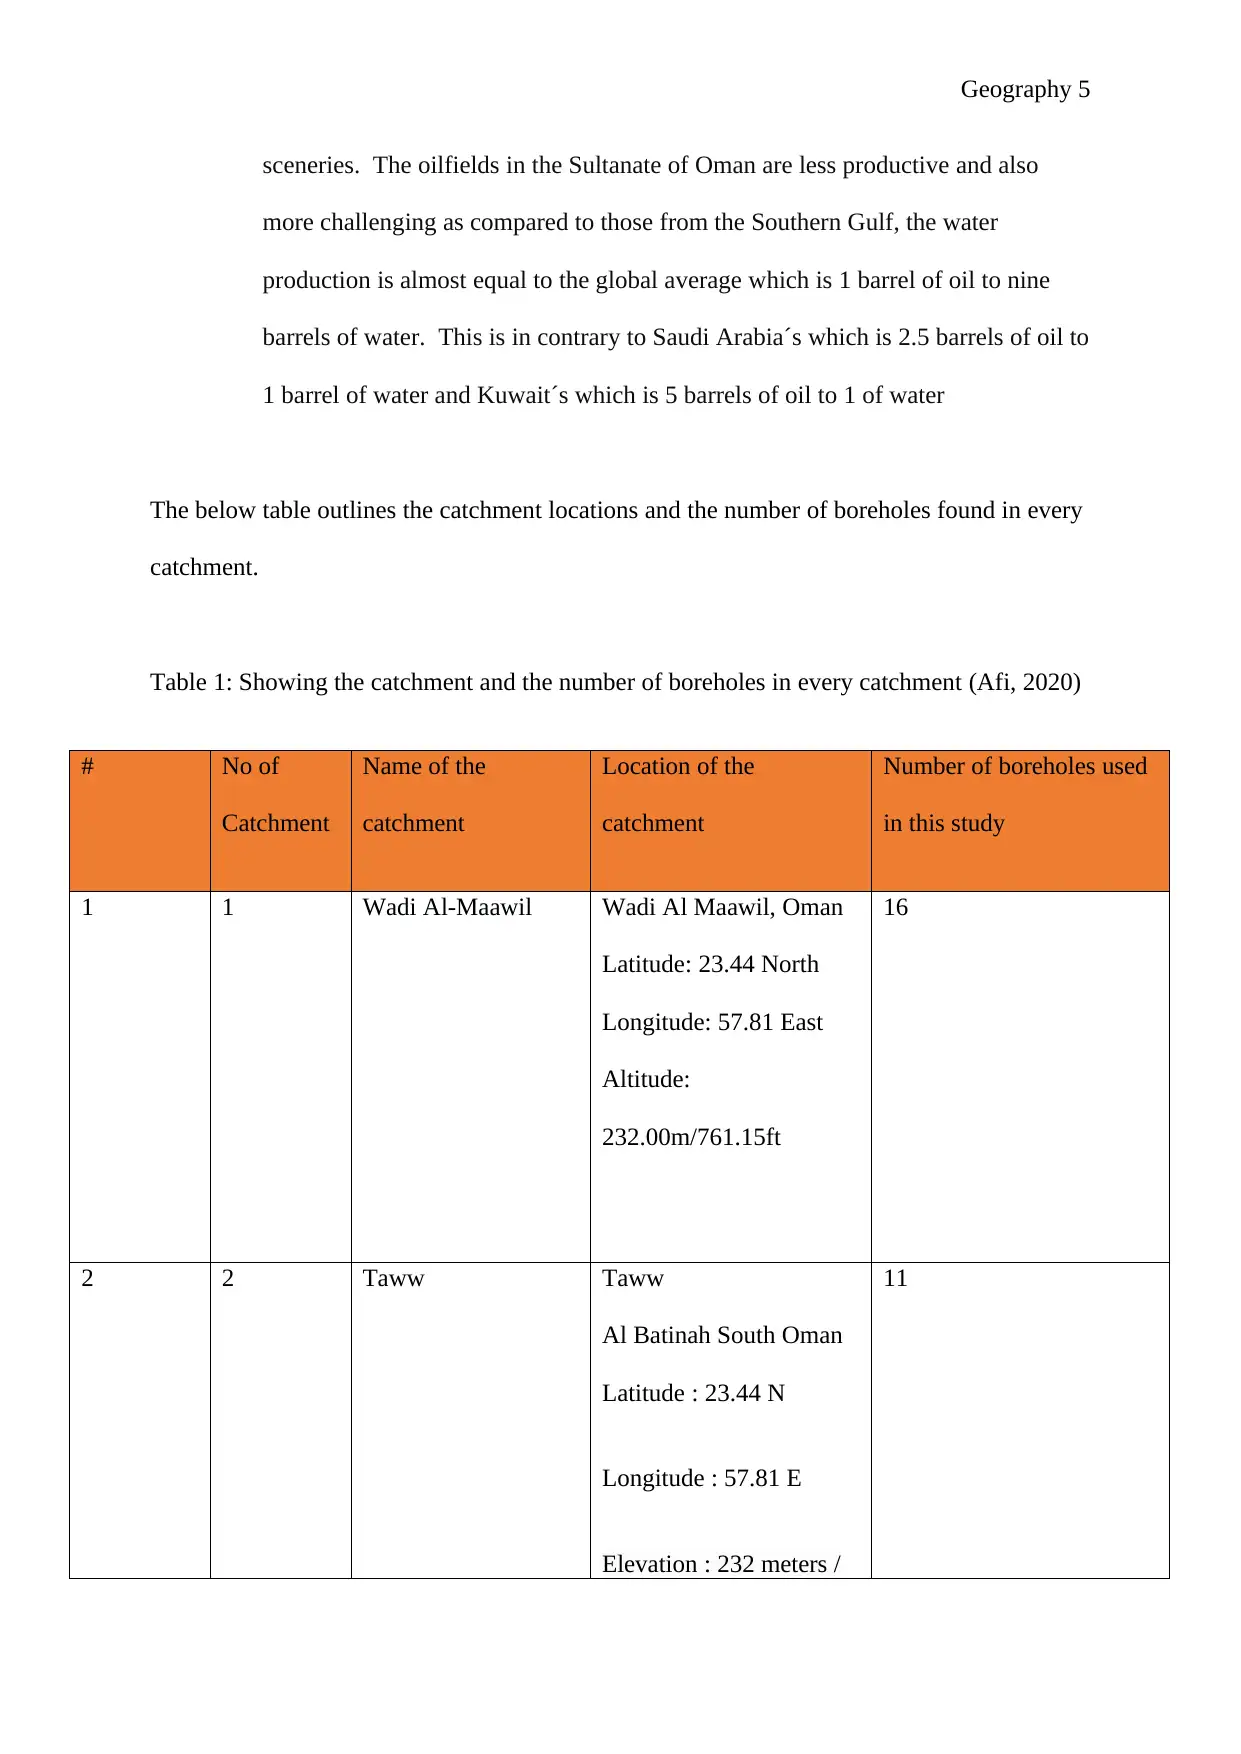
The below table outlines the catchment locations and the number of boreholes found in every
catchment.
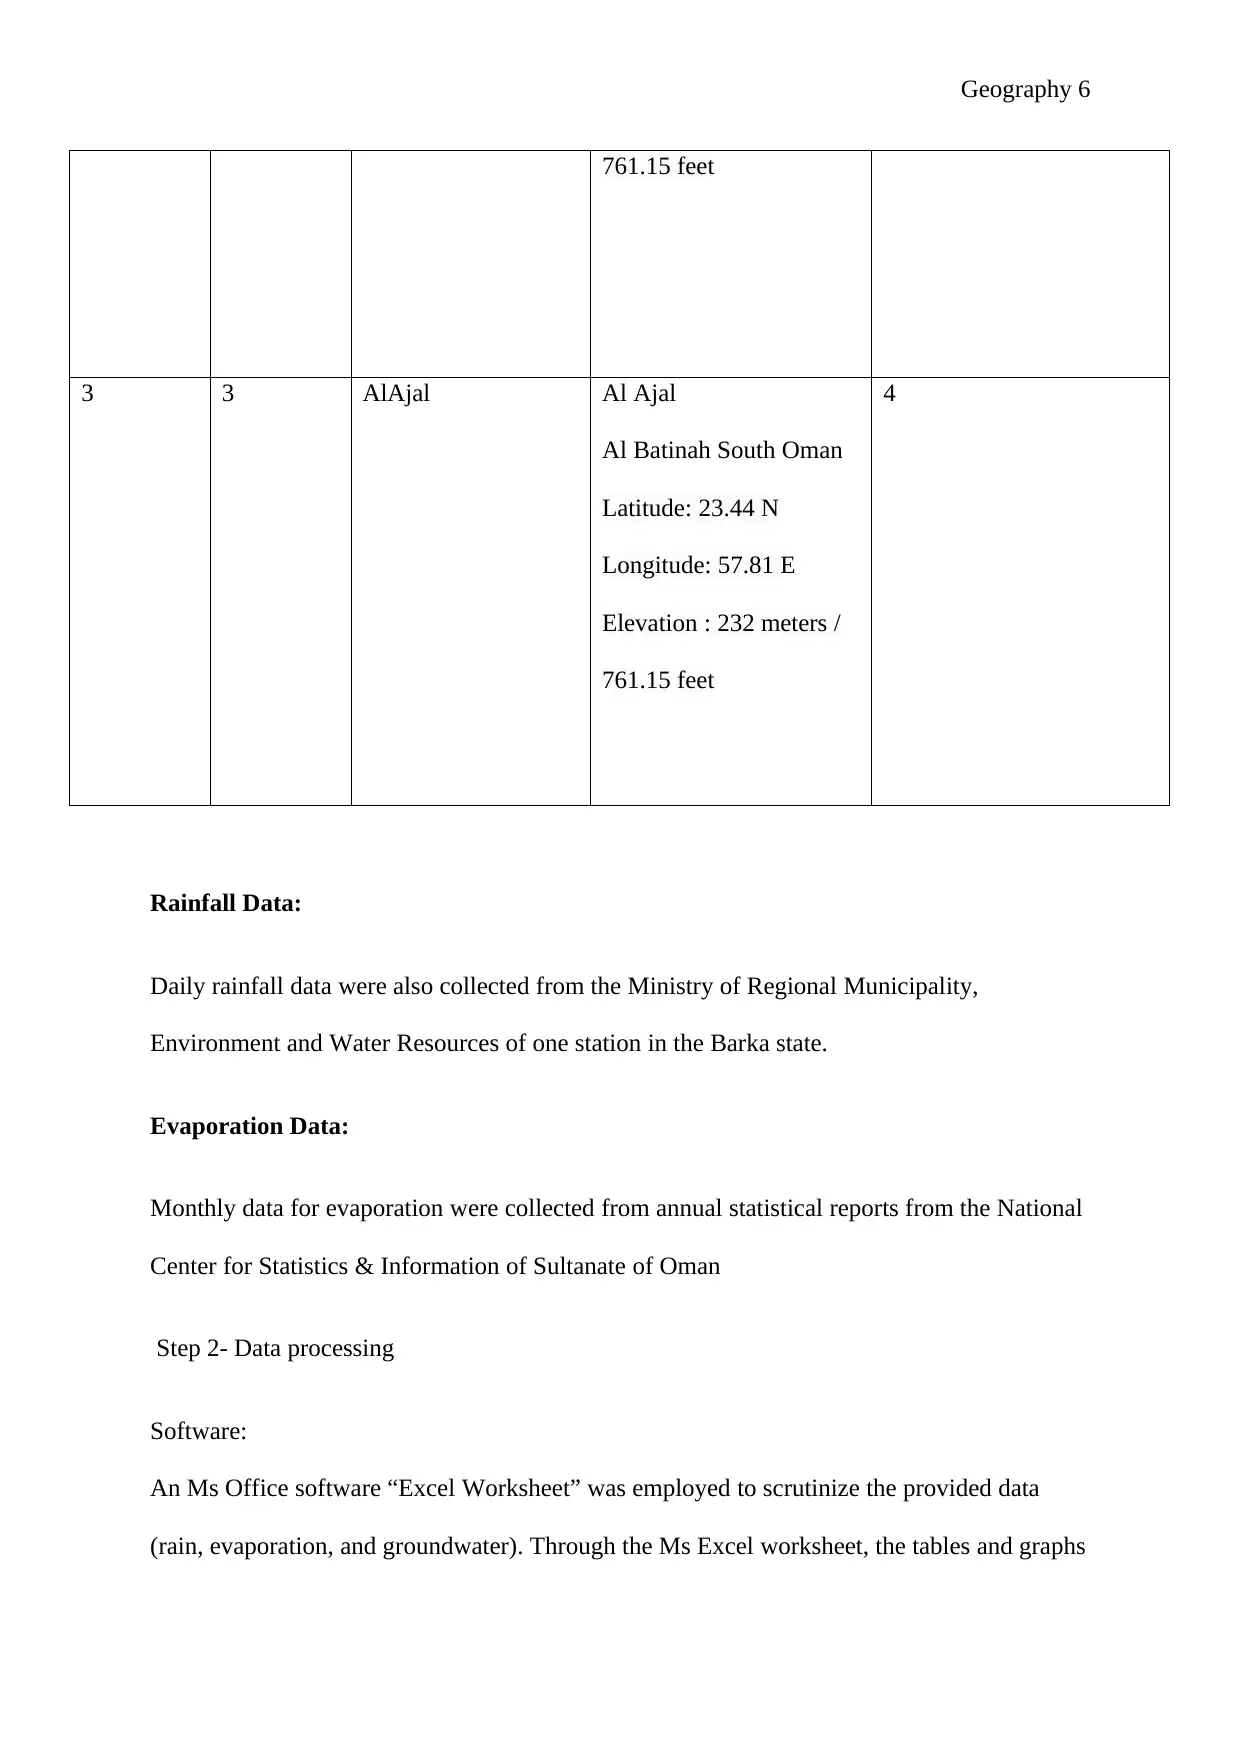
Table 1: Showing the catchment and the number of boreholes in every catchment (Afi, 2020)
# No of
Catchment
Name of the
catchment
Location of the
catchment
Number of boreholes used
in this study
1 1 Wadi Al-Maawil Wadi Al Maawil, Oman
Latitude: 23.44 North
Longitude: 57.81 East
Altitude:
232.00m/761.15ft
16
2 2 Taww Taww
Al Batinah South Oman
Latitude : 23.44 N
Longitude : 57.81 E
Elevation : 232 meters /
11
sceneries. The oilfields in the Sultanate of Oman are less productive and also
more challenging as compared to those from the Southern Gulf, the water
production is almost equal to the global average which is 1 barrel of oil to nine
barrels of water. This is in contrary to Saudi Arabia´s which is 2.5 barrels of oil to
1 barrel of water and Kuwait´s which is 5 barrels of oil to 1 of water
The below table outlines the catchment locations and the number of boreholes found in every
catchment.
Table 1: Showing the catchment and the number of boreholes in every catchment (Afi, 2020)
# No of
Catchment
Name of the
catchment
Location of the
catchment
Number of boreholes used
in this study
1 1 Wadi Al-Maawil Wadi Al Maawil, Oman
Latitude: 23.44 North
Longitude: 57.81 East
Altitude:
232.00m/761.15ft
16
2 2 Taww Taww
Al Batinah South Oman
Latitude : 23.44 N
Longitude : 57.81 E
Elevation : 232 meters /
11
Geography 6
761.15 feet
3 3 AlAjal Al Ajal
Al Batinah South Oman
Latitude: 23.44 N
Longitude: 57.81 E
Elevation : 232 meters /
761.15 feet
4
Rainfall Data:
Daily rainfall data were also collected from the Ministry of Regional Municipality,
Environment and Water Resources of one station in the Barka state.
Evaporation Data:
Monthly data for evaporation were collected from annual statistical reports from the National
Center for Statistics & Information of Sultanate of Oman
Step 2- Data processing
Software:
An Ms Office software “Excel Worksheet” was employed to scrutinize the provided data
(rain, evaporation, and groundwater). Through the Ms Excel worksheet, the tables and graphs
761.15 feet
3 3 AlAjal Al Ajal
Al Batinah South Oman
Latitude: 23.44 N
Longitude: 57.81 E
Elevation : 232 meters /
761.15 feet
4
Rainfall Data:
Daily rainfall data were also collected from the Ministry of Regional Municipality,
Environment and Water Resources of one station in the Barka state.
Evaporation Data:
Monthly data for evaporation were collected from annual statistical reports from the National
Center for Statistics & Information of Sultanate of Oman
Step 2- Data processing
Software:
An Ms Office software “Excel Worksheet” was employed to scrutinize the provided data
(rain, evaporation, and groundwater). Through the Ms Excel worksheet, the tables and graphs
⊘ This is a preview!⊘
Do you want full access?
Subscribe today to unlock all pages.
Trusted by 1+ million students worldwide
Geography 7
were created using the information from data analysis.
Step 3- Data analyses
The key objective of this thesis is to evaluate the data of groundwater level in regular
monitoring wells which were built by the Ministry of Water Resources in Barka. The
variation in the level of groundwater are linked to the activities of anthropogenic like
evapotranspiration, precipitation, and changes in climate and human activities such as land
use and irrigation. The main objectives are given below;
1. To use analysis which will evaluate the temporal changes of level of groundwater,
evapotranspiration, and rainfall in Barka.
2. To have a statistical model that links the groundwater level to the evapotranspiration
and Rainfall.
3. To assess the changes in climate and the impact on the level of groundwater in Barka¨
4. To develop a linear regression model that will be employed to link the groundwater to
the rainfall.
Groundwater Data:
The analysis of the groundwater is the first step, firstly, the sum of monthly groundwater data
was calculated for every well in the station. Secondly, the mean monthly sum of all wells was
calculated (Mohamed, 2010). Thereafter, the mean of all monthly data for all the stations was
as well calculated to obtain the 4 columns for the monthly average for the four stations. In
the year 1998, Oman´s national monitoring network realized that rainfall and wadi flow
monitoring station conforms to the standards of WMO, even though the collection of data
appears to be sparse in most of the desert regions and that is why the data collected are very
Paraphrase This Document
Need a fresh take? Get an instant paraphrase of this document with our AI Paraphraser

Geography 8
sparse and it is only through linear regression model which can be employed to draw a graph
of best fit. For the groundwater measurement of the level of groundwater, the obtained data
illustrated that national average density fi roughly 132km2 (A.S. Alsharhan, 2012).
Rainfall Data:
The Rainfall data were calculated by taking the monthly sum of the data of the station that
was provided, as well as calculating the annual sum of the rainfall, and the average of the
annual sum was taken.
Evaporation Data:
The Evaporation data were calculated by taking the minimum and maximum monthly
temperatures each year in the Albatinah region.
Correlation analysis
The method of Correlation is employed to calculate the coefficient of correlation which will
then be employed to evaluate the strength between evaporation and groundwater and the
strength between rainfall and groundwater.
Regression models
Geography 9
This research study together with the relationship between the evapotranspiration,
precipitation, and level of groundwater. Linear regression follows the linear model for
determining the values of the dependent variable from a given independent variable.
Therefore, linear progression will follow the equation of a straight line which is Y = mx +C,
where m is the slope of the graph drawn, y is the dependent variable, c is the x-intercept and
x is the independent variable. It also focuses on the quantifying the quantity of relationship
which existed between the aforementioned variables. So as to quantify the extent relationship,
this study used linear regression. Through the use of the linear progression model, it will be
very clear to visualize as well as fathom how the independent variables (evapotranspiration
and rainfall) manipulate the variable response (groundwater level. The first and the second
regression models are simple linear regression, where the first is about regressing rainfall on
the groundwater level while the second is about regressing the evapotranspiration rate on the
groundwater level. In the third model is several linear regression models (Luedeling, 2017).
With this model, the research sought to obtain how both evapotranspiration and rainfall
influenced on the groundwater level as well as finding out which among the two is a vital
groundwater level predictor.
⊘ This is a preview!⊘
Do you want full access?
Subscribe today to unlock all pages.
Trusted by 1+ million students worldwide
Geography 10
References
A.S. Alsharhan, Z. R. A. N. D. B. S. A., 2012. Hydrogeology of an Arid Region: The Arabian
Gulf and Adjoining Areas. 2nd ed. Muscat: Elsevier.
Afi, W. A. M., 2020. Sultanate of Oman on the Elevation Map. 1st ed. Muscat: Topographic
map of Afi.
Glennie, K., 2010. Geology of the Oman Mountains. 1st ed. Amsterdam: Springer
Netherlands.
Luedeling, E., 2017. Sustainability of Mountain Oases in Oman: Effects of Agro-
environmental Changes on Traditional Cropping Systems. 3rd ed. Hull: kassel university
press GmbH.
Mohamed, A., 2010. Reclaiming the Desert: Towards a Sustainable Environment in Arid
Lands: Proceedings of the Third Joint UAE-Japan Symposium on Sustainable GCC
Environment and Water Resources. 2nd ed. Hull: Springer.
Osman Abdalla, A. K. M. C. A. A.-M. T. A.-H. I. C., 2017. Water Resources in Arid Areas:
The Way Forward. 1st ed. Muscat: Springer.
1 out of 10
Your All-in-One AI-Powered Toolkit for Academic Success.
+13062052269
info@desklib.com
Available 24*7 on WhatsApp / Email
![[object Object]](/_next/static/media/star-bottom.7253800d.svg)
Unlock your academic potential
Copyright © 2020–2026 A2Z Services. All Rights Reserved. Developed and managed by ZUCOL.