A Brief Statistical Look at Apollo
VerifiedAdded on 2022/11/28
|12
|2508
|81
AI Summary
Research Task
Find, compare, and contrast the data for the Apollo 11, 12, 13, 14, 15, 16, and 17 missions. This can include such information as total days in Earth and lunar orbit, total time on the Moon, total spacewalks, health statistics for the astronauts and/or any other information/mission objectives you feel pertinent. There is no set path for this assignment - the values to be compared are of your choosing, but make sure you analyze the information. Do not just copy it from other sources and consider that your paper.
Format -- MUST BE FOLLOWED!
Page 1: Cover Sheet (Title: "A Brief Statistical Look at Apollo")
Page 2: Table of Contents
Pages 3-the end of Page 6 (keep within these pages--do not add any more!): Narrative Overview/Findings. IMPORTANT: Be sure to state up front what questions you are going to answer. For example, "This paper will compare/contrast the following mission objectives from _____________________." In addition, you need to include a statement of yo
Contribute Materials
Your contribution can guide someone’s learning journey. Share your
documents today.
Running head: A BRIEF STATISTICAL LOOK AT APOLLO 1
A Brief Statistical Look at Apollo
Name
Institution
A Brief Statistical Look at Apollo
Name
Institution
Secure Best Marks with AI Grader
Need help grading? Try our AI Grader for instant feedback on your assignments.
A BRIEF STATISTICAL LOOK AT APOLLO 2
Table of Contents
Table of Contents.......................................................................................................................2
Introduction................................................................................................................................3
Manned Missions....................................................................................................................3
Launching of Spacecraft.........................................................................................................5
Objective and Hypothesis.......................................................................................................6
Statistical Analysis.....................................................................................................................7
Description of Data.................................................................................................................7
Hypothesis Testing.................................................................................................................8
Summary..................................................................................................................................11
References................................................................................................................................12
A BRIEF STATISTICAL LOOK AT APOLLO 3
A Brief Statistical Look at Apollo
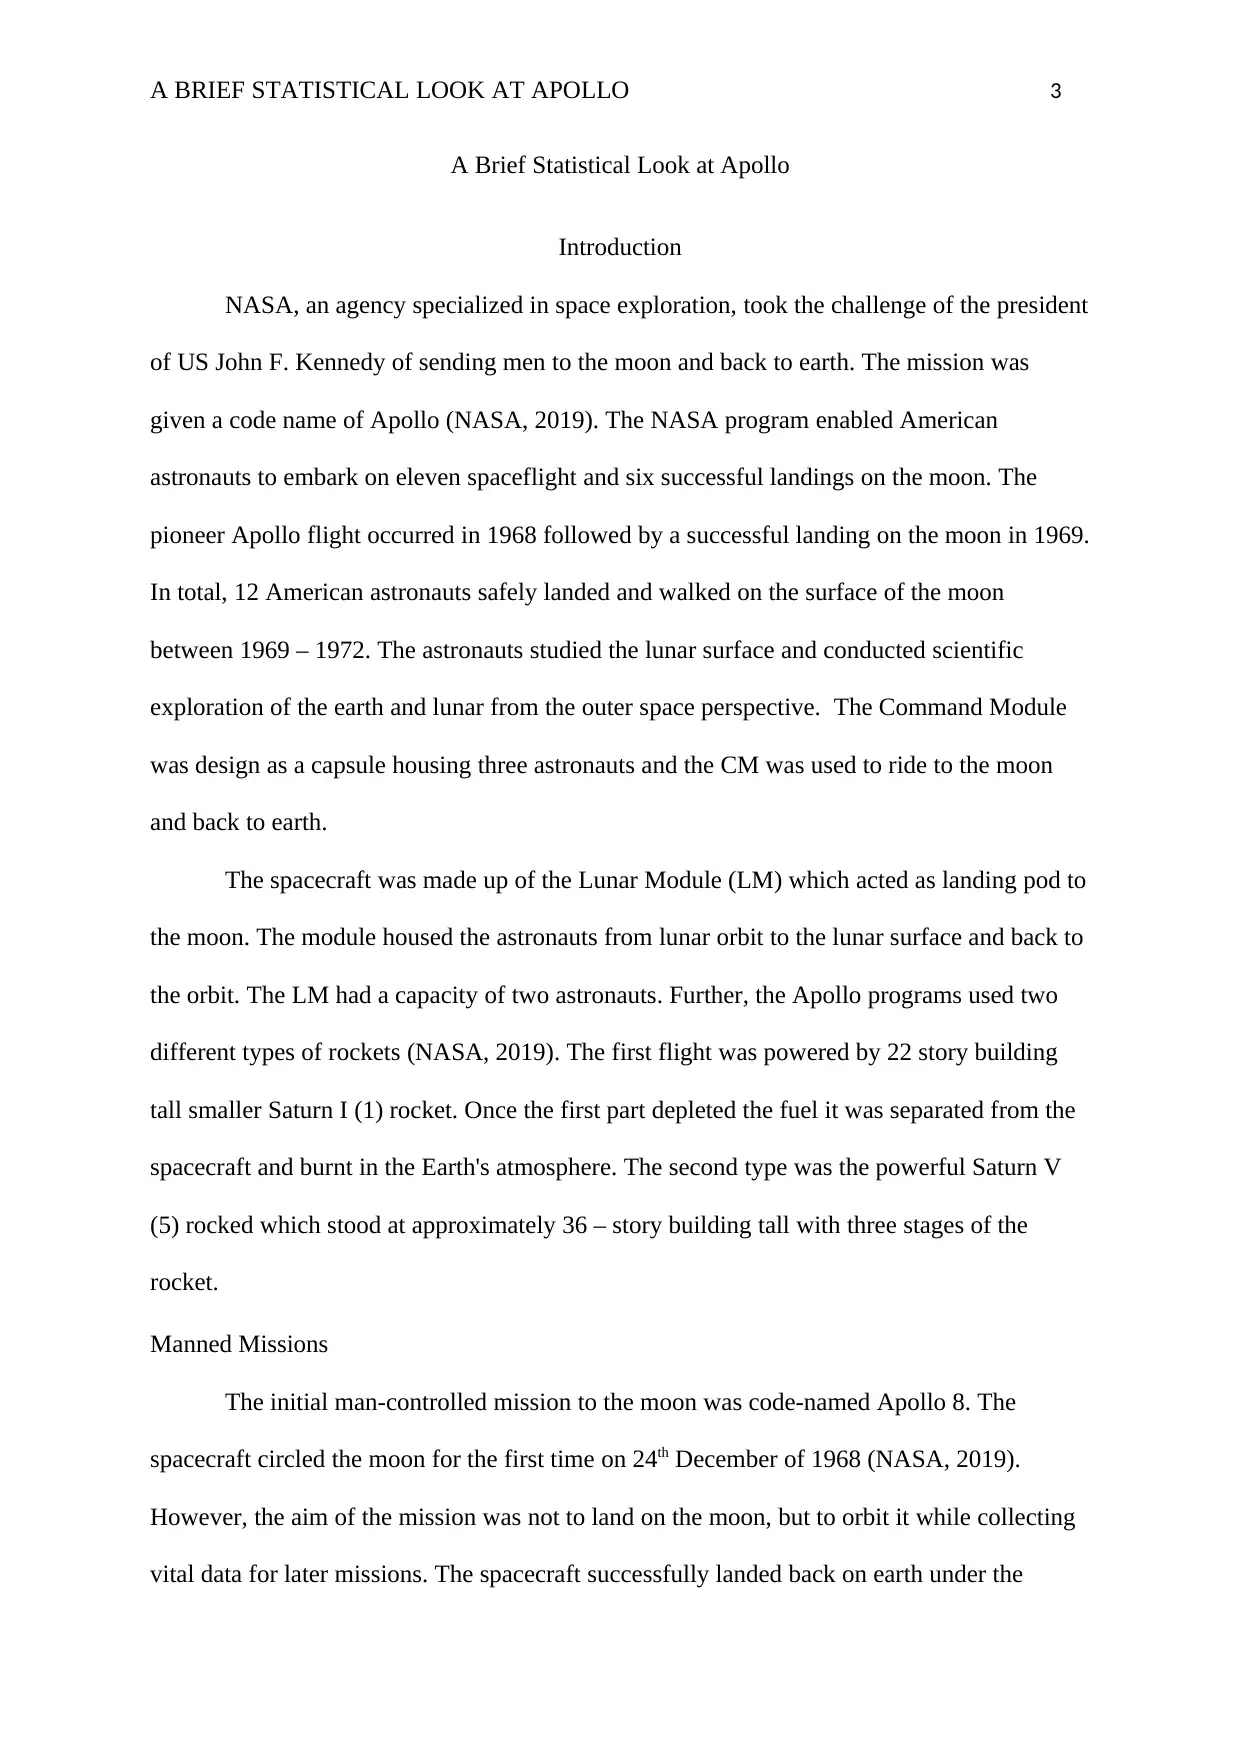
Introduction
NASA, an agency specialized in space exploration, took the challenge of the president
of US John F. Kennedy of sending men to the moon and back to earth. The mission was
given a code name of Apollo (NASA, 2019). The NASA program enabled American
astronauts to embark on eleven spaceflight and six successful landings on the moon. The
pioneer Apollo flight occurred in 1968 followed by a successful landing on the moon in 1969.
In total, 12 American astronauts safely landed and walked on the surface of the moon
between 1969 – 1972. The astronauts studied the lunar surface and conducted scientific
exploration of the earth and lunar from the outer space perspective. The Command Module
was design as a capsule housing three astronauts and the CM was used to ride to the moon
and back to earth.
The spacecraft was made up of the Lunar Module (LM) which acted as landing pod to
the moon. The module housed the astronauts from lunar orbit to the lunar surface and back to
the orbit. The LM had a capacity of two astronauts. Further, the Apollo programs used two
different types of rockets (NASA, 2019). The first flight was powered by 22 story building
tall smaller Saturn I (1) rocket. Once the first part depleted the fuel it was separated from the
spacecraft and burnt in the Earth's atmosphere. The second type was the powerful Saturn V
(5) rocked which stood at approximately 36 – story building tall with three stages of the
rocket.
Manned Missions
The initial man-controlled mission to the moon was code-named Apollo 8. The
spacecraft circled the moon for the first time on 24th December of 1968 (NASA, 2019).
However, the aim of the mission was not to land on the moon, but to orbit it while collecting
vital data for later missions. The spacecraft successfully landed back on earth under the
A Brief Statistical Look at Apollo
Introduction
NASA, an agency specialized in space exploration, took the challenge of the president
of US John F. Kennedy of sending men to the moon and back to earth. The mission was
given a code name of Apollo (NASA, 2019). The NASA program enabled American
astronauts to embark on eleven spaceflight and six successful landings on the moon. The
pioneer Apollo flight occurred in 1968 followed by a successful landing on the moon in 1969.
In total, 12 American astronauts safely landed and walked on the surface of the moon
between 1969 – 1972. The astronauts studied the lunar surface and conducted scientific
exploration of the earth and lunar from the outer space perspective. The Command Module
was design as a capsule housing three astronauts and the CM was used to ride to the moon
and back to earth.
The spacecraft was made up of the Lunar Module (LM) which acted as landing pod to
the moon. The module housed the astronauts from lunar orbit to the lunar surface and back to
the orbit. The LM had a capacity of two astronauts. Further, the Apollo programs used two
different types of rockets (NASA, 2019). The first flight was powered by 22 story building
tall smaller Saturn I (1) rocket. Once the first part depleted the fuel it was separated from the
spacecraft and burnt in the Earth's atmosphere. The second type was the powerful Saturn V
(5) rocked which stood at approximately 36 – story building tall with three stages of the
rocket.
Manned Missions
The initial man-controlled mission to the moon was code-named Apollo 8. The
spacecraft circled the moon for the first time on 24th December of 1968 (NASA, 2019).
However, the aim of the mission was not to land on the moon, but to orbit it while collecting
vital data for later missions. The spacecraft successfully landed back on earth under the
A BRIEF STATISTICAL LOOK AT APOLLO 4
control of Jim Lovell, Bill Anders, and Frank Borman. With funding from the US
government, NASA managed to land on the moon on July 20, 1969, the mission was code-
named Apollo 11. In control of the spacecraft was Commander - Neil Armstrong, CM pilot –
Michael Collins, and LM pilot – Edwin Eugene “Buzz Aldrin.” Lt. Collins remained on the
moon orbit piloting CM while Lt. Armstrong walked for the first time on the moon surface
followed by colonel Edwin Eugene. The first reaction of Armstrong is as follows: "That's one
small step for (a) man; one giant leap for mankind” (NASA, 2019).
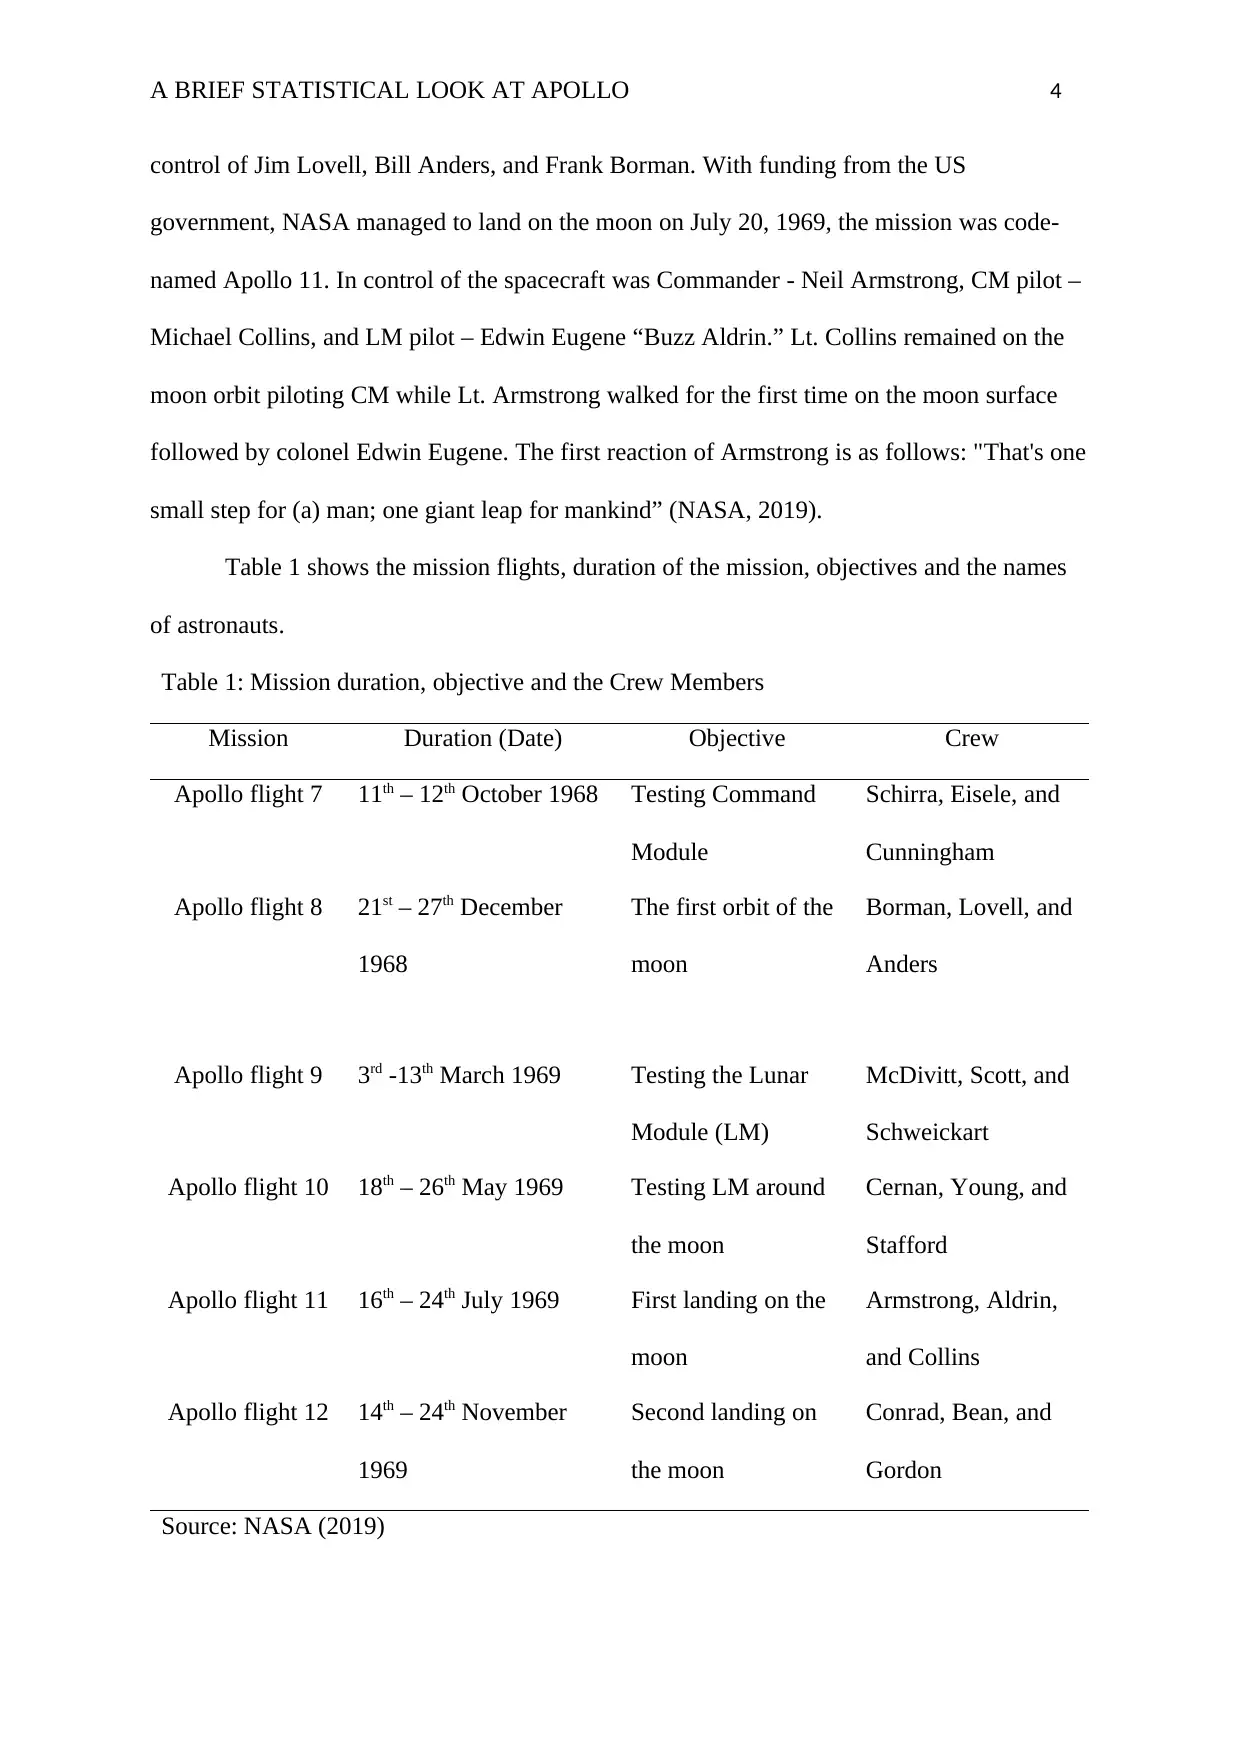
Table 1 shows the mission flights, duration of the mission, objectives and the names
of astronauts.
Table 1: Mission duration, objective and the Crew Members
Mission Duration (Date) Objective Crew
Apollo flight 7 11th – 12th October 1968 Testing Command
Module
Schirra, Eisele, and
Cunningham
Apollo flight 8 21st – 27th December
1968
The first orbit of the
moon
Borman, Lovell, and
Anders
Apollo flight 9 3rd -13th March 1969 Testing the Lunar
Module (LM)
McDivitt, Scott, and
Schweickart
Apollo flight 10 18th – 26th May 1969 Testing LM around
the moon
Cernan, Young, and
Stafford
Apollo flight 11 16th – 24th July 1969 First landing on the
moon
Armstrong, Aldrin,
and Collins
Apollo flight 12 14th – 24th November
1969
Second landing on
the moon
Conrad, Bean, and
Gordon
Source: NASA (2019)
control of Jim Lovell, Bill Anders, and Frank Borman. With funding from the US
government, NASA managed to land on the moon on July 20, 1969, the mission was code-
named Apollo 11. In control of the spacecraft was Commander - Neil Armstrong, CM pilot –
Michael Collins, and LM pilot – Edwin Eugene “Buzz Aldrin.” Lt. Collins remained on the
moon orbit piloting CM while Lt. Armstrong walked for the first time on the moon surface
followed by colonel Edwin Eugene. The first reaction of Armstrong is as follows: "That's one
small step for (a) man; one giant leap for mankind” (NASA, 2019).
Table 1 shows the mission flights, duration of the mission, objectives and the names
of astronauts.
Table 1: Mission duration, objective and the Crew Members
Mission Duration (Date) Objective Crew
Apollo flight 7 11th – 12th October 1968 Testing Command
Module
Schirra, Eisele, and
Cunningham
Apollo flight 8 21st – 27th December
1968
The first orbit of the
moon
Borman, Lovell, and
Anders
Apollo flight 9 3rd -13th March 1969 Testing the Lunar
Module (LM)
McDivitt, Scott, and
Schweickart
Apollo flight 10 18th – 26th May 1969 Testing LM around
the moon
Cernan, Young, and
Stafford
Apollo flight 11 16th – 24th July 1969 First landing on the
moon
Armstrong, Aldrin,
and Collins
Apollo flight 12 14th – 24th November
1969
Second landing on
the moon
Conrad, Bean, and
Gordon
Source: NASA (2019)
Secure Best Marks with AI Grader
Need help grading? Try our AI Grader for instant feedback on your assignments.
A BRIEF STATISTICAL LOOK AT APOLLO 5
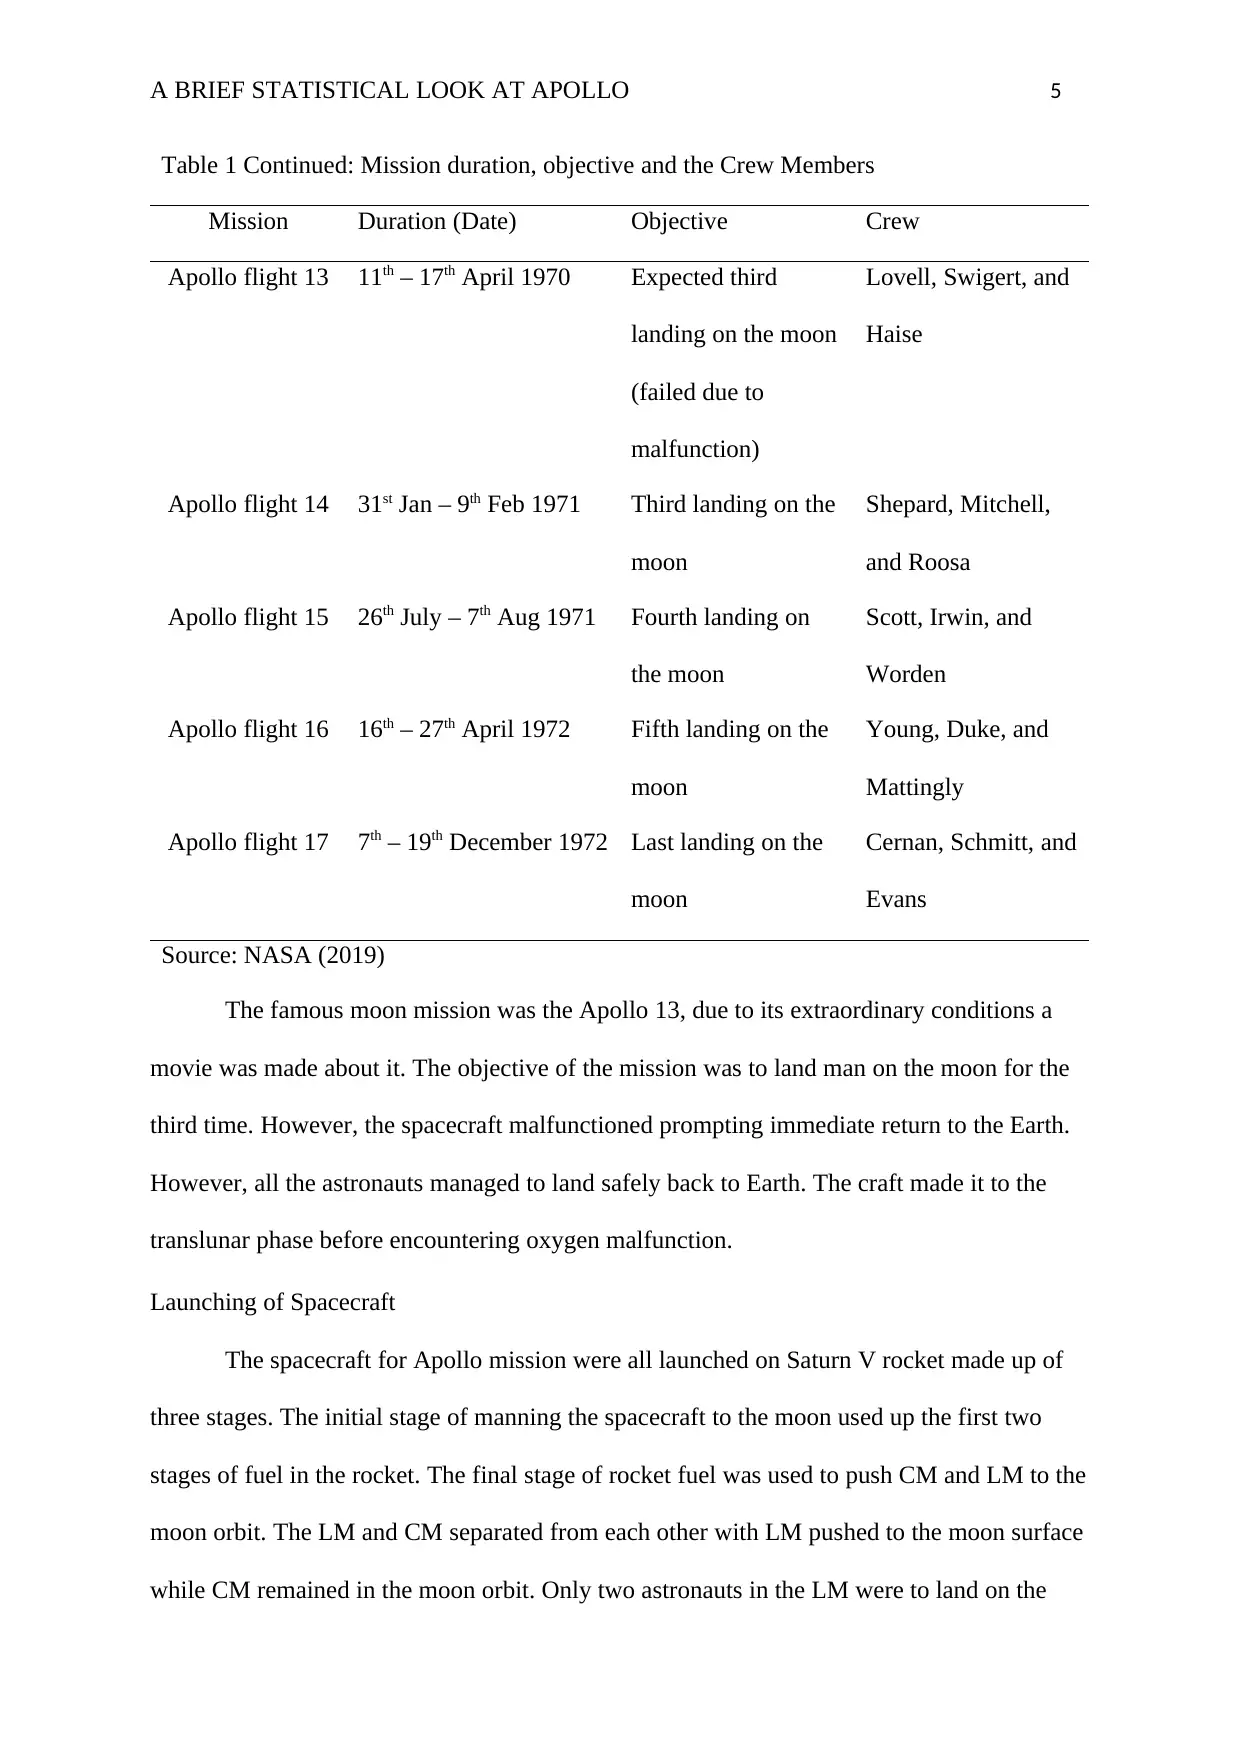
Table 1 Continued: Mission duration, objective and the Crew Members
Mission Duration (Date) Objective Crew
Apollo flight 13 11th – 17th April 1970 Expected third
landing on the moon
(failed due to
malfunction)
Lovell, Swigert, and
Haise
Apollo flight 14 31st Jan – 9th Feb 1971 Third landing on the
moon
Shepard, Mitchell,
and Roosa
Apollo flight 15 26th July – 7th Aug 1971 Fourth landing on
the moon
Scott, Irwin, and
Worden
Apollo flight 16 16th – 27th April 1972 Fifth landing on the
moon
Young, Duke, and
Mattingly
Apollo flight 17 7th – 19th December 1972 Last landing on the
moon
Cernan, Schmitt, and
Evans
Source: NASA (2019)
The famous moon mission was the Apollo 13, due to its extraordinary conditions a
movie was made about it. The objective of the mission was to land man on the moon for the
third time. However, the spacecraft malfunctioned prompting immediate return to the Earth.
However, all the astronauts managed to land safely back to Earth. The craft made it to the
translunar phase before encountering oxygen malfunction.
Launching of Spacecraft
The spacecraft for Apollo mission were all launched on Saturn V rocket made up of
three stages. The initial stage of manning the spacecraft to the moon used up the first two
stages of fuel in the rocket. The final stage of rocket fuel was used to push CM and LM to the
moon orbit. The LM and CM separated from each other with LM pushed to the moon surface
while CM remained in the moon orbit. Only two astronauts in the LM were to land on the
A BRIEF STATISTICAL LOOK AT APOLLO 6
moon surface while the command Module circled the moon waiting for the return of the LM
astronauts. On Apollo 15, 16 and 17 lunar rovers were used to explore the moon
environment. However, on each of the last three missions, the rovers were never returned to
earth. The design of the rovers allowed them to be folded in order to fit in the storage area of
the LM.
Objective and Hypothesis
This paper will compare and contrast Apollo 11, 12, 13, 14, 15, 16, and 17 missions
times spent in earth orbit, translunar phase, lunar orbit, time on the lunar surface, and
transearth phase from the expected times prior to the mission. The main hypothesis for the
study is that the time spent in the translunar phase is greater than the time spent in the
transearth phase. The mathematical expression of the hypothesis is as follows:
The null hypothesis, Ho: μL=μE against
The alternative hypothesis, Ha: μL> μE
The hypothesis is one-sided with the assumption that the time spent in the translunar and
earth phase is from a normally distributed population. The significance level is set at 5% (α =
0.05) for one-sided t-tests.
A BRIEF STATISTICAL LOOK AT APOLLO 7
Statistical Analysis
This section presents the raw data collected for the number of hours spent on the
various phases of the Apollo missions.
Description of Data
The data in Table 2 shows the amount of time spent in earth orbit, translunar phase,
lunar orbit, time on lunar (outside Lunar Module, LM), and transearth phase. From the
original source, the times were given in hour: minute: seconds format. However, for this
analysis, the data were converted to hours as shown in table 2. Apollo 13 mission was not
included in the data because the mission failed after entering the translunar phase.
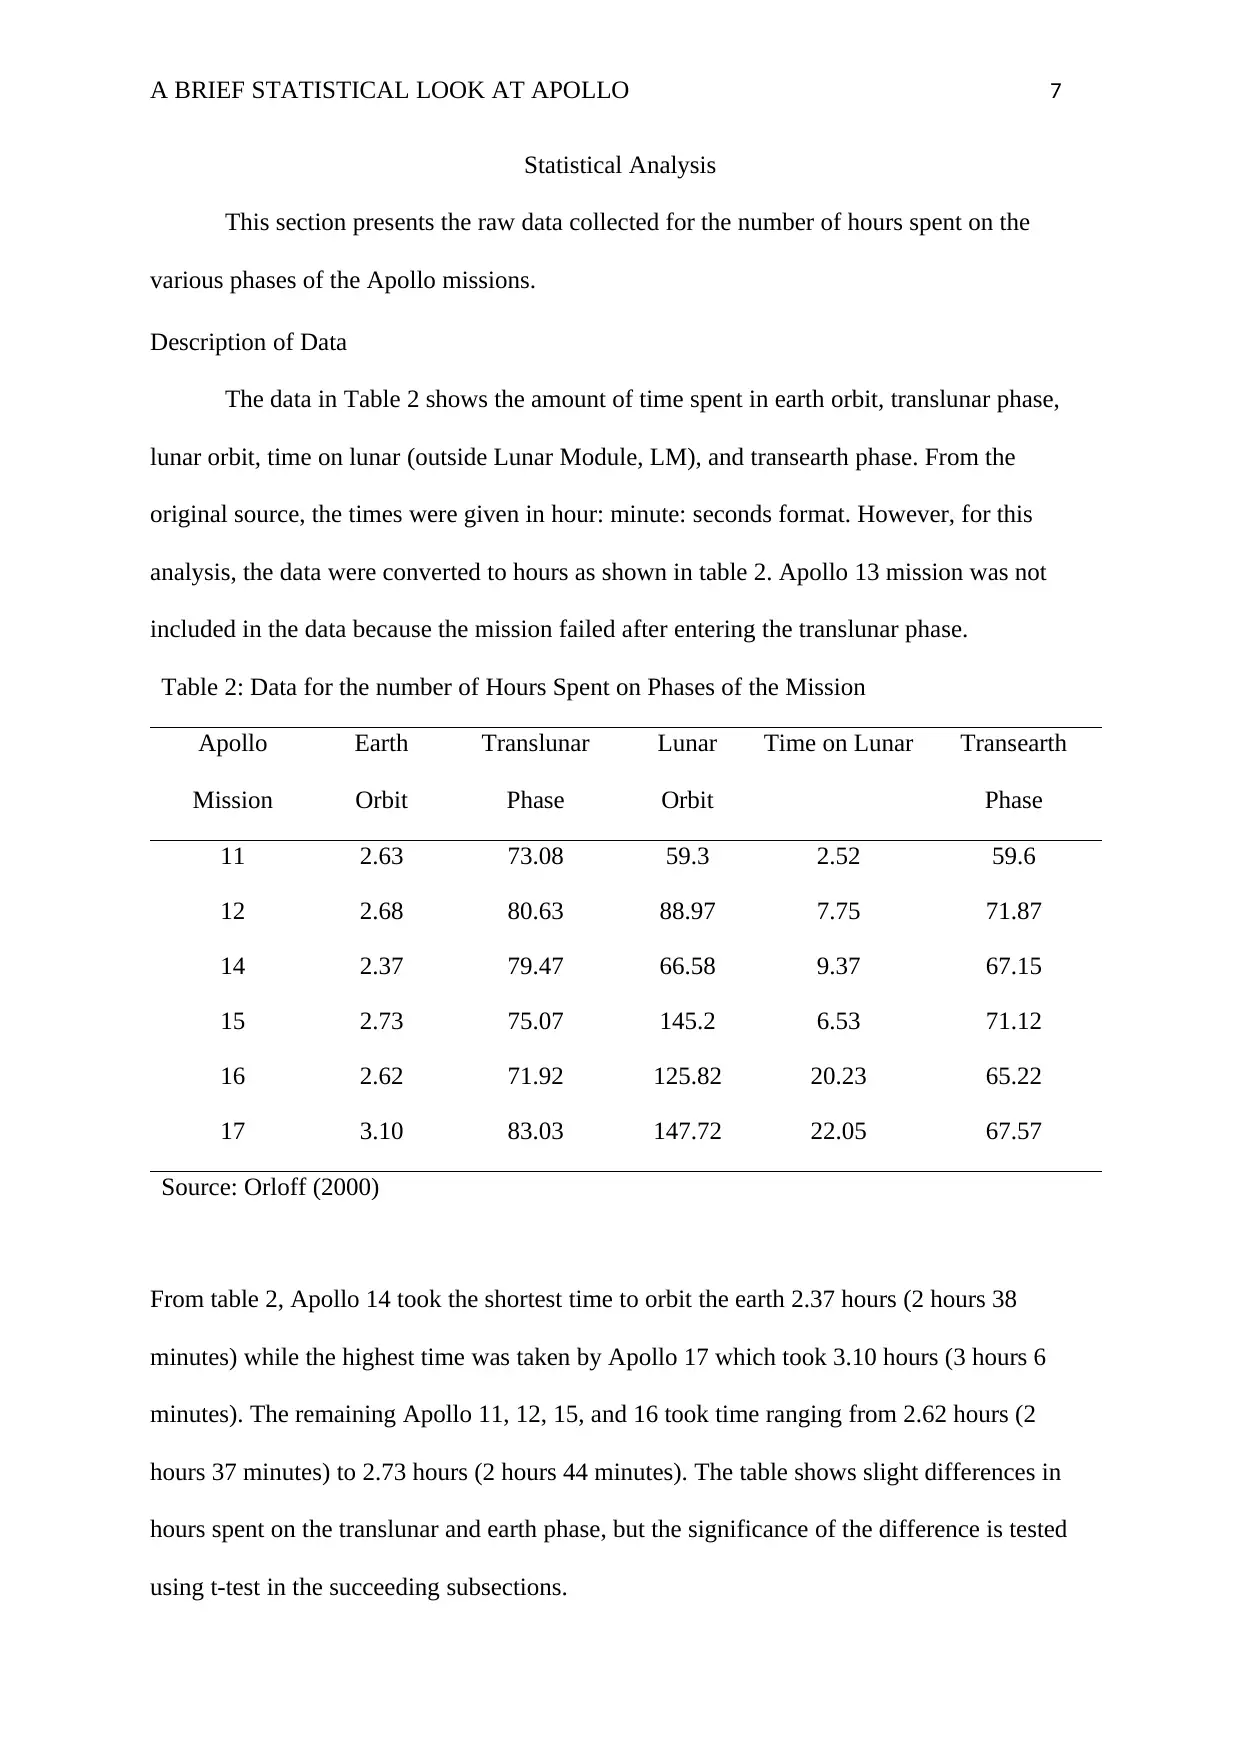
Table 2: Data for the number of Hours Spent on Phases of the Mission
Apollo
Mission
Earth
Orbit
Translunar
Phase
Lunar
Orbit
Time on Lunar Transearth
Phase
11 2.63 73.08 59.3 2.52 59.6
12 2.68 80.63 88.97 7.75 71.87
14 2.37 79.47 66.58 9.37 67.15
15 2.73 75.07 145.2 6.53 71.12
16 2.62 71.92 125.82 20.23 65.22
17 3.10 83.03 147.72 22.05 67.57
Source: Orloff (2000)
From table 2, Apollo 14 took the shortest time to orbit the earth 2.37 hours (2 hours 38
minutes) while the highest time was taken by Apollo 17 which took 3.10 hours (3 hours 6
minutes). The remaining Apollo 11, 12, 15, and 16 took time ranging from 2.62 hours (2
hours 37 minutes) to 2.73 hours (2 hours 44 minutes). The table shows slight differences in
hours spent on the translunar and earth phase, but the significance of the difference is tested
using t-test in the succeeding subsections.
Statistical Analysis
This section presents the raw data collected for the number of hours spent on the
various phases of the Apollo missions.
Description of Data
The data in Table 2 shows the amount of time spent in earth orbit, translunar phase,
lunar orbit, time on lunar (outside Lunar Module, LM), and transearth phase. From the
original source, the times were given in hour: minute: seconds format. However, for this
analysis, the data were converted to hours as shown in table 2. Apollo 13 mission was not
included in the data because the mission failed after entering the translunar phase.
Table 2: Data for the number of Hours Spent on Phases of the Mission
Apollo
Mission
Earth
Orbit
Translunar
Phase
Lunar
Orbit
Time on Lunar Transearth
Phase
11 2.63 73.08 59.3 2.52 59.6
12 2.68 80.63 88.97 7.75 71.87
14 2.37 79.47 66.58 9.37 67.15
15 2.73 75.07 145.2 6.53 71.12
16 2.62 71.92 125.82 20.23 65.22
17 3.10 83.03 147.72 22.05 67.57
Source: Orloff (2000)
From table 2, Apollo 14 took the shortest time to orbit the earth 2.37 hours (2 hours 38
minutes) while the highest time was taken by Apollo 17 which took 3.10 hours (3 hours 6
minutes). The remaining Apollo 11, 12, 15, and 16 took time ranging from 2.62 hours (2
hours 37 minutes) to 2.73 hours (2 hours 44 minutes). The table shows slight differences in
hours spent on the translunar and earth phase, but the significance of the difference is tested
using t-test in the succeeding subsections.
Paraphrase This Document
Need a fresh take? Get an instant paraphrase of this document with our AI Paraphraser
A BRIEF STATISTICAL LOOK AT APOLLO 8
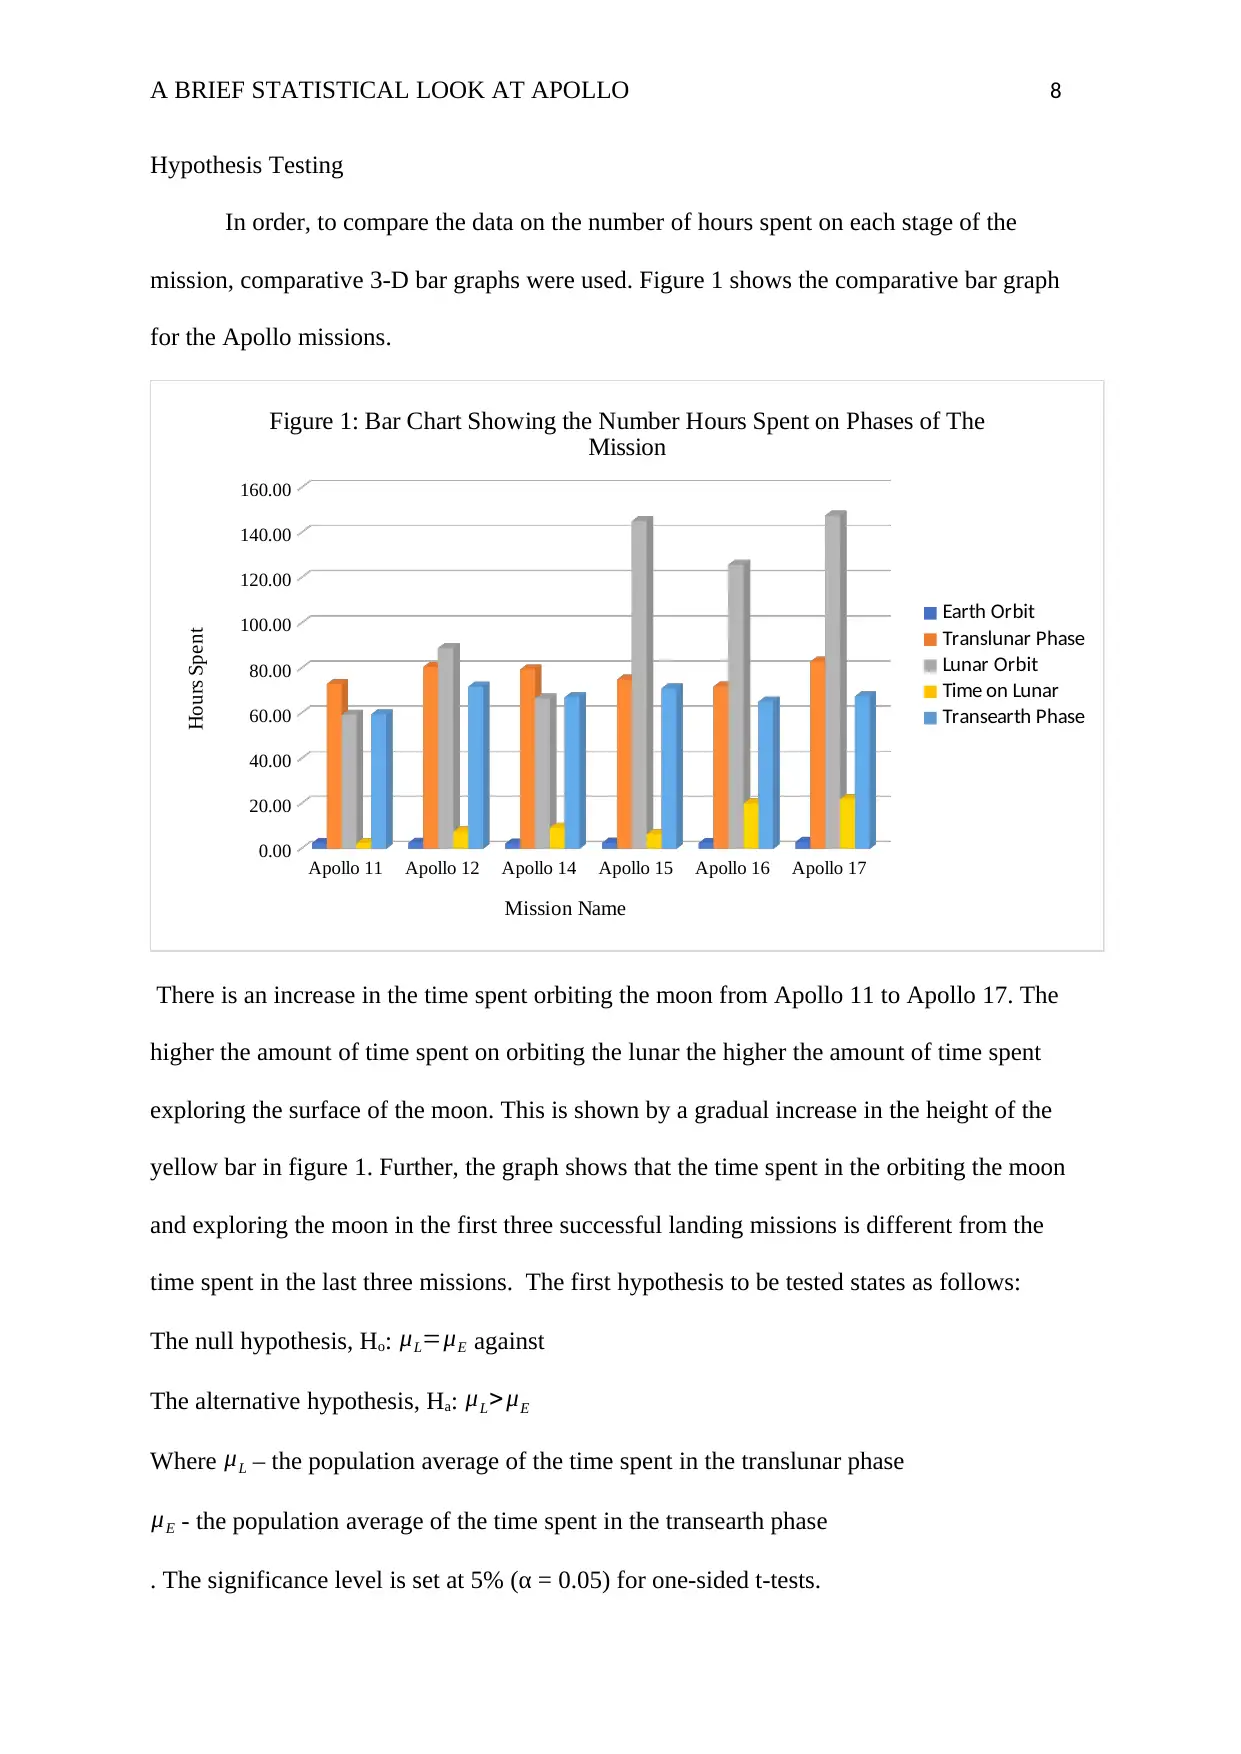
Hypothesis Testing
In order, to compare the data on the number of hours spent on each stage of the
mission, comparative 3-D bar graphs were used. Figure 1 shows the comparative bar graph
for the Apollo missions.
Apollo 11 Apollo 12 Apollo 14 Apollo 15 Apollo 16 Apollo 17
0.00
20.00
40.00
60.00
80.00
100.00
120.00
140.00
160.00
Figure 1: Bar Chart Showing the Number Hours Spent on Phases of The
Mission
Earth Orbit
Translunar Phase
Lunar Orbit
Time on Lunar
Transearth Phase
Mission Name
Hours Spent
There is an increase in the time spent orbiting the moon from Apollo 11 to Apollo 17. The
higher the amount of time spent on orbiting the lunar the higher the amount of time spent
exploring the surface of the moon. This is shown by a gradual increase in the height of the
yellow bar in figure 1. Further, the graph shows that the time spent in the orbiting the moon
and exploring the moon in the first three successful landing missions is different from the
time spent in the last three missions. The first hypothesis to be tested states as follows:
The null hypothesis, Ho: μL=μE against
The alternative hypothesis, Ha: μL> μE
Where μL – the population average of the time spent in the translunar phase
μE - the population average of the time spent in the transearth phase
. The significance level is set at 5% (α = 0.05) for one-sided t-tests.
A BRIEF STATISTICAL LOOK AT APOLLO 9
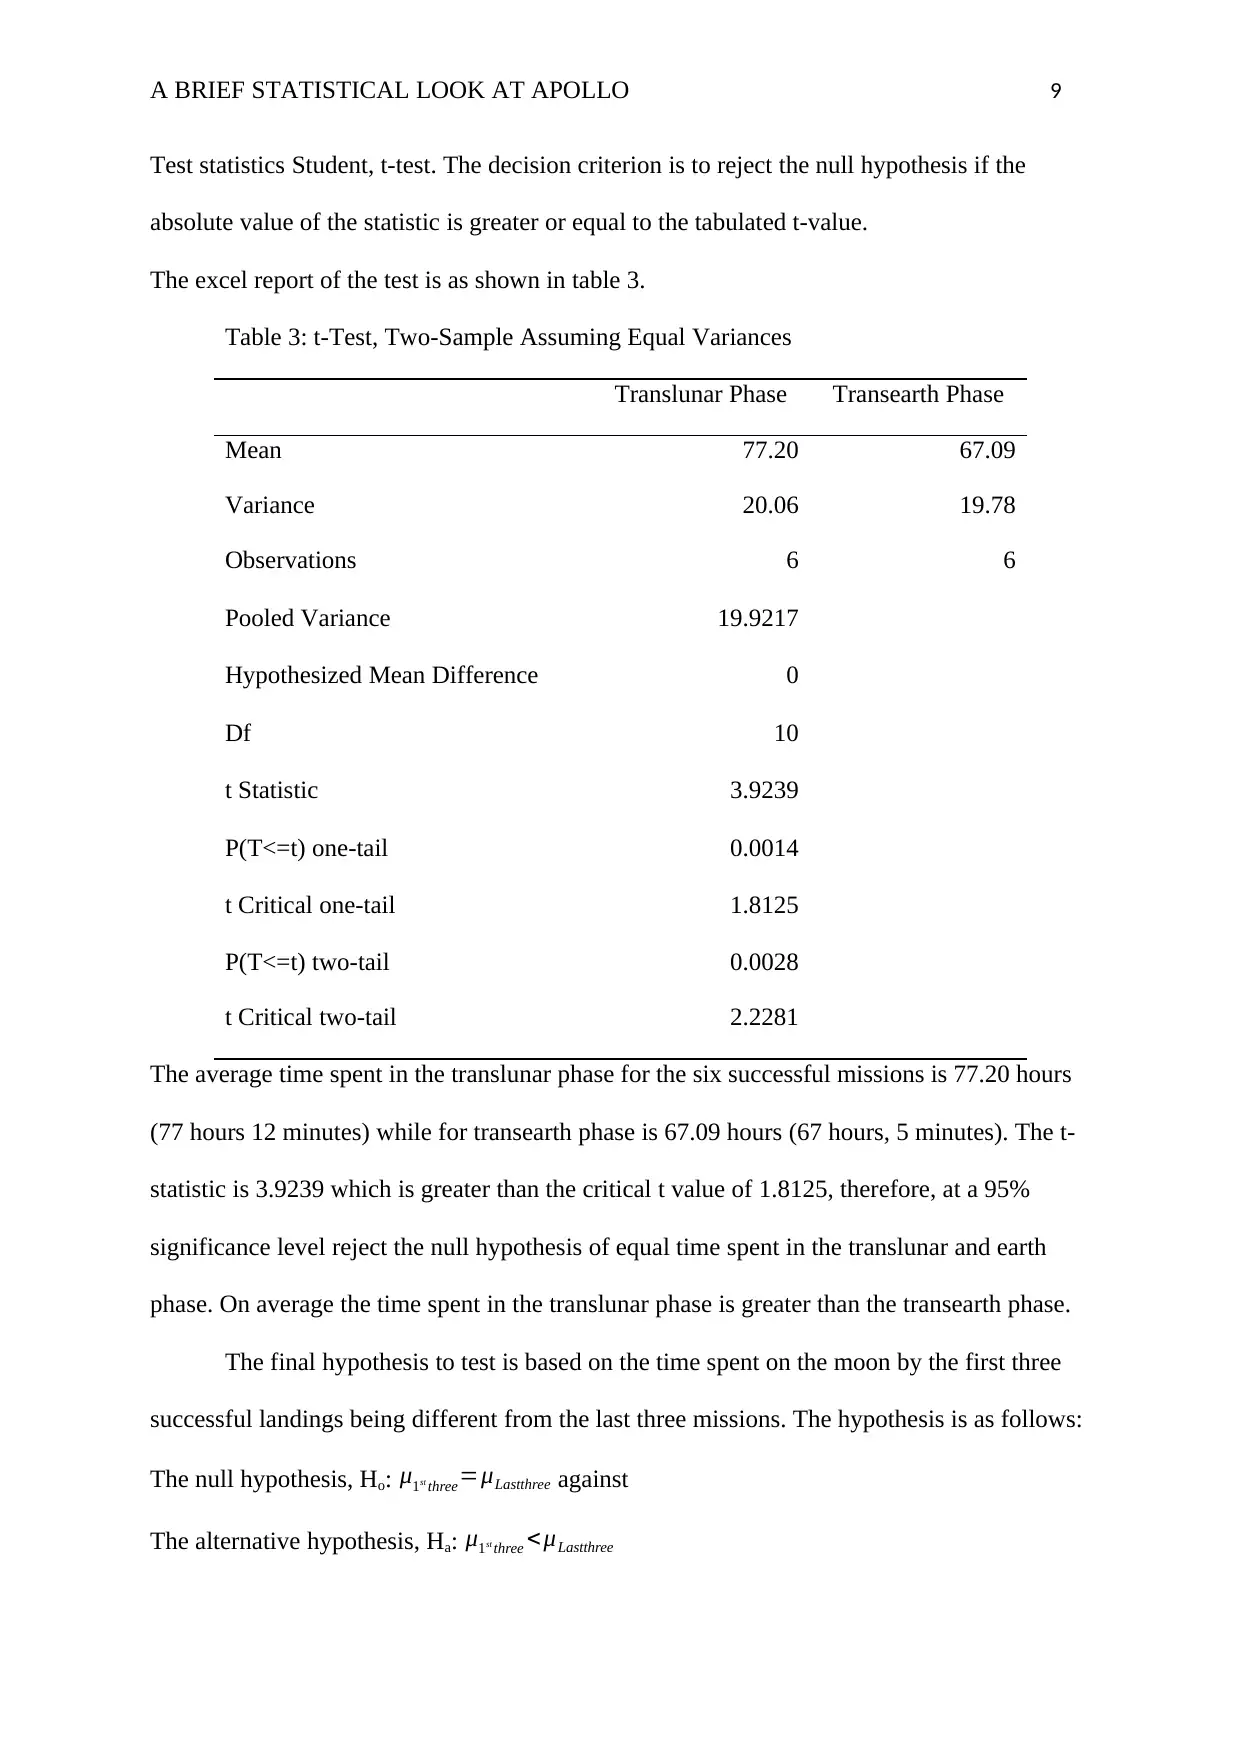
Test statistics Student, t-test. The decision criterion is to reject the null hypothesis if the
absolute value of the statistic is greater or equal to the tabulated t-value.
The excel report of the test is as shown in table 3.
Table 3: t-Test, Two-Sample Assuming Equal Variances
Translunar Phase Transearth Phase
Mean 77.20 67.09
Variance 20.06 19.78
Observations 6 6
Pooled Variance 19.9217
Hypothesized Mean Difference 0
Df 10
t Statistic 3.9239
P(T<=t) one-tail 0.0014
t Critical one-tail 1.8125
P(T<=t) two-tail 0.0028
t Critical two-tail 2.2281
The average time spent in the translunar phase for the six successful missions is 77.20 hours
(77 hours 12 minutes) while for transearth phase is 67.09 hours (67 hours, 5 minutes). The t-
statistic is 3.9239 which is greater than the critical t value of 1.8125, therefore, at a 95%
significance level reject the null hypothesis of equal time spent in the translunar and earth
phase. On average the time spent in the translunar phase is greater than the transearth phase.
The final hypothesis to test is based on the time spent on the moon by the first three
successful landings being different from the last three missions. The hypothesis is as follows:
The null hypothesis, Ho: μ1st three=μLastthree against
The alternative hypothesis, Ha: μ1st three <μLastthree
A BRIEF STATISTICAL LOOK AT APOLLO 10
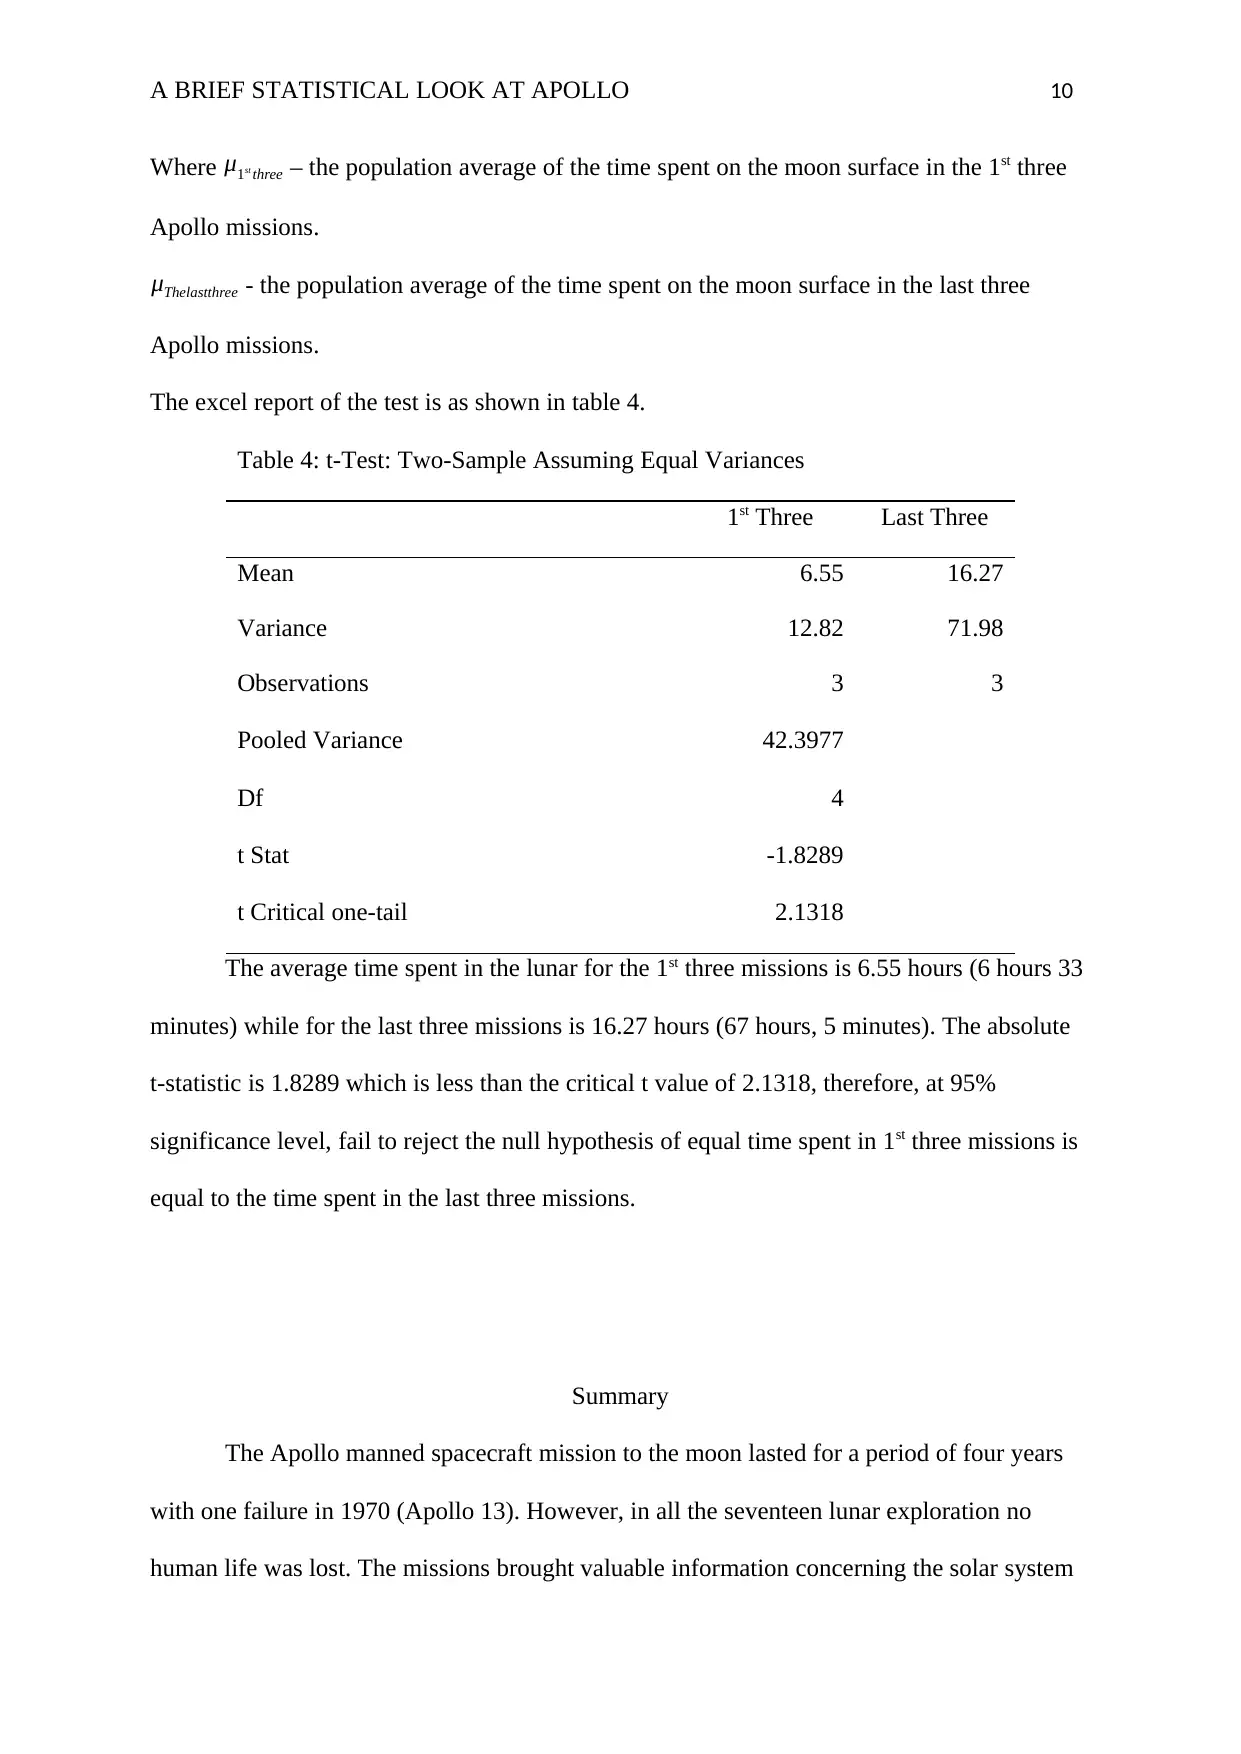
Where μ1st three – the population average of the time spent on the moon surface in the 1st three
Apollo missions.
μThelastthree - the population average of the time spent on the moon surface in the last three
Apollo missions.
The excel report of the test is as shown in table 4.
Table 4: t-Test: Two-Sample Assuming Equal Variances
1st Three Last Three
Mean 6.55 16.27
Variance 12.82 71.98
Observations 3 3
Pooled Variance 42.3977
Df 4
t Stat -1.8289
t Critical one-tail 2.1318
The average time spent in the lunar for the 1st three missions is 6.55 hours (6 hours 33
minutes) while for the last three missions is 16.27 hours (67 hours, 5 minutes). The absolute
t-statistic is 1.8289 which is less than the critical t value of 2.1318, therefore, at 95%
significance level, fail to reject the null hypothesis of equal time spent in 1st three missions is
equal to the time spent in the last three missions.
Summary
The Apollo manned spacecraft mission to the moon lasted for a period of four years
with one failure in 1970 (Apollo 13). However, in all the seventeen lunar exploration no
human life was lost. The missions brought valuable information concerning the solar system
Secure Best Marks with AI Grader
Need help grading? Try our AI Grader for instant feedback on your assignments.
A BRIEF STATISTICAL LOOK AT APOLLO 11
and the earth atmosphere. The success of the mission showed the advancement of human
knowledge in space technology. However, the time spent in the translunar phase was greater
than the time spent in the transearth phase and indication that it consumed a lot of energy to
send the spacecraft to the lunar orbit. Finally, the time spent exploring the moon surface out
of the LM for all the six successful missions on average are equal.
References
NASA. (2019, May 31). What Was the Apollo Program? (F. Wild, Ed.) Retrieved June 30,
2019, from nasa.gov: . This article
provides a summary of the Apollo missions. The document was produced by NASA
for student’s knowledge. The document is available online for the general public use.
A BRIEF STATISTICAL LOOK AT APOLLO 12
The article provides majority of information used in the study. The last time the html
file was modified is 31st May 2019.
Orloff, R. W. (2000). Apollo by the Numbers: A Statistical Reference. Retrieved June 30,
2019, from nasa.gov: . This book is separated into two
parts. The first part contains narratives for the Apollo 1 fire and the 11 flown Apollo
missions. Included after each narrative is a series of data tables, followed by a
comprehensive timeline of events from just before lift-off to just after crew and
spacecraft recovery. The second part contains more than 50 tables. These tables
organize much of the data from the narratives in one place so they can be compared
among all missions. The tables offer additional data as well. The reader can select a
specific mission narrative or specific data table by consulting the Table of Contents.
The book is available online for public use.
1 out of 12
Related Documents

Your All-in-One AI-Powered Toolkit for Academic Success.
+13062052269
info@desklib.com
Available 24*7 on WhatsApp / Email
![[object Object]](/_next/static/media/star-bottom.7253800d.svg)
Unlock your academic potential
© 2024 | Zucol Services PVT LTD | All rights reserved.