A-CAT Corporation: Time Series Forecasting of Sales and Requirements

Verified

Added on  2019/09/13

|9
|1193
|419
Report
AI Summary
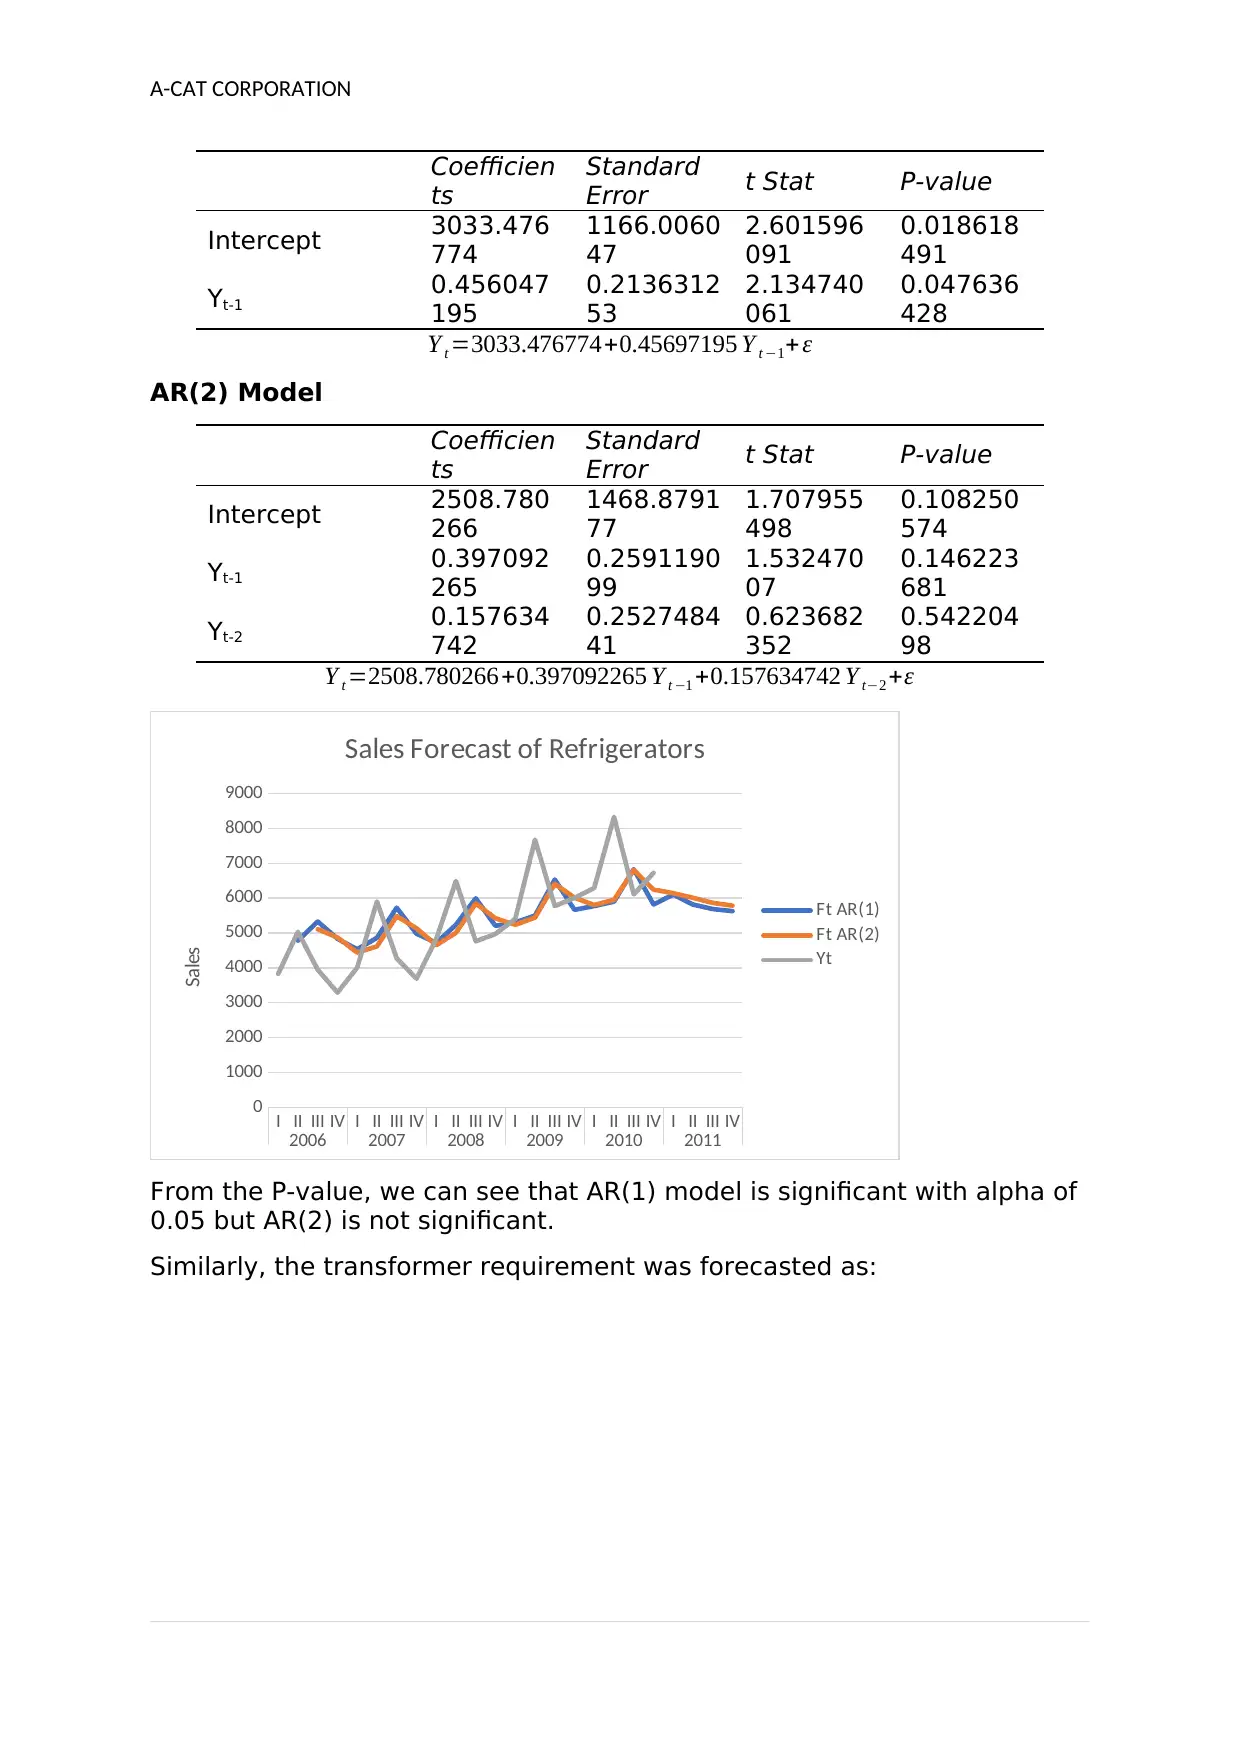
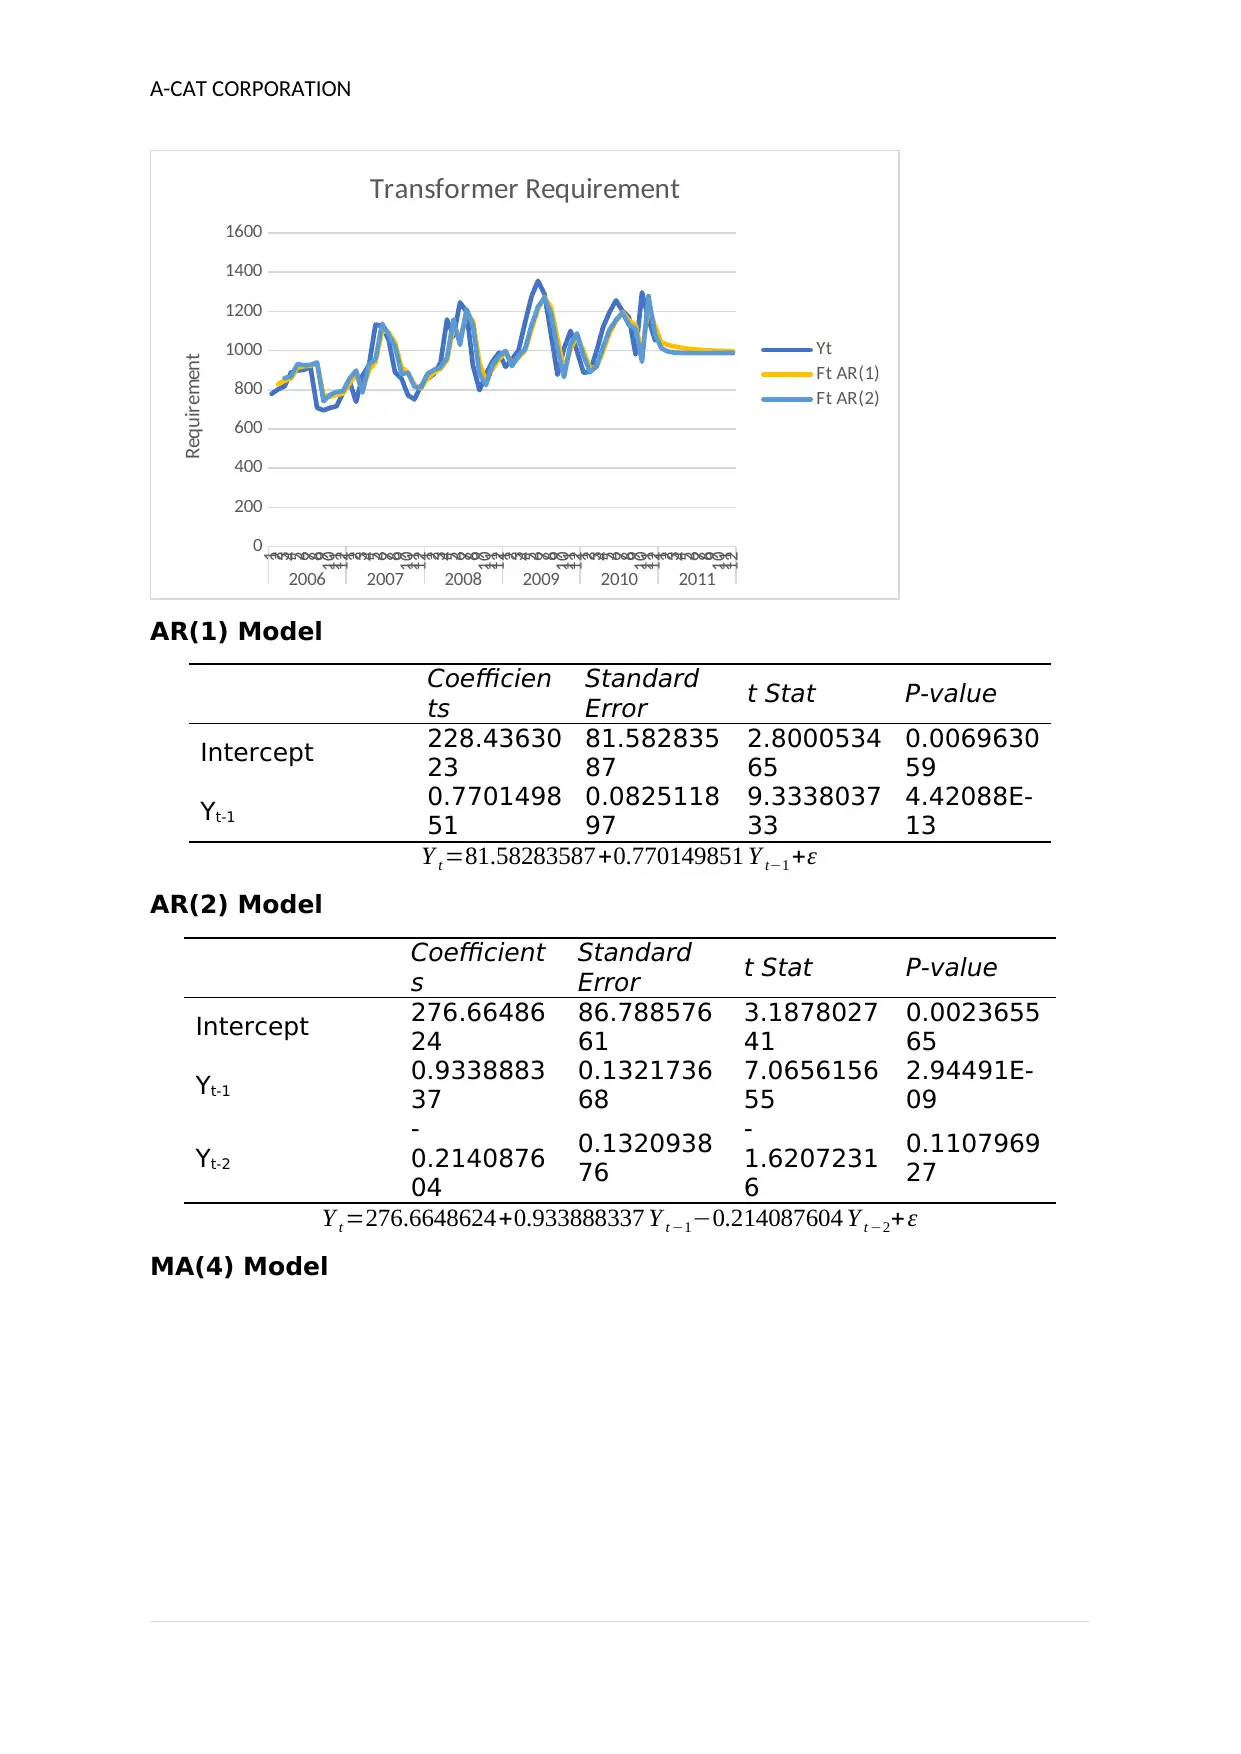
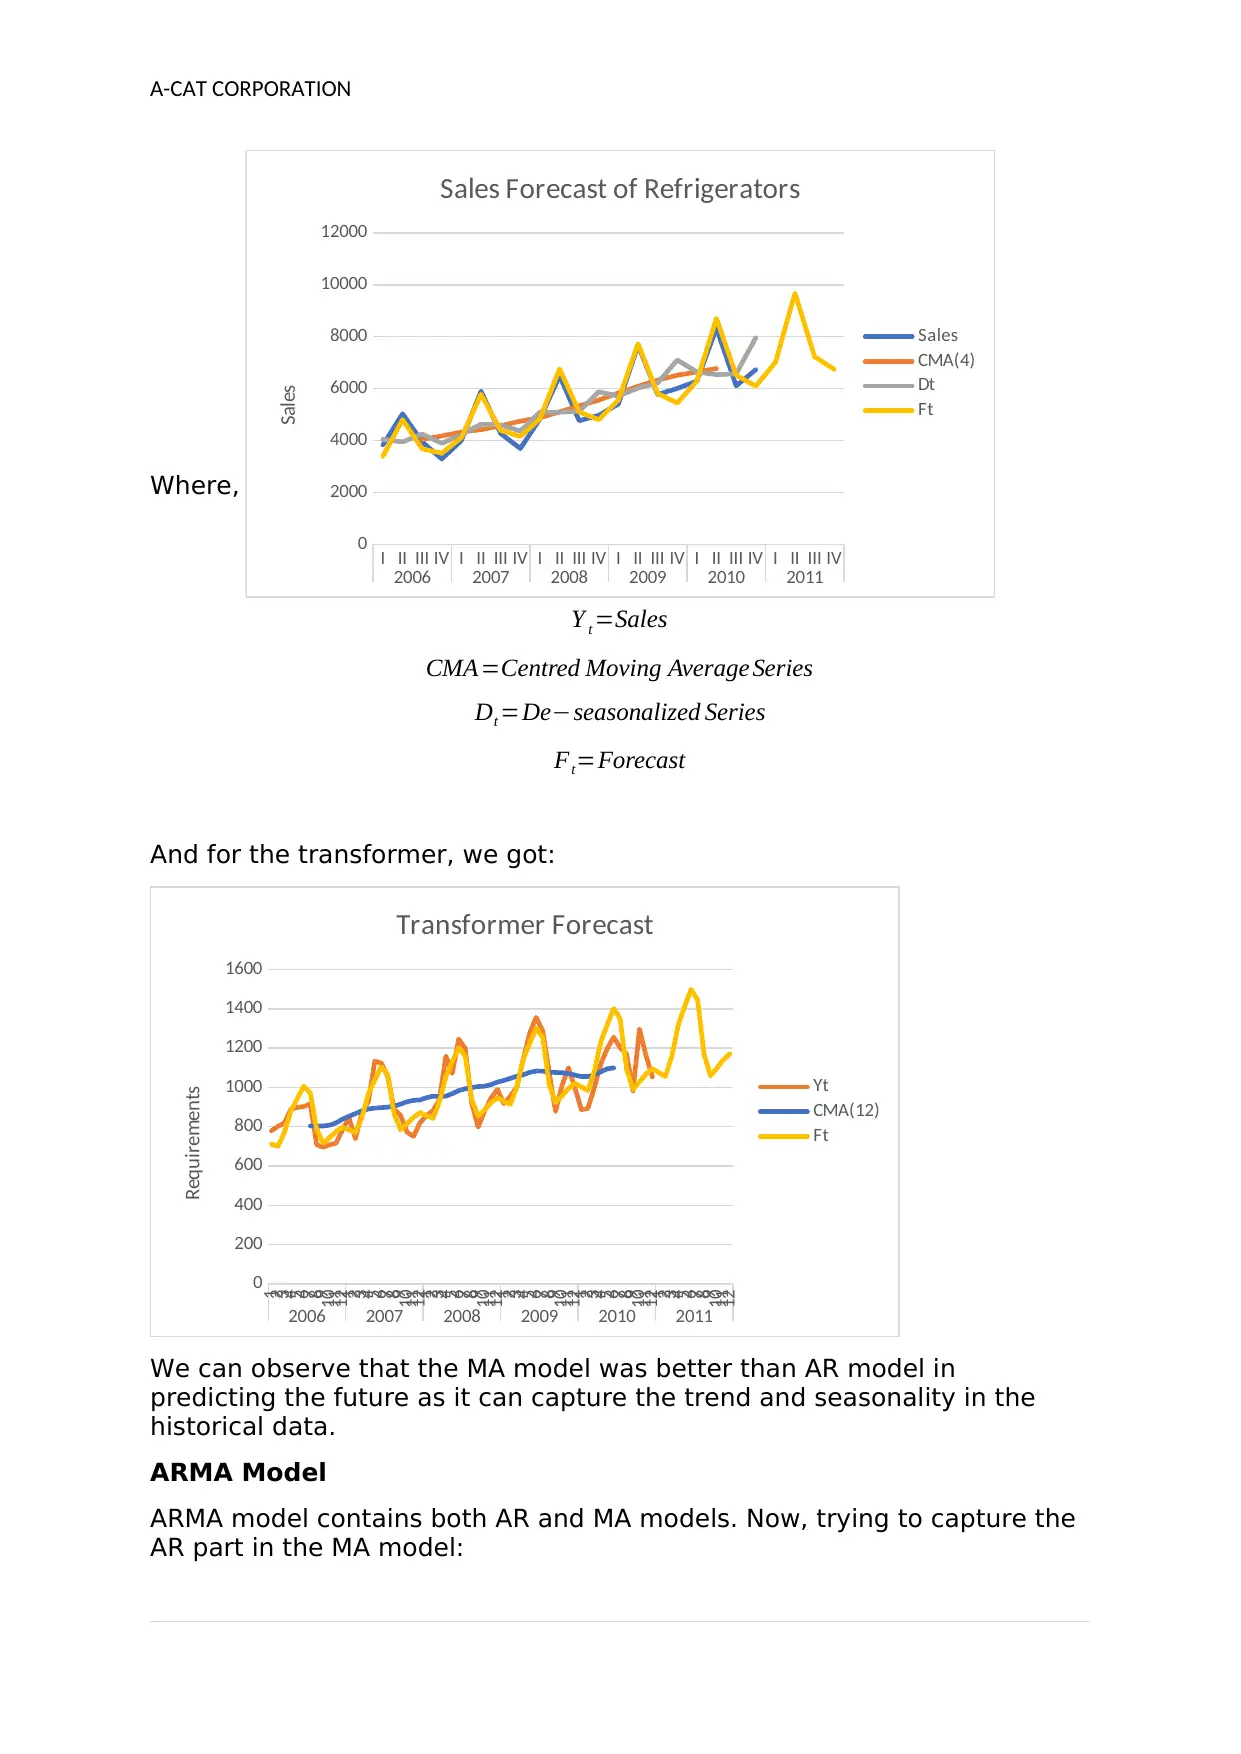
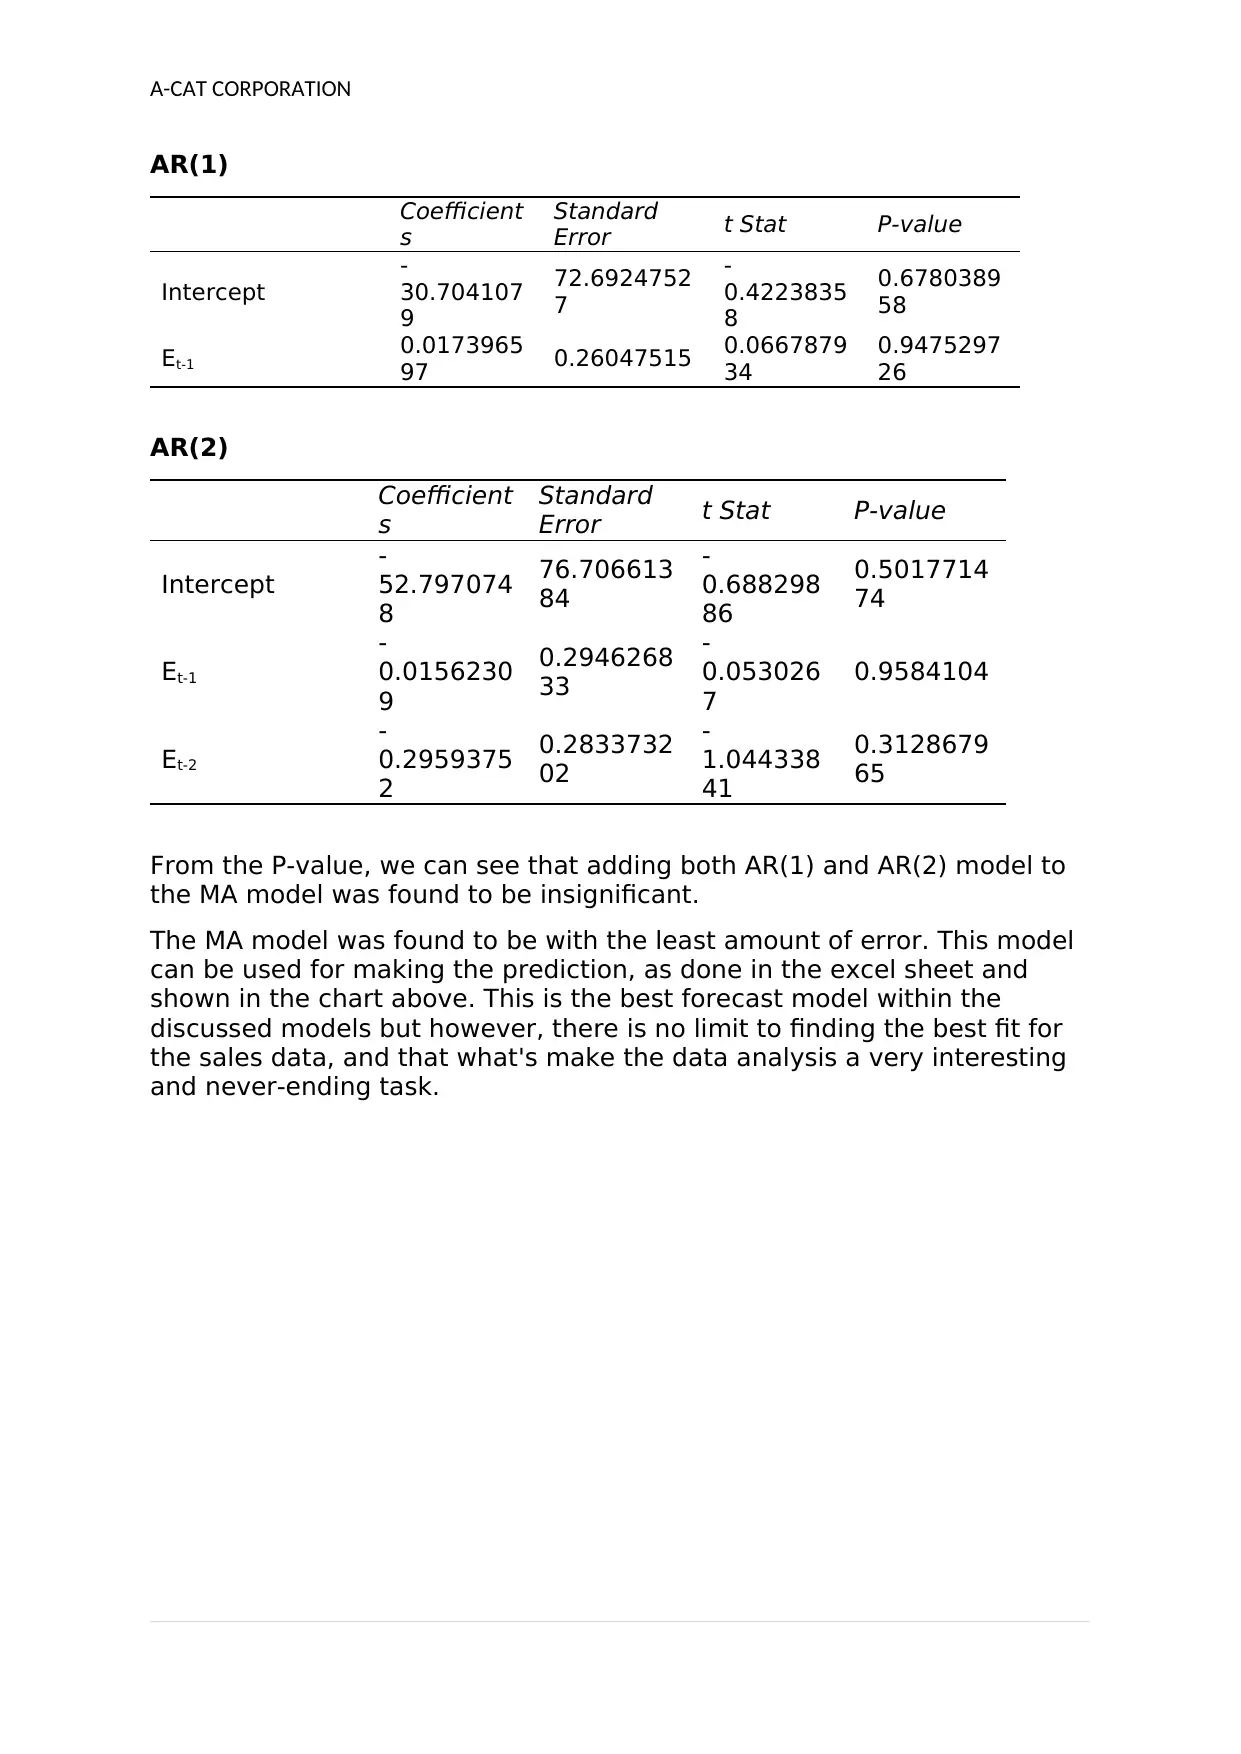
This report presents an analytical approach for forecasting transformer requirements and refrigerator sales for A-CAT Corporation to address inventory management challenges. Utilizing data from January 2006 to December 2010, the study employs time series forecasting methods, including Auto-Regression (AR), Moving-Average (MA), and ARMA models. The MA model proved to be the most effective in predicting past sales figures with the least error. The report analyzes sales trends, identifies significant factors, and provides insights into future demand, aiding A-CAT in optimizing its inventory and supply chain management. The report also includes the results of the different models used to forecast the sales and transformer requirements.
Document Page
Running Head: A-CAT CORPORATION
A-CAT CORPORATION
SEPTEMBER 26, 2018
Student Name
tabler-icon-diamond-filled.svg

Paraphrase This Document

Need a fresh take? Get an instant paraphrase of this document with our AI Paraphraser
Document Page
A-CAT CORPORATION
Executive Summary
This report aims toward providing an analytical approach for
predicting/forecasting the transformer requirements and sales of
refrigerators by A-CAT corporation in order to solve the issue of under and
over-stocking faced by the inventory department and the sales division for
providing a good measure for the right amount of inventory.
This report used different time series forecasting method to predict the
future sales and the requirements of the primary product of the company.
The study uses the data available from January’06 to December’10 to
make the prediction for next year. Three different models namely Auto-
Regression (AR model), Moving-Average (MA-model) and ARMA model was
used for the prediction.
The MA model or moving average model was found to be the best model
in terms of least error in predicting the already known sales figures.
Document Page
A-CAT CORPORATION
A-CAT Corporation
A-CAT was one of the leading producers of electrical appliances in India. It
competed with and belonged to the category of medium scale industry,
which produced and distributed domestic electrical appliances to the rural
population in and around the Vidarbha region. The company owned and
operated two medium-sized manufacturing units in a sleepy town called
Gondia, in one of the remote districts in Vidarbha, ironically a backward
region in the most progressive state of India, Maharashtra. A-CAT had an
alliance partnership with Jupiter Inc. for the production of cabinets and
had a collaborative venture with Global Electricals for manufacturing TV
signal boosters and battery chargers (Shumway, 2011).
A-CAT's primary flagship product was a voltage regulator of 500 kilovolt
amps (KVA) that was branded and sold under the tag of VR-500. These
voltage regulators were used for varied purposes but were most
commonly used in households as a protective device for refrigerators and
television sets, so as to protect the latter from the vagaries of load
fluctuations and/or frequent power failures, which were a very common
phenomenon in Vidarbha.
Forecasting Process – Significance
During the past few months, the sales of voltage regulators had fallen off.
In reaction, A-CAT recently started deliberating on its policy of purchasing
and stocking spares and components in the system especially with regard
to schedule and stock-in-hand inventory. The firm stored all its spares and
components, including the transformers, in its factory store.
Orders for the main product of A-CAT - that is, voltage regulators are
throughout the year. Most of the time, these orders were categorized as
"rush orders," and the store managers knew that the supplier of the
transformers required for the product needed at least one week, if not
more' for delivery. On top of this, it was likely that the transformer
supplier would raise prices if uniformity and continuity in placing of orders
for transformers were not guaranteed. Placing orders beyond a certain
limit also stretched the system - whereas A-CAT had previously had
access to four suppliers. Now there was only one. Moreover, the blocking
of capital had a domino effect on the purchase and inventories of other
products' spares and components. An increased cost of its primary spare
component was the last thing A-CAT needed. The sales division was
supposed to forecast the demand for voltage regulators as a measure for
determining the right amount of transformers to keep in inventory.
Document Page
A-CAT CORPORATION
January
February
March
April
May
June
July
August
September
October
November
December
0
200
400
600
800
1000
1200
1400
1600
TRA NSFORMER R EQUIR EMENTS
2006 2007 2008 2009 2010
Figure 1: Transformer Requirements
Figure 2A and 2B: Sales Figures of Refrigerators
From the Figure 1, we can observe the trend of transformer requirements
over the period of January'06 to December'10. We can see that there are
higher requirements during the month of April to July and then a dip near
the month of September followed by a slight increase during the end of
the year. This trend was almost followed in all the year, under
consideration, but there was an overall increase from the past year.
Figure 2 shows the sales figures for refrigerators during the period of
January'06 to December'10. We can observe in Figure 2A, that for every
quarter sales have almost linearly increased over the years and from
Figure 2B that the highest sales are during the 2nd quarter and the lowest
during 3rd or 4th quarter in every year (Tsay, 2005).
AR(1) Model
2006 2007 2008 2009 2010
0
1000
2000
3000
4000
5000
6000
7000
8000
9000
SALES FIGUR ES OF
REFR IGER ATOR S
I II III IV
I II III IV
0
1000
2000
3000
4000
5000
6000
7000
8000
9000
SALES FIGUR ES OF
REFRIGER ATOR S
2006 2007 2008 2009 2010
tabler-icon-diamond-filled.svg

Paraphrase This Document

Need a fresh take? Get an instant paraphrase of this document with our AI Paraphraser
Document Page
A-CAT CORPORATION
Coefficien
ts
Standard
Error t Stat P-value
Intercept 3033.476
774
1166.0060
47
2.601596
091
0.018618
491
Yt-1
0.456047
195
0.2136312
53
2.134740
061
0.047636
428
Y t =3033.476774+0.45697195 Y t −1+ ε
AR(2) Model
Coefficien
ts
Standard
Error t Stat P-value
Intercept 2508.780
266
1468.8791
77
1.707955
498
0.108250
574
Yt-1
0.397092
265
0.2591190
99
1.532470
07
0.146223
681
Yt-2
0.157634
742
0.2527484
41
0.623682
352
0.542204
98
Y t =2508.780266+0.397092265 Y t −1 +0.157634742 Y t−2 +ε
I II III IV I II III IV I II III IV I II III IV I II III IV I II III IV
2006 2007 2008 2009 2010 2011
0
1000
2000
3000
4000
5000
6000
7000
8000
9000
Sales Forecast of Refrigerators
Ft AR(1)
Ft AR(2)
Yt
Sales
From the P-value, we can see that AR(1) model is significant with alpha of
0.05 but AR(2) is not significant.
Similarly, the transformer requirement was forecasted as:
Document Page
A-CAT CORPORATION
123456789101112123456789101112123456789101112123456789101112123456789101112123456789101112
2006 2007 2008 2009 2010 2011
0
200
400
600
800
1000
1200
1400
1600
Transformer Requirement
Yt
Ft AR(1)
Ft AR(2)
Requirement
AR(1) Model
Coefficien
ts
Standard
Error t Stat P-value
Intercept 228.43630
23
81.582835
87
2.8000534
65
0.0069630
59
Yt-1
0.7701498
51
0.0825118
97
9.3338037
33
4.42088E-
13
Y t =81.58283587+0.770149851 Y t−1 +ε
AR(2) Model
Coefficient
s
Standard
Error t Stat P-value
Intercept 276.66486
24
86.788576
61
3.1878027
41
0.0023655
65
Yt-1
0.9338883
37
0.1321736
68
7.0656156
55
2.94491E-
09
Yt-2
-
0.2140876
04
0.1320938
76
-
1.6207231
6
0.1107969
27
Y t =276.6648624+0.933888337 Y t −1−0.214087604 Y t −2+ ε
MA(4) Model
Document Page
A-CAT CORPORATION
Where,
Y t =Sales
CMA=Centred Moving Average Series
Dt =De−seasonalized Series
Ft=Forecast
And for the transformer, we got:
123456789101112123456789101112123456789101112123456789101112123456789101112123456789101112
2006 2007 2008 2009 2010 2011
0
200
400
600
800
1000
1200
1400
1600
Transformer Forecast
Yt
CMA(12)
Ft
Requirements
We can observe that the MA model was better than AR model in
predicting the future as it can capture the trend and seasonality in the
historical data.
ARMA Model
ARMA model contains both AR and MA models. Now, trying to capture the
AR part in the MA model:
I II III IV I II III IV I II III IV I II III IV I II III IV I II III IV
2006 2007 2008 2009 2010 2011
0
2000
4000
6000
8000
10000
12000
Sales Forecast of Refrigerators
Sales
CMA(4)
Dt
Ft
Sales
tabler-icon-diamond-filled.svg

Paraphrase This Document

Need a fresh take? Get an instant paraphrase of this document with our AI Paraphraser
Document Page
A-CAT CORPORATION
AR(1)
Coefficient
s
Standard
Error t Stat P-value
Intercept
-
30.704107
9
72.6924752
7
-
0.4223835
8
0.6780389
58
Et-1
0.0173965
97 0.26047515 0.0667879
34
0.9475297
26
AR(2)
Coefficient
s
Standard
Error t Stat P-value
Intercept
-
52.797074
8
76.706613
84
-
0.688298
86
0.5017714
74
Et-1
-
0.0156230
9
0.2946268
33
-
0.053026
7
0.9584104
Et-2
-
0.2959375
2
0.2833732
02
-
1.044338
41
0.3128679
65
From the P-value, we can see that adding both AR(1) and AR(2) model to
the MA model was found to be insignificant.
The MA model was found to be with the least amount of error. This model
can be used for making the prediction, as done in the excel sheet and
shown in the chart above. This is the best forecast model within the
discussed models but however, there is no limit to finding the best fit for
the sales data, and that what's make the data analysis a very interesting
and never-ending task.
Document Page
A-CAT CORPORATION
References
Shumway, R. H., & Stoffer, D. S. (2011). Time series regression and
exploratory data analysis. In Time series analysis and its applications (pp.
47-82). Springer New York.
Tsay, R. S. (2005). Analysis of financial time series (Vol. 543). John Wiley &
Sons.
chevron_up_icon
1 out of 9
circle_padding
hide_on_mobile
zoom_out_icon
[object Object]