Electroencephalogram (EEG): Fundamental, Measurement Process and Implementation of Digital Filter in MATLAB
Added on 2023-01-17
14 Pages3270 Words46 Views
A
REPORT / COURSE WORK
ON
ELECTROENCEPHALOGRAM (EEG):
FUNDAMENTAL, MEASUREMENT PROCESS
AND
IMPLEMENTATION OF DIGITAL FILTER IN MATLAB
In partial fulfillment for the award of the Degree of
BEng (GCU) IN Electronics and Instrumentation Engineering
Submitted by
NAME:
Reg no:
Bio-Medical Instrumentation
MHH624668
ACKNOWLEDGEMENT
I would like to express my sincere gratitude and appreciation to my supervisor NAME,
DESIGNATION for guiding me throughout all my course work technically and
methodologically.
I would like to thank all the teaching and non-teaching staffs of Dept and Institute name, for
providing enormous support to carry out my research works. I would like to thank all my
colleagues of Institute name, for providing their support in various manners during my course
works.

Abstract: This report briefs about the fundamental of electroencephalography
(EEG). Discussion of brain waves associated with EEG signals, its characteristics,
different sensors and measurement methods are listed. In section II a digital filter
(IIR, butterworth) has been designed and implemented in Matlab platform to remove
the unwanted noise interference, which affects and distorts the EEG recording during
diagnosis and treatment in hospital.
Introduction:
There are billions of neuron cell present in human brain. Any conjugate activity
among the neurons, which are internally connected through the synapses, produces
very precise electrical stimulus. These stimuli are known as the action potential or
the postsynaptic potential of cell. EEG is basically a method to capture those
potential in terms of electrical signal. The characteristic of the signal defines various
parameters related to human brain, like: any abnormalities of brain, state of mind.
Now-a-days this subject is becoming very popular among the researchers as it can
reveal important features about the state of mind. EEG is very useful for medical
applications: detection, diagnosis and treatment. Besides medical applications, EEG
is widely used in the field of BCI (Brain Computer Interface), where the bio-signal
can be processed to interface with computer and control various electrical devices.
I. Fundamentals
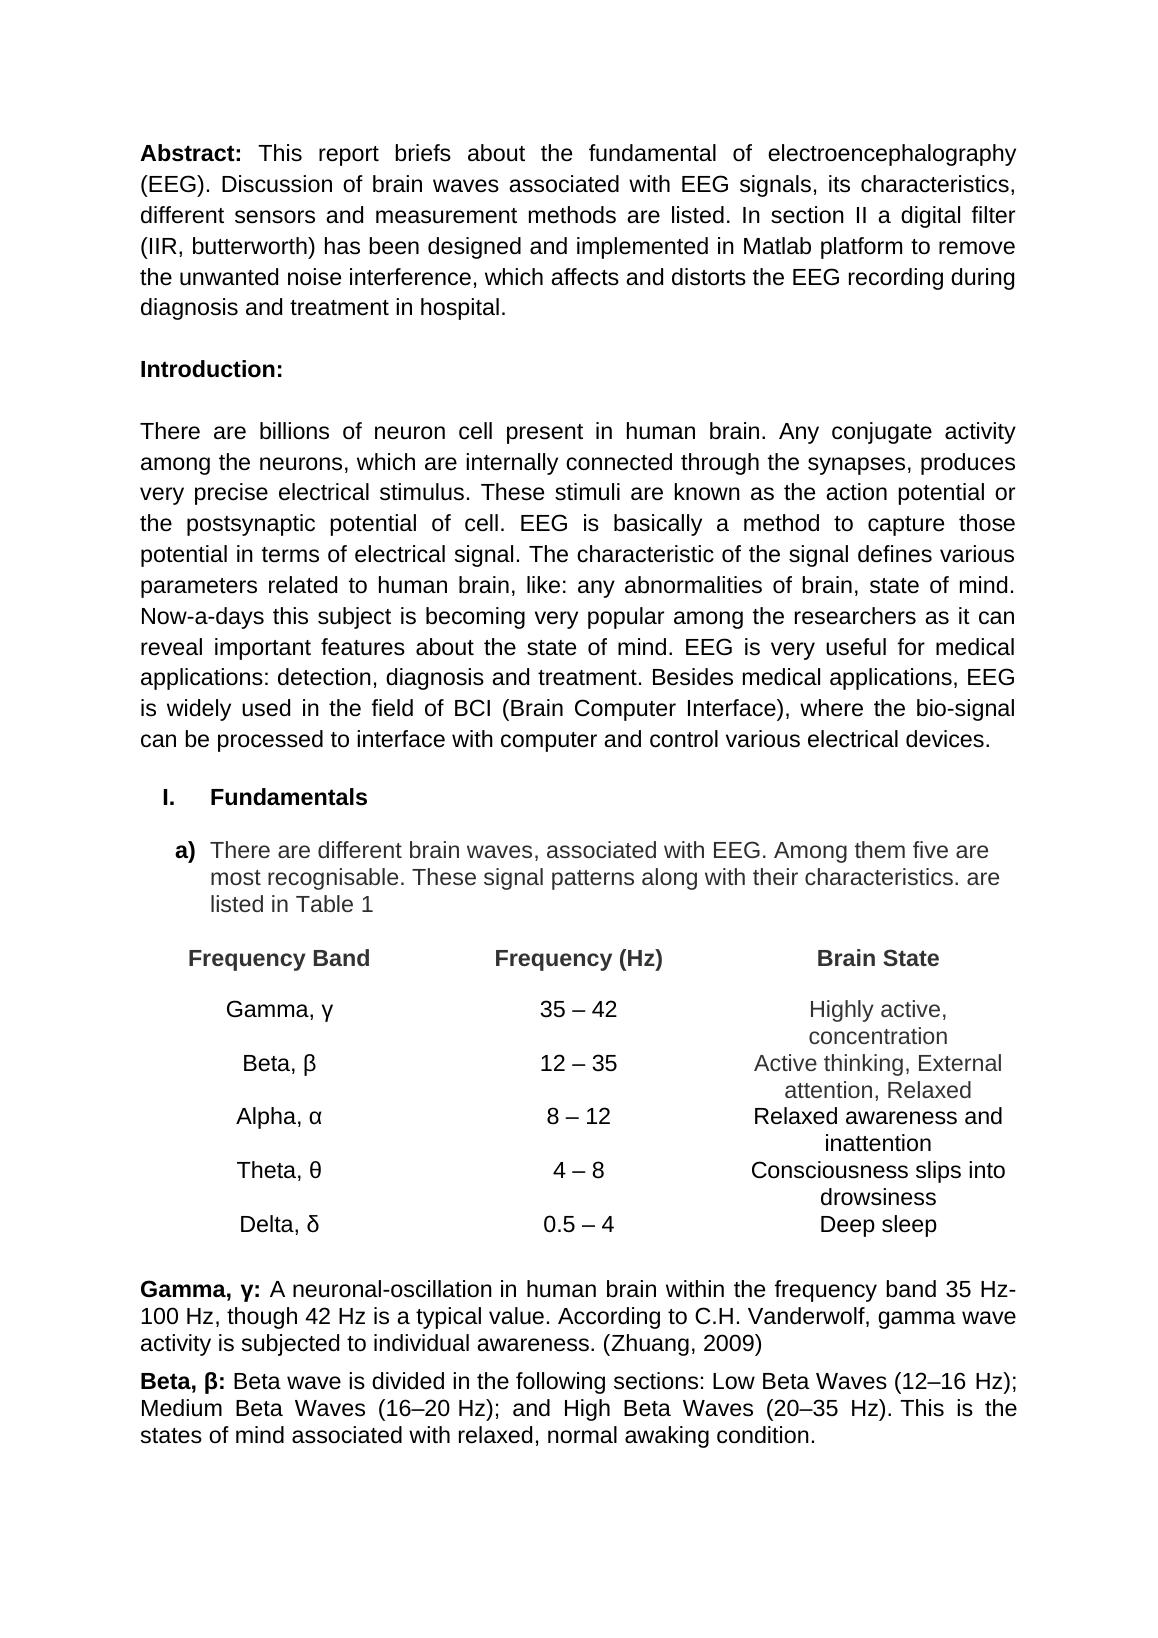
a) There are different brain waves, associated with EEG. Among them five are
most recognisable. These signal patterns along with their characteristics. are
listed in Table 1
Frequency Band Frequency (Hz) Brain State
Gamma, γ 35 – 42 Highly active,
concentration
Beta, β 12 – 35 Active thinking, External
attention, Relaxed
Alpha, α 8 – 12 Relaxed awareness and
inattention
Theta, θ 4 – 8 Consciousness slips into
drowsiness
Delta, δ 0.5 – 4 Deep sleep
Gamma, γ: A neuronal-oscillation in human brain within the frequency band 35 Hz-
100 Hz, though 42 Hz is a typical value. According to C.H. Vanderwolf, gamma wave
activity is subjected to individual awareness. (Zhuang, 2009)
Beta, β: Beta wave is divided in the following sections: Low Beta Waves (12–16 Hz);
Medium Beta Waves (16–20 Hz); and High Beta Waves (20–35 Hz). This is the
states of mind associated with relaxed, normal awaking condition.
(EEG). Discussion of brain waves associated with EEG signals, its characteristics,
different sensors and measurement methods are listed. In section II a digital filter
(IIR, butterworth) has been designed and implemented in Matlab platform to remove
the unwanted noise interference, which affects and distorts the EEG recording during
diagnosis and treatment in hospital.
Introduction:
There are billions of neuron cell present in human brain. Any conjugate activity
among the neurons, which are internally connected through the synapses, produces
very precise electrical stimulus. These stimuli are known as the action potential or
the postsynaptic potential of cell. EEG is basically a method to capture those
potential in terms of electrical signal. The characteristic of the signal defines various
parameters related to human brain, like: any abnormalities of brain, state of mind.
Now-a-days this subject is becoming very popular among the researchers as it can
reveal important features about the state of mind. EEG is very useful for medical
applications: detection, diagnosis and treatment. Besides medical applications, EEG
is widely used in the field of BCI (Brain Computer Interface), where the bio-signal
can be processed to interface with computer and control various electrical devices.
I. Fundamentals
a) There are different brain waves, associated with EEG. Among them five are
most recognisable. These signal patterns along with their characteristics. are
listed in Table 1
Frequency Band Frequency (Hz) Brain State
Gamma, γ 35 – 42 Highly active,
concentration
Beta, β 12 – 35 Active thinking, External
attention, Relaxed
Alpha, α 8 – 12 Relaxed awareness and
inattention
Theta, θ 4 – 8 Consciousness slips into
drowsiness
Delta, δ 0.5 – 4 Deep sleep
Gamma, γ: A neuronal-oscillation in human brain within the frequency band 35 Hz-
100 Hz, though 42 Hz is a typical value. According to C.H. Vanderwolf, gamma wave
activity is subjected to individual awareness. (Zhuang, 2009)
Beta, β: Beta wave is divided in the following sections: Low Beta Waves (12–16 Hz);
Medium Beta Waves (16–20 Hz); and High Beta Waves (20–35 Hz). This is the
states of mind associated with relaxed, normal awaking condition.
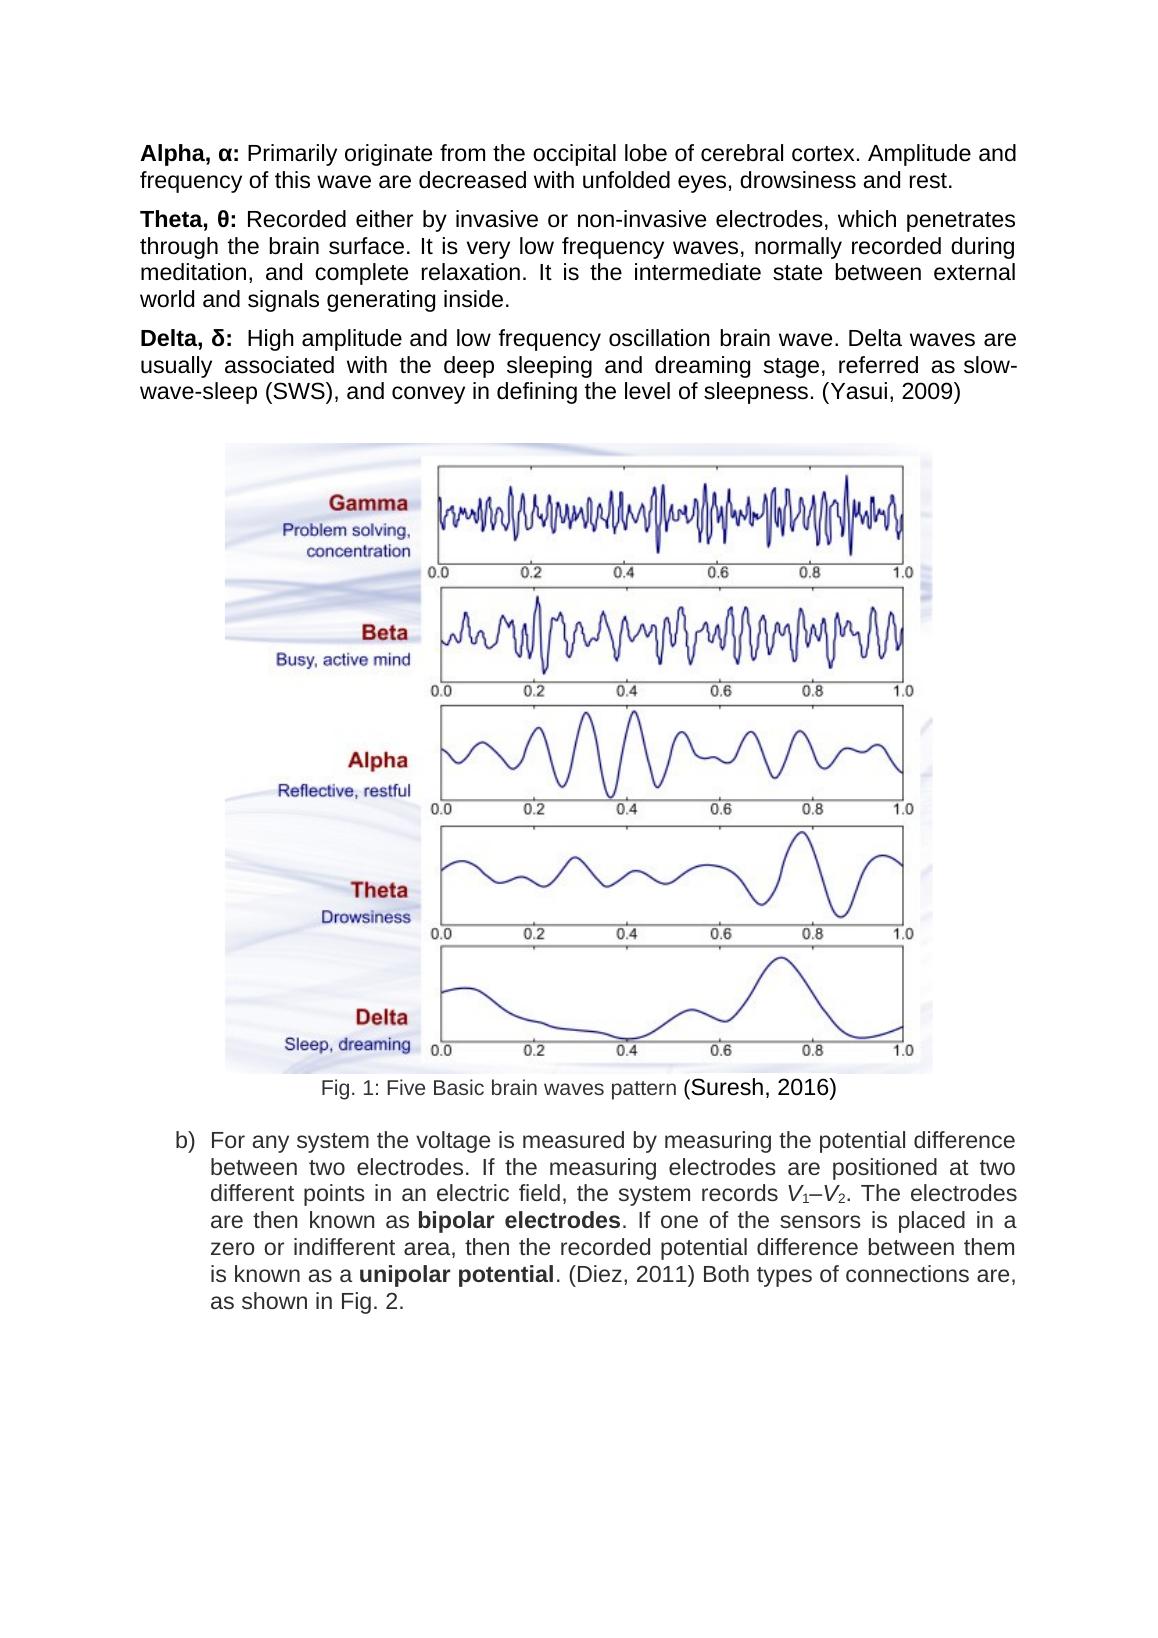
Alpha, α: Primarily originate from the occipital lobe of cerebral cortex. Amplitude and
frequency of this wave are decreased with unfolded eyes, drowsiness and rest.
Theta, θ: Recorded either by invasive or non-invasive electrodes, which penetrates
through the brain surface. It is very low frequency waves, normally recorded during
meditation, and complete relaxation. It is the intermediate state between external
world and signals generating inside.
Delta, δ: High amplitude and low frequency oscillation brain wave. Delta waves are
usually associated with the deep sleeping and dreaming stage, referred as slow-
wave-sleep (SWS), and convey in defining the level of sleepness. (Yasui, 2009)
Fig. 1: Five Basic brain waves pattern (Suresh, 2016)
b) For any system the voltage is measured by measuring the potential difference
between two electrodes. If the measuring electrodes are positioned at two
different points in an electric field, the system records V1–V2. The electrodes
are then known as bipolar electrodes. If one of the sensors is placed in a
zero or indifferent area, then the recorded potential difference between them
is known as a unipolar potential. (Diez, 2011) Both types of connections are,
as shown in Fig. 2.
End of preview
Want to access all the pages? Upload your documents or become a member.
Related Documents
A REPORT / COURSE WORK.lg...
|13
|3282
|99