TASK AWELFARE EFFECTS OF GOVERNMENT INTRODUCTION 1 TASK B PRODUCTION DECISIONS
20 Pages2955 Words127 Views
Added on 2020-07-23
About This Document
ABOLITION OF MAHOGANY HARVESTING, INCENTIVES AND HOMICIDE TABLE OF CONTENT INTRODUCTION 1 TASK AWELFARE EFFECTS OF GOVERNMENT INTERVENTION 1 (A) 1 (B) 3 (C) (i) 3 (C) (ii) 5 (C) (iii) 6 (D) 6 TASK B PRODUCTION DECISIONS 7 A. It shows restriction on the supply quantity, which will affect the equilibrium point (demand =
TASK AWELFARE EFFECTS OF GOVERNMENT INTRODUCTION 1 TASK B PRODUCTION DECISIONS
Added on 2020-07-23
ShareRelated Documents
ABOLITION OFMAHOGANY HARVESTING,INCENTIVES ANDHOMICIDE
TABLE OF CONTENTINTRODUCTION...........................................................................................................................1TASK AWELFARE EFFECTS OF GOVERNMENT INTERVENTION.....................................1(A)................................................................................................................................................1(B)................................................................................................................................................3(C) (i)............................................................................................................................................3(C) (ii)..........................................................................................................................................5(C) (iii).........................................................................................................................................6(D)................................................................................................................................................6TASK B PRODUCTION DECISIONS...........................................................................................7A. (i).............................................................................................................................................7A. (ii)............................................................................................................................................8A. (iii)...........................................................................................................................................9(B) (i)..........................................................................................................................................10B. (ii)..........................................................................................................................................10(i)................................................................................................................................................10(ii)...............................................................................................................................................11(iii)..............................................................................................................................................11TASK C IMPACT ON THE HOMICIDE RATE.........................................................................12(A). Constructing a graph...........................................................................................................12(B) Average homicide rate for para municipalities with and without mahogany for different period.........................................................................................................................................14C. Results...................................................................................................................................14TASK D LESSONS AND REFLECTIONS.................................................................................15A.................................................................................................................................................15B. (i)...........................................................................................................................................15B. (ii) 1.......................................................................................................................................15B. (ii) 2.......................................................................................................................................15CONCLUSION..............................................................................................................................16REFERENCES..............................................................................................................................17
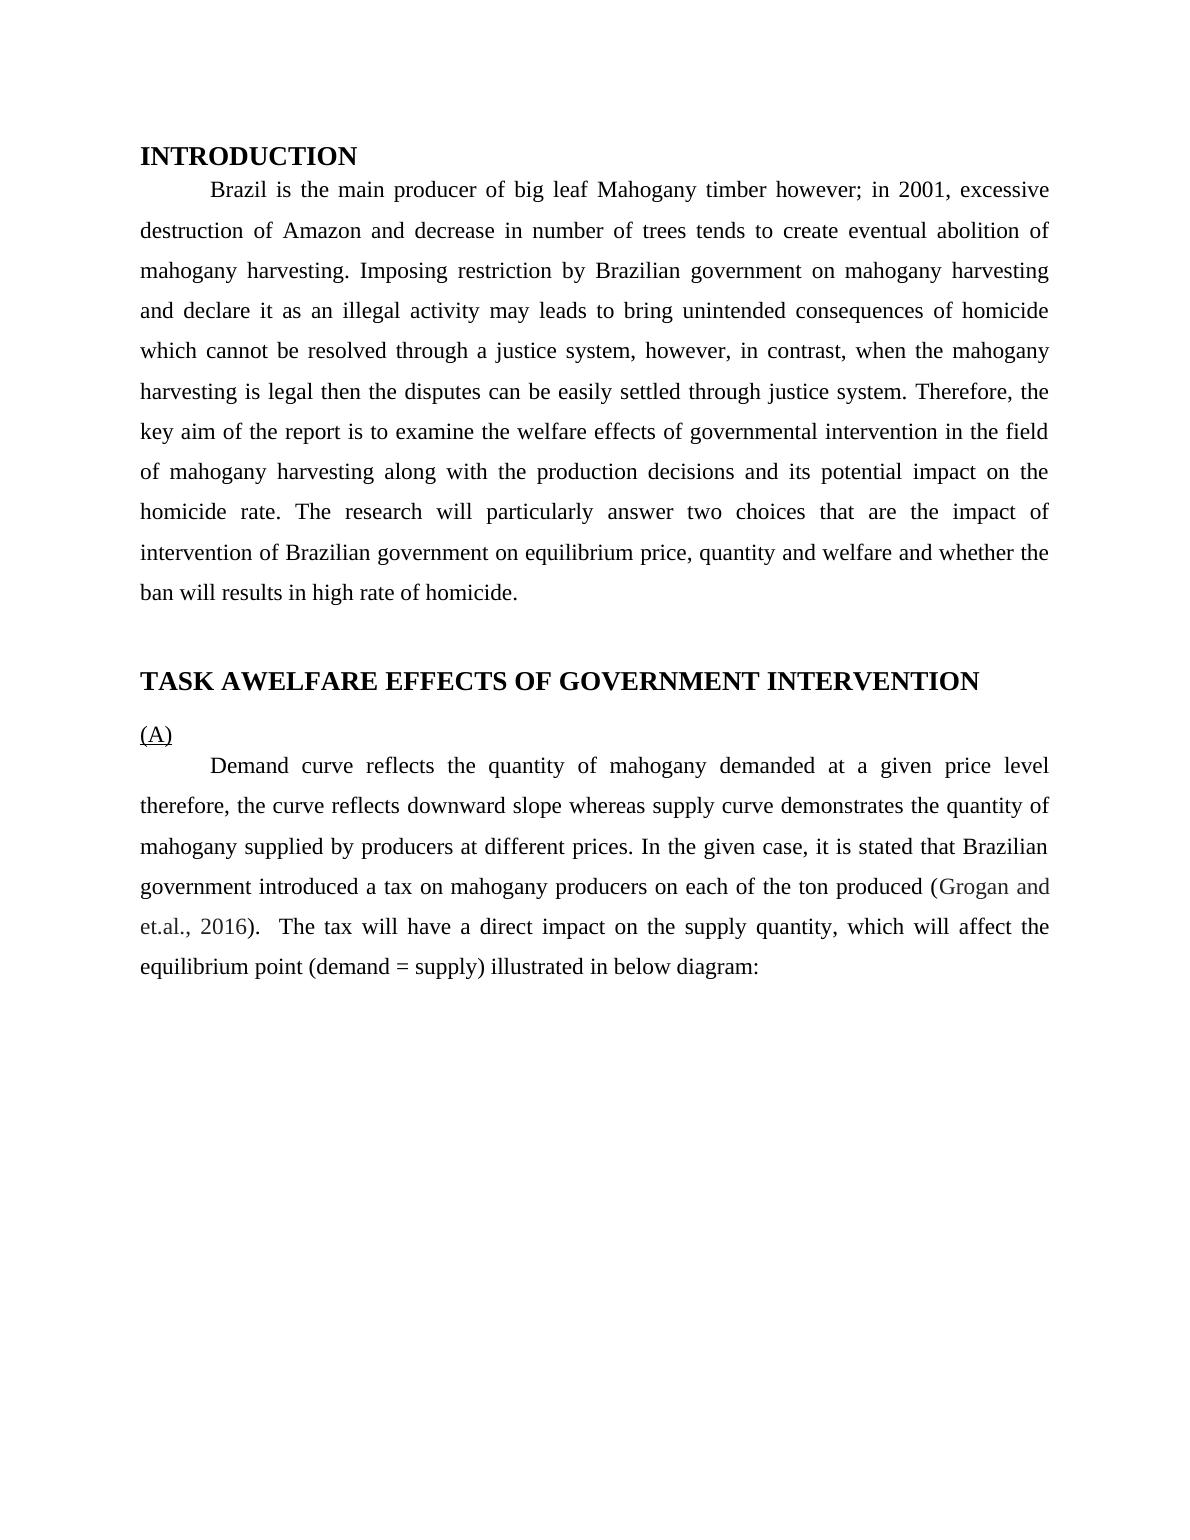
INTRODUCTION Brazil is the main producer of big leaf Mahogany timber however; in 2001, excessivedestruction of Amazon and decrease in number of trees tends to create eventual abolition ofmahogany harvesting. Imposing restriction by Brazilian government on mahogany harvestingand declare it as an illegal activity may leads to bring unintended consequences of homicidewhich cannot be resolved through a justice system, however, in contrast, when the mahoganyharvesting is legal then the disputes can be easily settled through justice system. Therefore, thekey aim of the report is to examine the welfare effects of governmental intervention in the fieldof mahogany harvesting along with the production decisions and its potential impact on thehomicide rate. The research will particularly answer two choices that are the impact ofintervention of Brazilian government on equilibrium price, quantity and welfare and whether theban will results in high rate of homicide. TASK AWELFARE EFFECTS OF GOVERNMENT INTERVENTION(A)Demand curve reflects the quantity of mahogany demanded at a given price leveltherefore, the curve reflects downward slope whereas supply curve demonstrates the quantity ofmahogany supplied by producers at different prices. In the given case, it is stated that Braziliangovernment introduced a tax on mahogany producers on each of the ton produced (Grogan andet.al., 2016). The tax will have a direct impact on the supply quantity, which will affect theequilibrium point (demand = supply) illustrated in below diagram:
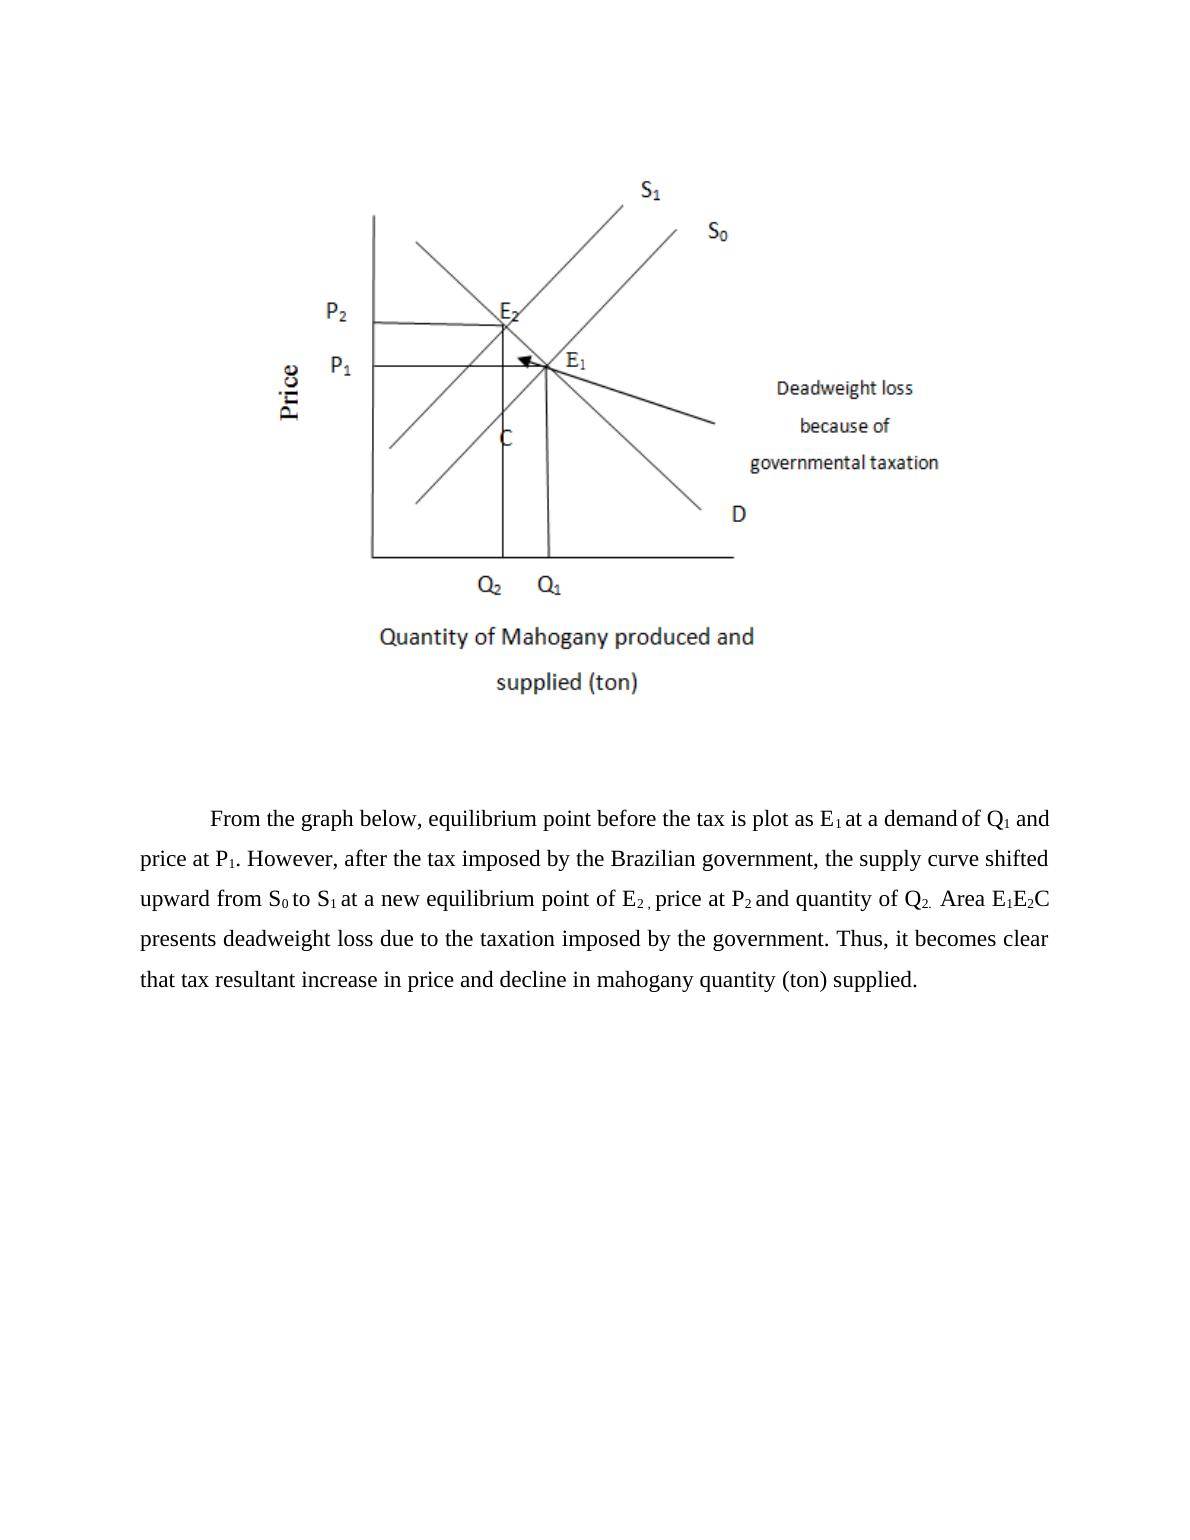
From the graph below, equilibrium point before the tax is plot as E1 at a demandof Q1 andprice at P1. However, after the tax imposed by the Brazilian government, the supply curve shiftedupward from S0 to S1 at a new equilibrium point of E2 , price at P2 and quantity of Q2. Area E1E2Cpresents deadweight loss due to the taxation imposed by the government. Thus, it becomes clearthat tax resultant increase in price and decline in mahogany quantity (ton) supplied.
End of preview
Want to access all the pages? Upload your documents or become a member.
Related Documents
Task A: Welfare Effects of Government Interventionlg...
|18
|3266
|334
Impact of Regulation on Mahogany Harvest in Brazillg...
|21
|3301
|84
Economics Assignment: Equilibrium Price and Quantitylg...
|12
|2377
|114
MAE101 Economic Principleslg...
|24
|2625
|382
Brazilian Government Impose Tax on Producers of Mahoganylg...
|10
|2196
|94
Apple Market of United Kingdomlg...
|16
|3169
|308