Differences in Risk-Taking Behavior Among School Students in Australia
VerifiedAdded on 2022/11/16
|12
|2235
|270
AI Summary
Using a cross-sectional study with participants drawn from a University in Australia, this paper seeks to examine the differences in mean aggression, thrill seeking and risk accepting between different groups for different demographical groups of the students defined in the paper.
Contribute Materials
Your contribution can guide someone’s learning journey. Share your
documents today.
Abstract
Using a cross-sectional study with participants drawn from a University in Australia, this paper
seeks to examine the differences in mean aggression, thrill seeking and risk accepting between
different groups for different demographical groups of the students defined in the paper.
Results
Following the paper’s analysis using Levene’s test on difference in variances between different
groups, the results showed that whereas there is no statistical evidence to support the difference
in mean aggression, thrill seeking and risk accepting among members of different genders, there
was evidence to support that students from different RTA status showed difference in mean
aggression, thrill seeking and risk accepting. In addition, there was difference in risk acceptance
among students from different Metropolitan statuses. Such difference was however not supported
for driver aggression, and thrill seeking for students from different Metropolitan statuses.
Conclusion
Our analysis results suggest that risk taking tends to be oriented towards nurturing rather than
nature. i.e. gender does not necessarily imply difference in risk taking but other factors such the
place where an individual grew up or RTA status have proven to support differences in risk
taking among the students. In relation to the original study, this study’s results differ on a
number of issues including difference in risk taking between men and women.
Secure Best Marks with AI Grader
Need help grading? Try our AI Grader for instant feedback on your assignments.
Introduction
Risk taking is an interesting human behavior which affect human life to a great extent
(Bener, Verjee, Dafeeah, & Yousafzai, 2013). For instance, consider the relationship between
risky sex behaviors e.g. unprotected sex which are highly correlated with serious health effects
such as contraction of Sexually Transmitted illnesses or risky road activities e.g. over speeding
and their relationship with road accidents (Byrnes, Miller, & Schafer, 2012).
In an attempt to understand the underlying psychological differences between persons of
different gender, demography, age, etcetera, several studies have been undertaken to research on
a myriad of topics just to pinpoint if there actually are any differences so as to try and draw a
connection between such differences if there are any and other day to day phenomena affecting
the persons of interest (Hodgins & Riaz, 2011). Such phenomena include: differences in risk
taking among men and women, self-esteem among persons of different economic class,
difference in depression levels among persons attributed to be more good looking and so on
(Papadopoulos, et al., 2012).
An article published by Harvard Business Review where the author seeks to examine the
risk levels between men and women; the author notes that, “…Male risk-taking tends to increase
under stress, while female risk taking tends to decrease under stress” (Sundheim, 2013). Such
generalization can be drawn from several other replicated studies which attribute women as risk
aversive compared to men (Morgan, 2007). Further, in our focus paper (the one we aim to
review) risk of a crash by a driver has been partly related to age and gender differences in risk
taking (Turner & McClure, 2003).
Original Aim
This paper seeks to conduct a critical review on the study done regarding, “Age and
gender differences in risk-taking behavior as an explanation for high incidence of motor vehicle
crashes as a driver in young males” (Turner & McClure, 2003). Our end goal is to determine if
the study stands the test of effectiveness i.e. are the research findings and conclusions true.
Study aim
To examine the differences in risk-taking behavior among school students in Australia
Materials and Methods
Study design and setting
Our focus paper adopts a cross-sectional study design which was conducted among
holders of driver’s license in the Greater Brisbane region. The research respondents were
randomly selected using simple random selection from 30 randomly selected area post codes in
the region obtained from the TRAILS database maintained by Queensland Transport. At first
1200 questionnaires were issued to the respondents by mail and two subsequent reminders to
non-respondents. Each questionnaire had approximately 38 questions divided over tree sections
i.e. 15 to measure driver aggression, 7 to measure crashes and risk-taking behavior i.e. risk
seeking, and 16 to measure risk acceptance.
Variables and instruments
Given the research questions which were aimed to measure the attitude of the drivers
towards driving and risk taking, three variables were defined which represent the scores on
driver aggression, thrill seeking, and risk acceptance. Using these measures, we can therefore
evaluate the differences between the different age groups as well as gender in an attempt to
address our research question.
Results
Descriptive
Age
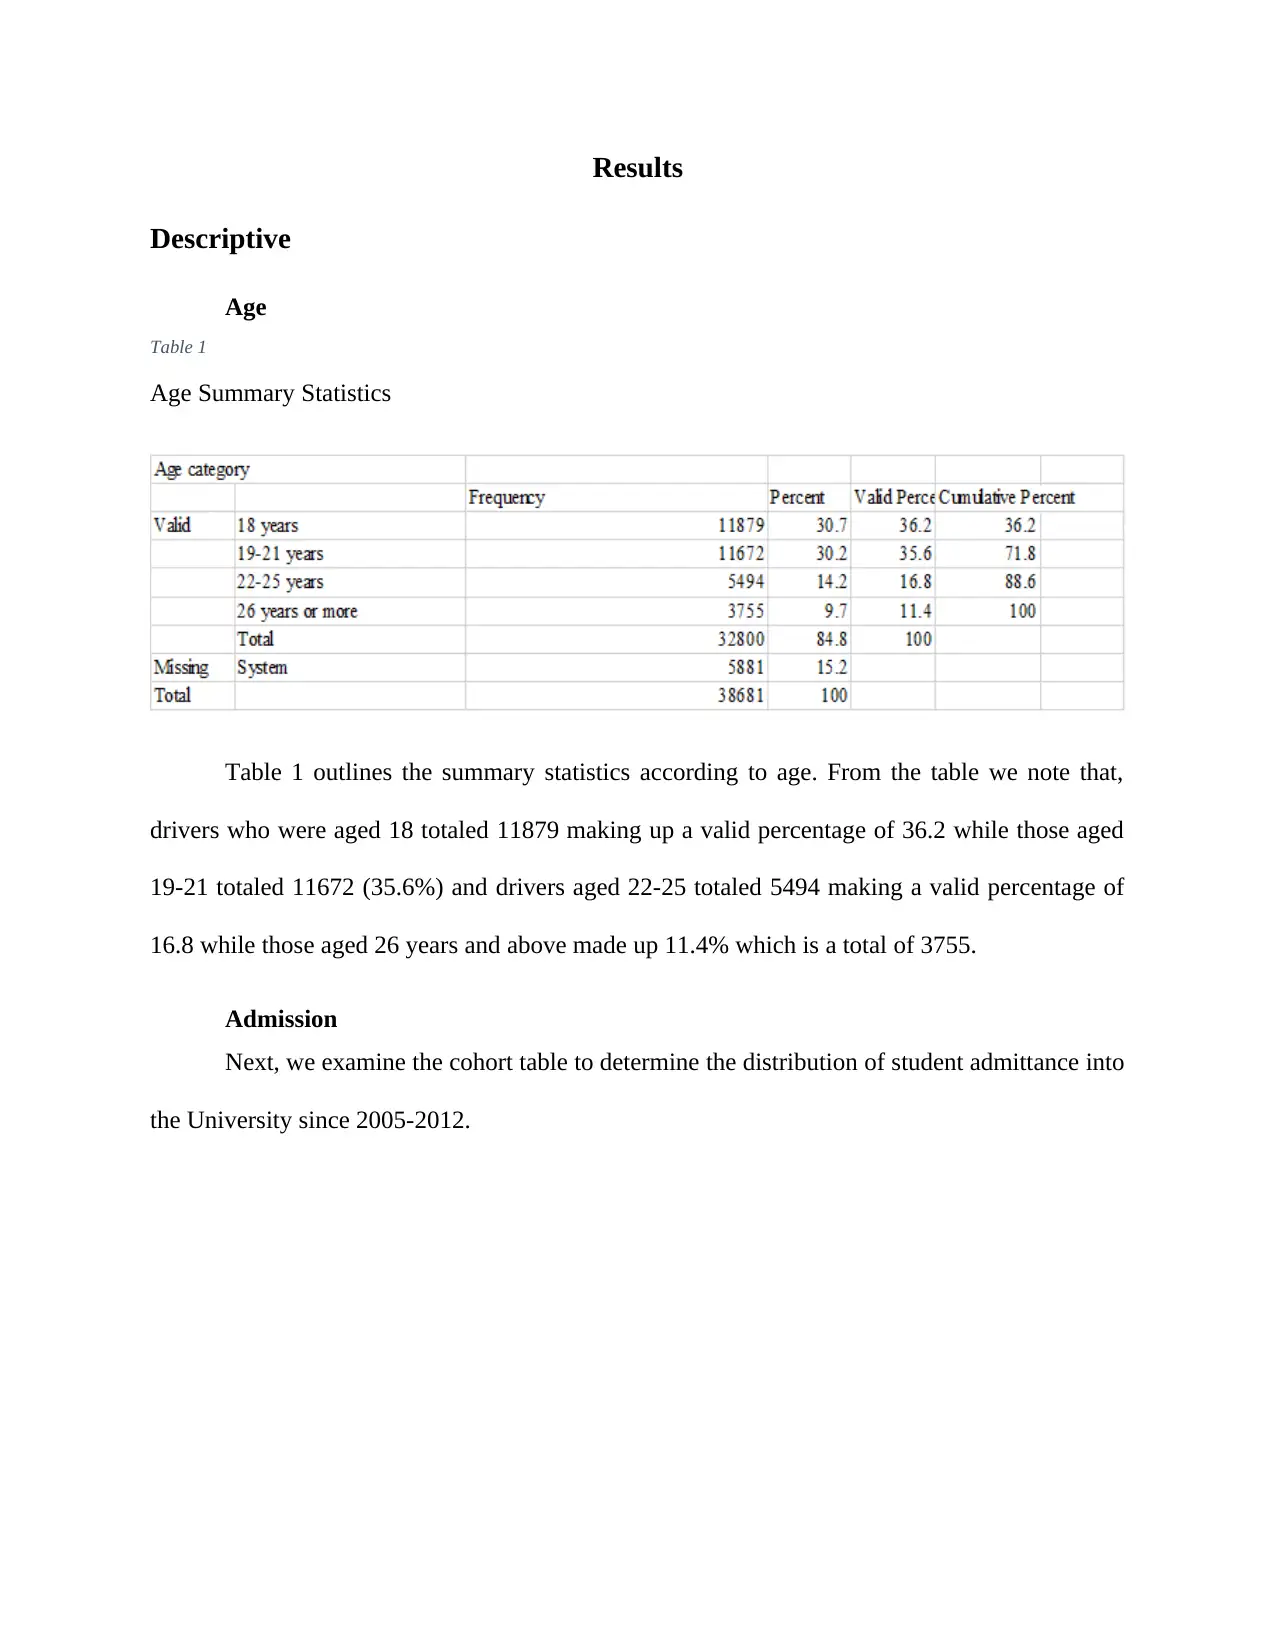
Table 1
Age Summary Statistics
Table 1 outlines the summary statistics according to age. From the table we note that,
drivers who were aged 18 totaled 11879 making up a valid percentage of 36.2 while those aged
19-21 totaled 11672 (35.6%) and drivers aged 22-25 totaled 5494 making a valid percentage of
16.8 while those aged 26 years and above made up 11.4% which is a total of 3755.
Admission
Next, we examine the cohort table to determine the distribution of student admittance into
the University since 2005-2012.
Secure Best Marks with AI Grader
Need help grading? Try our AI Grader for instant feedback on your assignments.
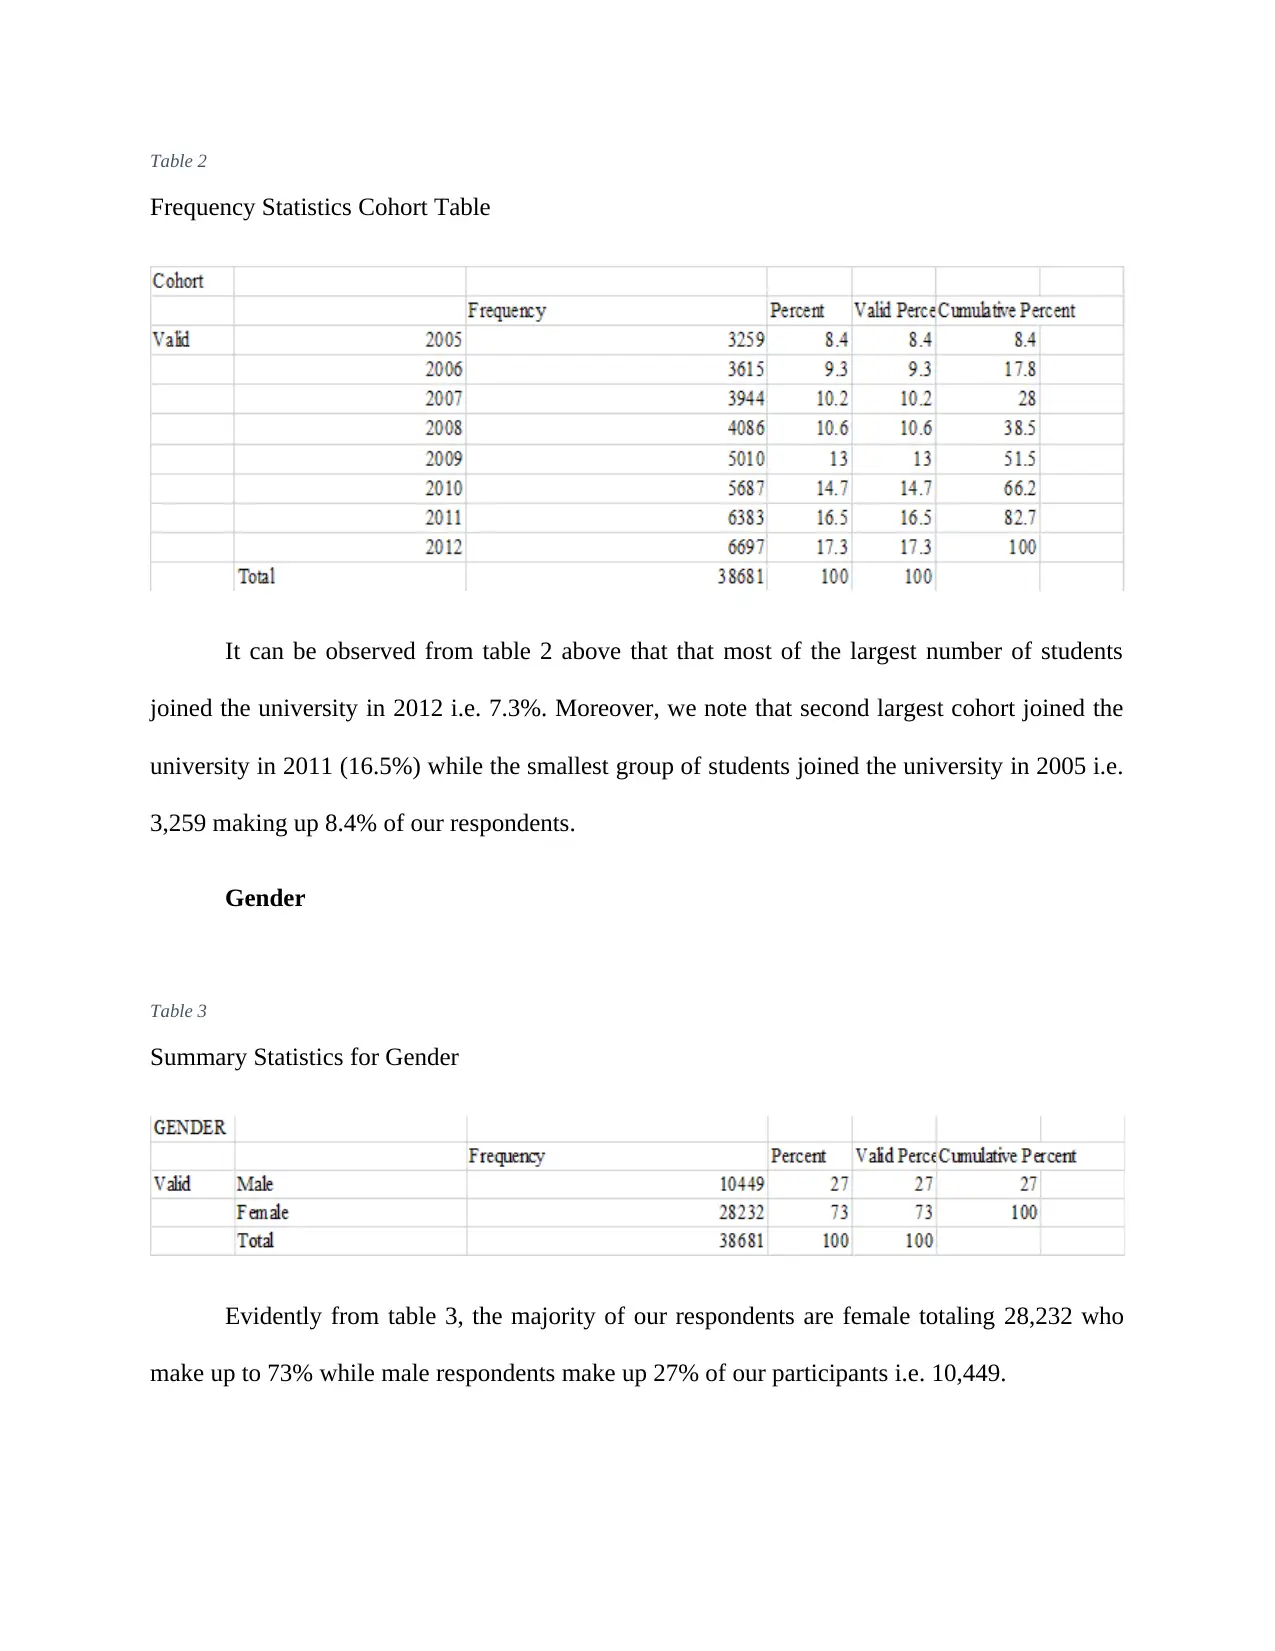
Table 2
Frequency Statistics Cohort Table
It can be observed from table 2 above that that most of the largest number of students
joined the university in 2012 i.e. 7.3%. Moreover, we note that second largest cohort joined the
university in 2011 (16.5%) while the smallest group of students joined the university in 2005 i.e.
3,259 making up 8.4% of our respondents.
Gender
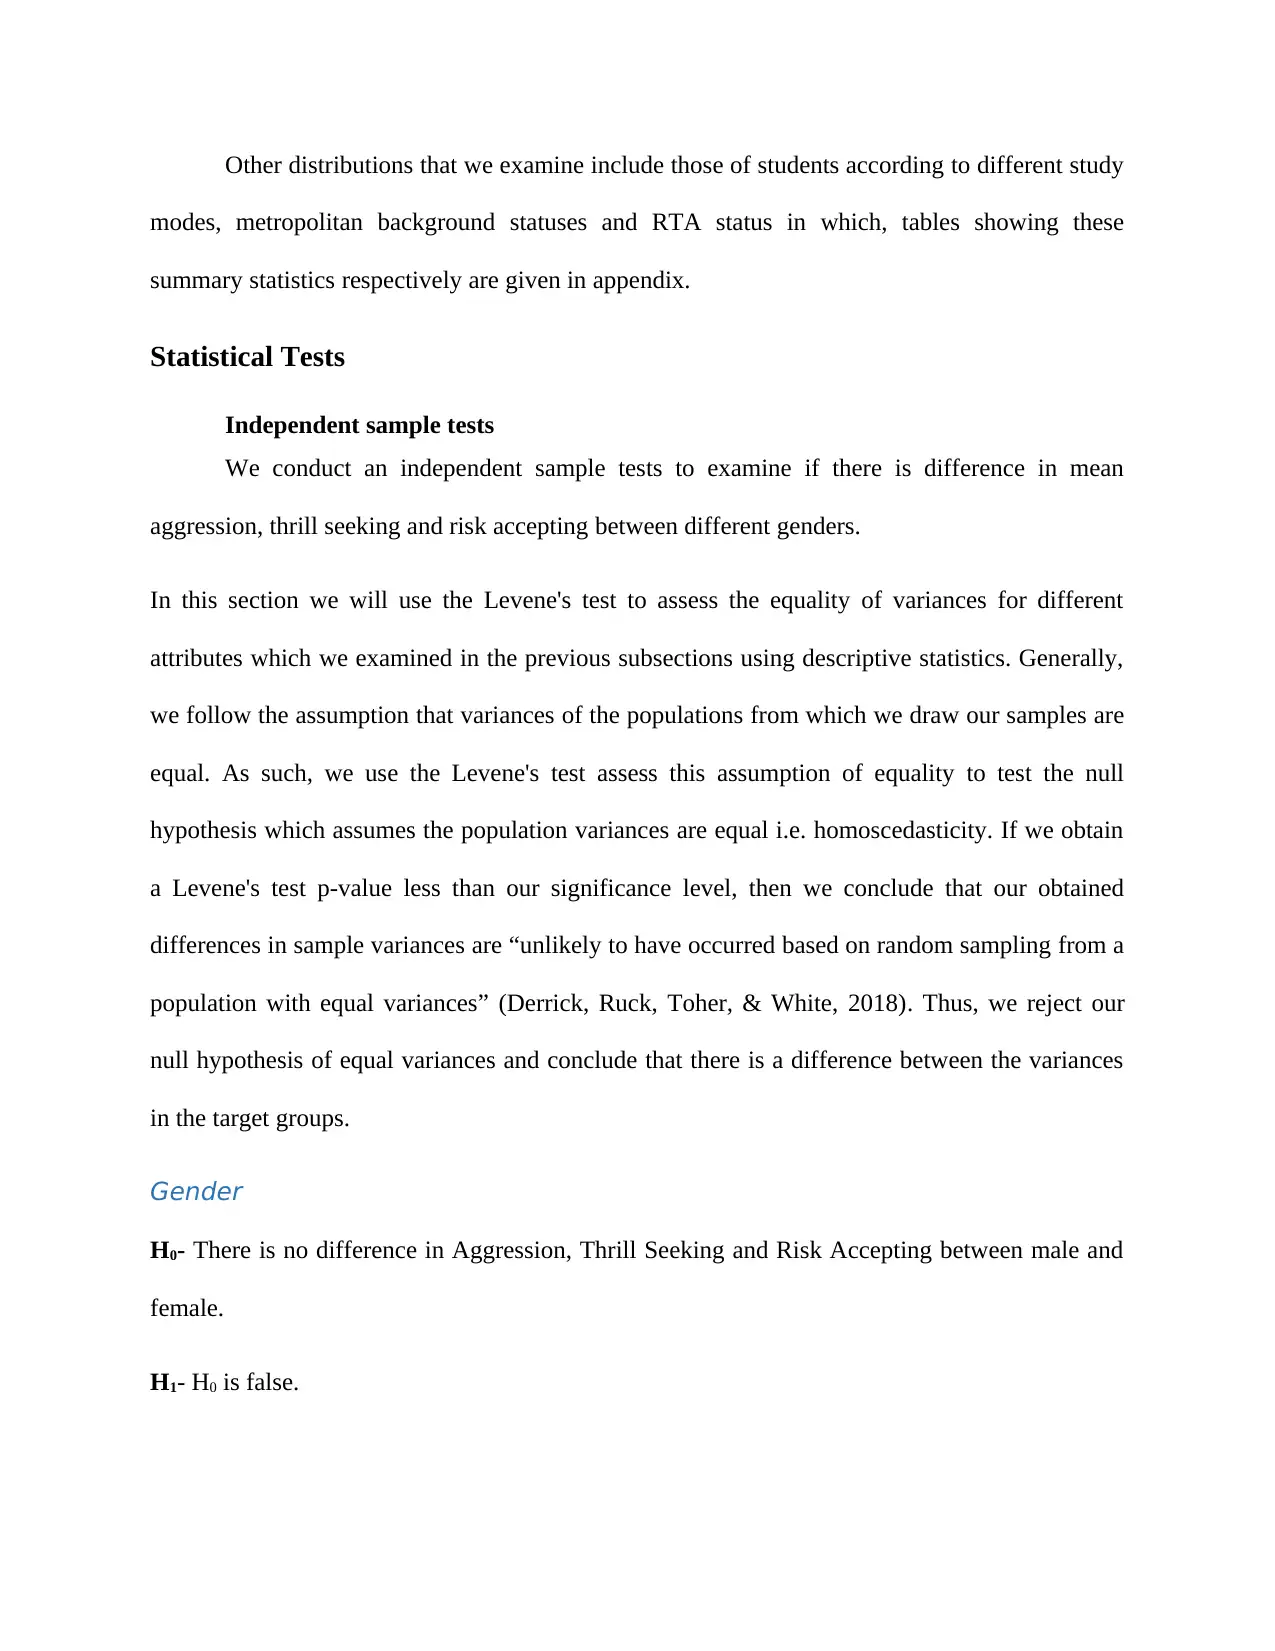
Table 3
Summary Statistics for Gender
Evidently from table 3, the majority of our respondents are female totaling 28,232 who
make up to 73% while male respondents make up 27% of our participants i.e. 10,449.
Other distributions that we examine include those of students according to different study
modes, metropolitan background statuses and RTA status in which, tables showing these
summary statistics respectively are given in appendix.
Statistical Tests
Independent sample tests
We conduct an independent sample tests to examine if there is difference in mean
aggression, thrill seeking and risk accepting between different genders.
In this section we will use the Levene's test to assess the equality of variances for different
attributes which we examined in the previous subsections using descriptive statistics. Generally,
we follow the assumption that variances of the populations from which we draw our samples are
equal. As such, we use the Levene's test assess this assumption of equality to test the null
hypothesis which assumes the population variances are equal i.e. homoscedasticity. If we obtain
a Levene's test p-value less than our significance level, then we conclude that our obtained
differences in sample variances are “unlikely to have occurred based on random sampling from a
population with equal variances” (Derrick, Ruck, Toher, & White, 2018). Thus, we reject our
null hypothesis of equal variances and conclude that there is a difference between the variances
in the target groups.
Gender
H0- There is no difference in Aggression, Thrill Seeking and Risk Accepting between male and
female.
H1- H0 is false.
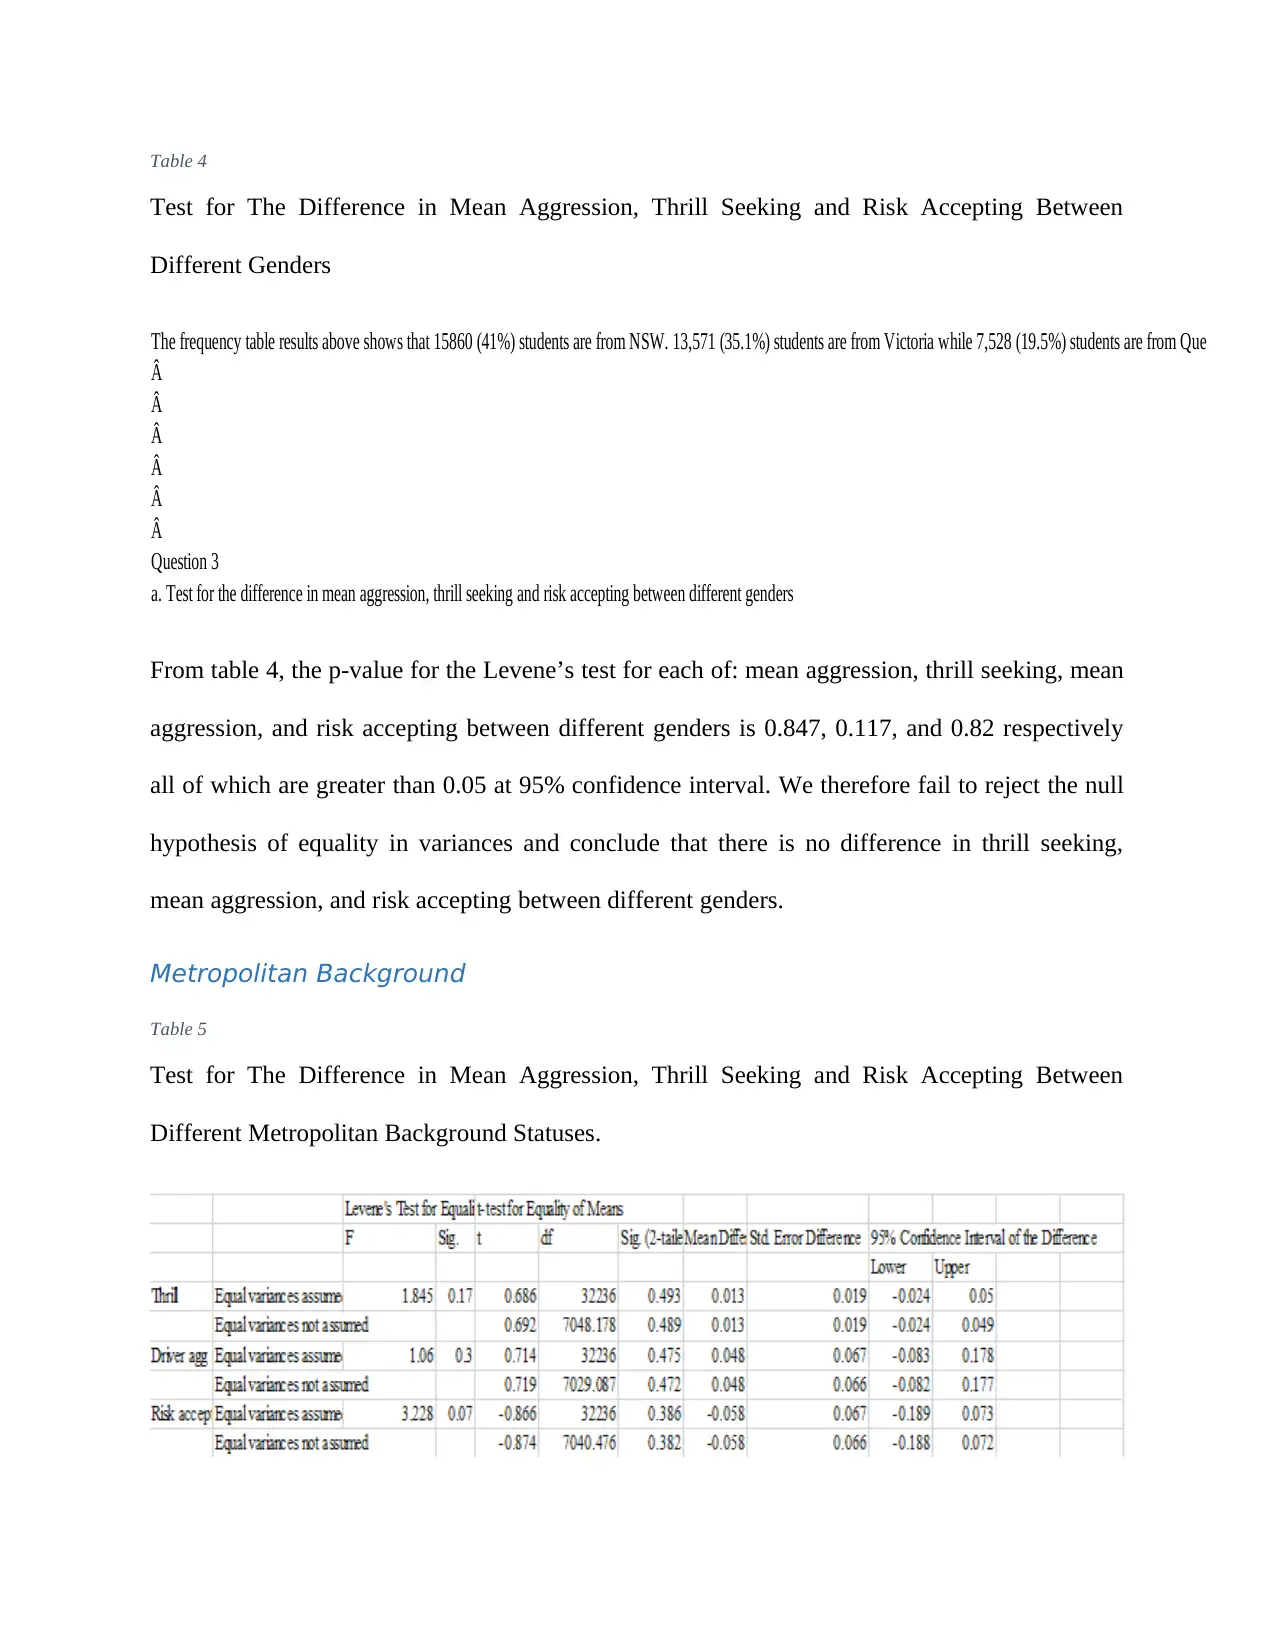
Table 4
Test for The Difference in Mean Aggression, Thrill Seeking and Risk Accepting Between
Different Genders
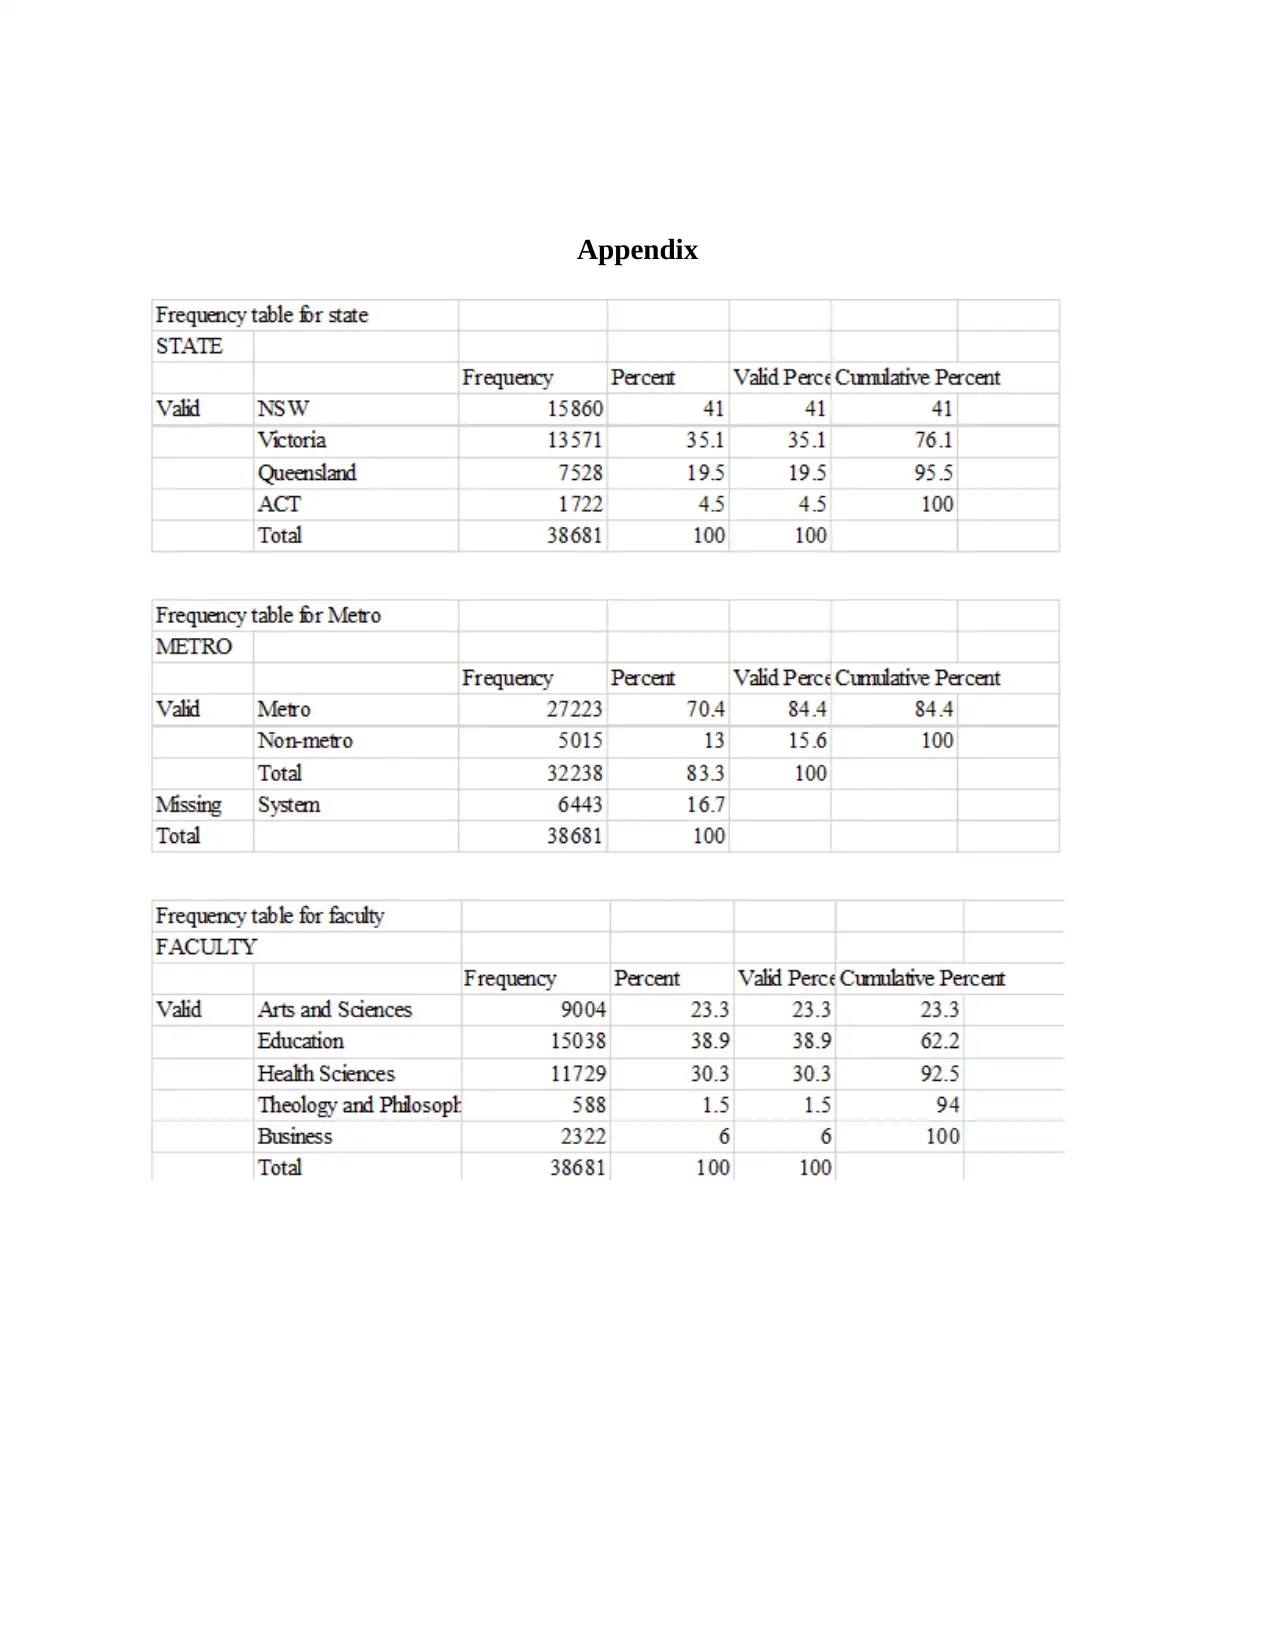
The frequency table results above shows that 15860 (41%) students are from NSW. 13,571 (35.1%) students are from Victoria while 7,528 (19.5%) students are from Queensland. 17
Question 3
a. Test for the difference in mean aggression, thrill seeking and risk accepting between different genders
Â
Â
Â
Â
Â
Â
From table 4, the p-value for the Levene’s test for each of: mean aggression, thrill seeking, mean
aggression, and risk accepting between different genders is 0.847, 0.117, and 0.82 respectively
all of which are greater than 0.05 at 95% confidence interval. We therefore fail to reject the null
hypothesis of equality in variances and conclude that there is no difference in thrill seeking,
mean aggression, and risk accepting between different genders.
Metropolitan Background
Table 5
Test for The Difference in Mean Aggression, Thrill Seeking and Risk Accepting Between
Different Metropolitan Background Statuses.
Test for The Difference in Mean Aggression, Thrill Seeking and Risk Accepting Between
Different Genders
The frequency table results above shows that 15860 (41%) students are from NSW. 13,571 (35.1%) students are from Victoria while 7,528 (19.5%) students are from Queensland. 17
Question 3
a. Test for the difference in mean aggression, thrill seeking and risk accepting between different genders
Â
Â
Â
Â
Â
Â
From table 4, the p-value for the Levene’s test for each of: mean aggression, thrill seeking, mean
aggression, and risk accepting between different genders is 0.847, 0.117, and 0.82 respectively
all of which are greater than 0.05 at 95% confidence interval. We therefore fail to reject the null
hypothesis of equality in variances and conclude that there is no difference in thrill seeking,
mean aggression, and risk accepting between different genders.
Metropolitan Background
Table 5
Test for The Difference in Mean Aggression, Thrill Seeking and Risk Accepting Between
Different Metropolitan Background Statuses.
Paraphrase This Document
Need a fresh take? Get an instant paraphrase of this document with our AI Paraphraser
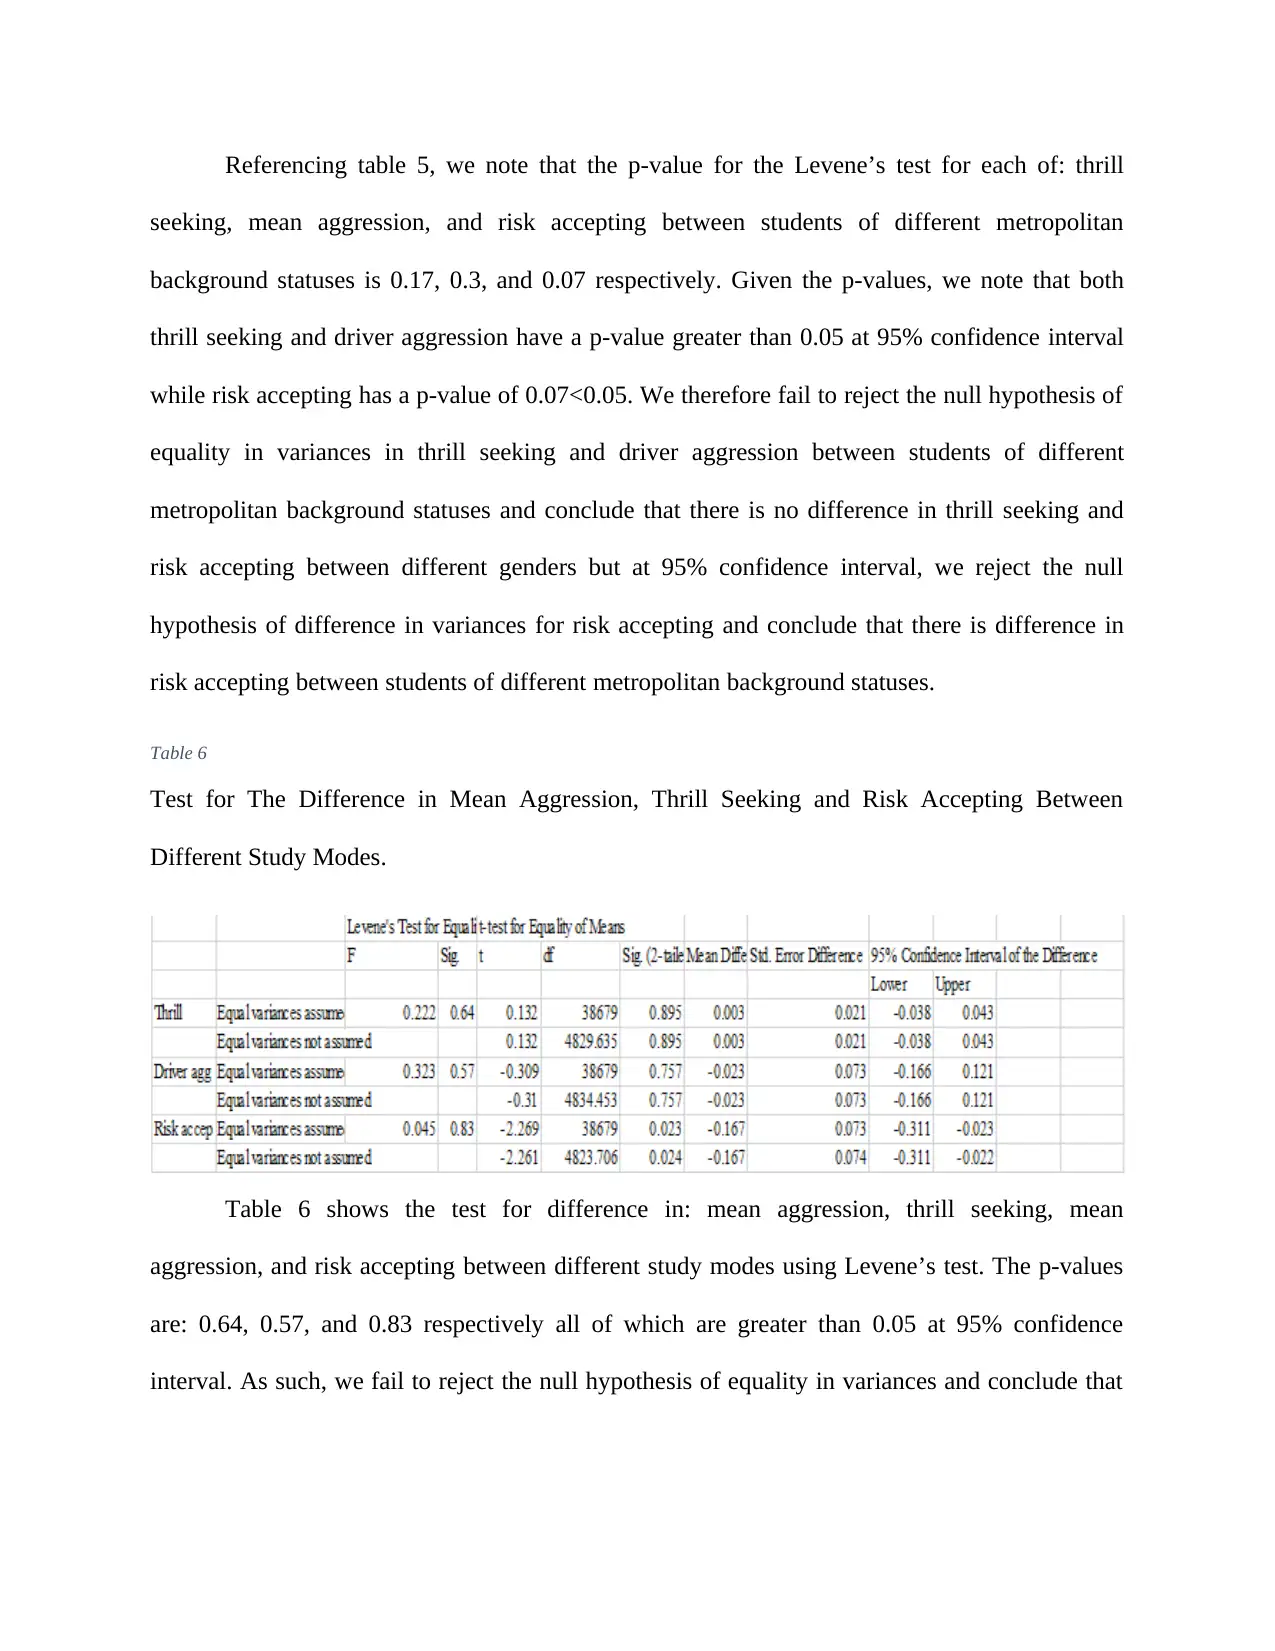
Referencing table 5, we note that the p-value for the Levene’s test for each of: thrill
seeking, mean aggression, and risk accepting between students of different metropolitan
background statuses is 0.17, 0.3, and 0.07 respectively. Given the p-values, we note that both
thrill seeking and driver aggression have a p-value greater than 0.05 at 95% confidence interval
while risk accepting has a p-value of 0.07<0.05. We therefore fail to reject the null hypothesis of
equality in variances in thrill seeking and driver aggression between students of different
metropolitan background statuses and conclude that there is no difference in thrill seeking and
risk accepting between different genders but at 95% confidence interval, we reject the null
hypothesis of difference in variances for risk accepting and conclude that there is difference in
risk accepting between students of different metropolitan background statuses.
Table 6
Test for The Difference in Mean Aggression, Thrill Seeking and Risk Accepting Between
Different Study Modes.
Table 6 shows the test for difference in: mean aggression, thrill seeking, mean
aggression, and risk accepting between different study modes using Levene’s test. The p-values
are: 0.64, 0.57, and 0.83 respectively all of which are greater than 0.05 at 95% confidence
interval. As such, we fail to reject the null hypothesis of equality in variances and conclude that
there is no difference in thrill seeking, mean aggression, and risk accepting between different
study modes.
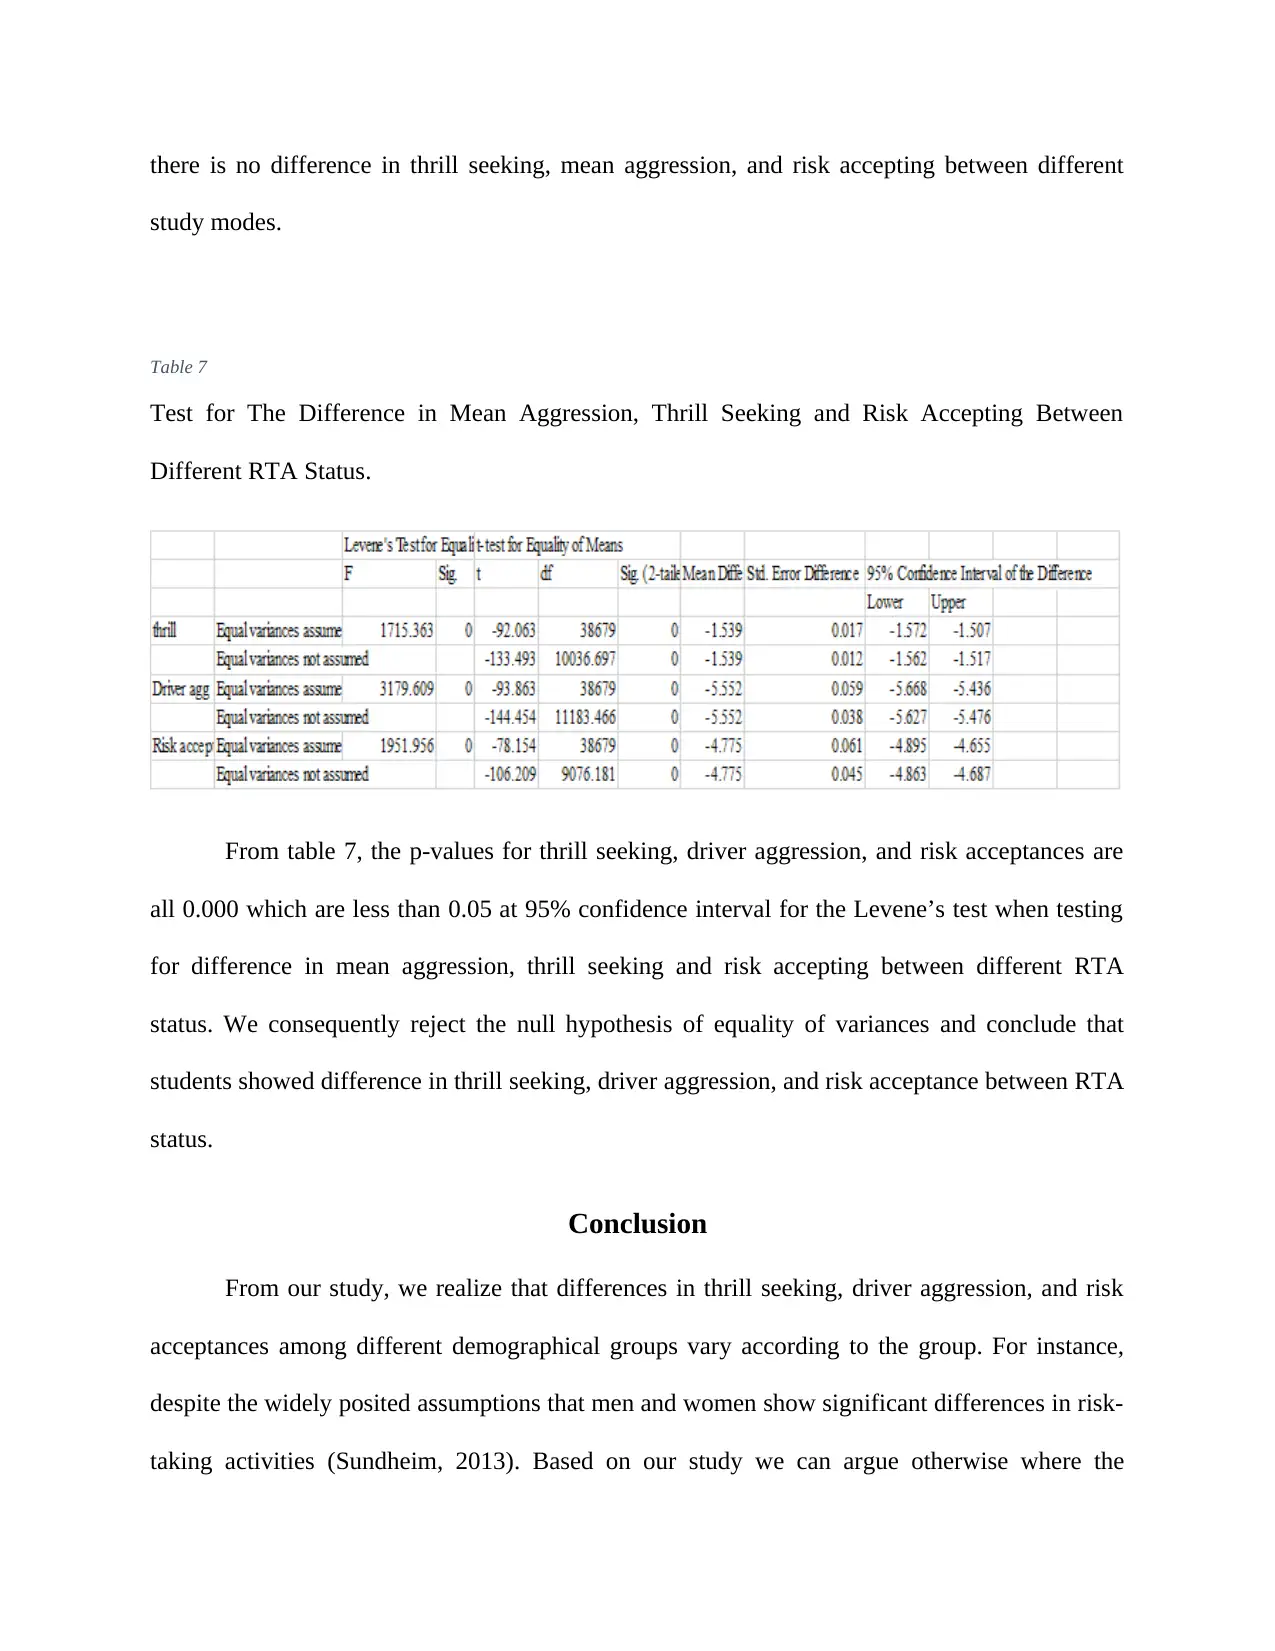
Table 7
Test for The Difference in Mean Aggression, Thrill Seeking and Risk Accepting Between
Different RTA Status.
From table 7, the p-values for thrill seeking, driver aggression, and risk acceptances are
all 0.000 which are less than 0.05 at 95% confidence interval for the Levene’s test when testing
for difference in mean aggression, thrill seeking and risk accepting between different RTA
status. We consequently reject the null hypothesis of equality of variances and conclude that
students showed difference in thrill seeking, driver aggression, and risk acceptance between RTA
status.
Conclusion
From our study, we realize that differences in thrill seeking, driver aggression, and risk
acceptances among different demographical groups vary according to the group. For instance,
despite the widely posited assumptions that men and women show significant differences in risk-
taking activities (Sundheim, 2013). Based on our study we can argue otherwise where the

difference in thrill seeking, driver aggression, and risk acceptances occur among other factors
such as RTA status as show in the preceding section. In conclusion, risk taking among students
take different twists which might be influenced with where an individual was brought up for
instance given that we saw difference in risk acceptance among student from different
metropolitan background statuses.
Secure Best Marks with AI Grader
Need help grading? Try our AI Grader for instant feedback on your assignments.
References
Bener, A., Verjee, M. A., Dafeeah, E., & Yousafzai, M. T. (2013). Gender and age differences in
risk taking behaviour in road traffic crashes. Advances in Transportation Studies , 53-57.
Byrnes, J. P., Miller, D. C., & Schafer, W. D. (2012). Gender Differences in Risk Taking: A
Meta-Analysis. Psychological Bulletin, 125(312), 367-383.
Derrick, B., Ruck, A., Toher, D., & White. (2018). Tests for equality of variances between two
samples which contain both paired observations and independent observations. Journal
of Applied Quantitative Methods, 12(2), 36-47.
Hodgins, S., & Riaz, M. (2011). Violence and phases of illness: Differential risk and predictors.
European Psychiatry, 26, 518–524.
Morgan, J. (2007, January 29). Risk Assessment and Risk Management in Psychiatric Practice.
Giving up the culture of blame, pp. 56-69.
Papadopoulos, C., Ross, J., Stewart, D., Dack, C., James, K., & Bowers, J. (2012). The
antecedents of violence and aggression within psychiatric in-patient settings. Acta
Psychiatrica Scandinavica, 125(7), 425-439.
Sundheim, D. (2013, February 27). Do Women Take as Many Risks as Men? Retrieved from
Harvard Business Review: https://hbr.org/2013/02/do-women-take-as-many-risks-as
Turner, C., & McClure, R. (2003). Age and gender differences in risk-taking behavior as an
explanation for high incidence of motor vehicle crashes as a driver in young males.
Injury Control and Safety Promotion, 10(3), 123-130. doi:10.1076/icsp.10.3.123.14560
Appendix
1 out of 12
Related Documents
Your All-in-One AI-Powered Toolkit for Academic Success.
+13062052269
info@desklib.com
Available 24*7 on WhatsApp / Email
![[object Object]](/_next/static/media/star-bottom.7253800d.svg)
Unlock your academic potential
© 2024 | Zucol Services PVT LTD | All rights reserved.


