Financial Analysis on Nestle (Malaysia) Berhad Group Assignment Report
VerifiedAdded on 2020/10/16
|30
|4984
|270
Report
AI Summary
This report presents a financial analysis of Nestle (Malaysia) Berhad, examining its performance from 2016 to 2018. It delves into key financial areas, including profitability (ROE, ROA, net profit margin), efficiency (asset turnover, inventory turnover), liquidity (current ratio, cash flow ratio), and gearing ratios. The analysis reveals Nestle's strengths in converting sales into profits but also highlights potential financial distress. The report also provides an industry overview and discusses non-financial aspects like nutrition and environmental responsibilities. Recommendations are provided to improve the company's financial status, assisting stakeholders in their investment decision-making. Cash flow analysis and other relevant information are also included.
ACC 10007
Financial Information for
Decision Making
A Financial Analysis on Nestle (Malaysia) Berhad
Group Assignment (Report)
Group Name: MILO
Group Memebers:
1. Chio Kay Jean 101216578
2. Grace Lee Ying Ying 101213922
3. Kiing Kiu Yong 101216604
4. Oh Xiu Feng 101214666
5. Sarah Binti Supahan 101214284
Tutorial Group: 09, Thursday 0930-1030
Tutor: Dr. Yii Kwang Jing
Paraphrase This Document
Need a fresh take? Get an instant paraphrase of this document with our AI Paraphraser
Executive summary
The purpose of this report is to analyse the financial position of Nestle (Malaysia) Berhad which
determines whether Nestle is currently at a favourable financial position in the market and to the
company itself. Not only that, a company overview has been done and in short, the company’s
history dates back to the 19th century up until today and was the result of a merge between two
food and beverage companies. With that said, an industry overview was conducted and it was
found that the food and beverage industry is one of the fastest growing industries globally, with
US taking the lead as main importer back in 2017. For the analysis, four areas were analysed;
profitability, efficiency, liquidity and gearing. These are vital in determining the financial state of
Nestle. For profitability, Nestle (Malaysia) Berhad had been proven to be efficient in converting
its sale into profits. The efficiency however showed that the company may be facing a financial
distress. Nestle (Malaysia) Berhad has indicated that it has not been liquid and are possibly
unlikely to meet its current obligations. Moreover, the company operates at a normal or optimal
financial level even though there is an increase in gearing ratios. The cash flow however, the
company made a repayment of borrowings, causing a massive cash outflow in financing
activities. This report also covers other relevant information about the company in a non-
financial aspect such as nutrition, water and environment and the people. Recommendations have
also been given on how to improve the company’s financial status.
i
Table of Contents
Executive summary....................................................................................................................................i
1.0 Introduction and Purpose of Analysis................................................................................................1
2.0 Company and Industry Background..................................................................................................1
2.1 Company..........................................................................................................................................1
2.2 Industry............................................................................................................................................2
3.0 Analysis of Financial Report Data......................................................................................................3
3.1 Profitability......................................................................................................................................3
3.2 Efficiency..........................................................................................................................................5
3.3 Liquidity...........................................................................................................................................7
3.4 Gearing.............................................................................................................................................9
4.0 Cash flow analysis over the 3 years..................................................................................................11
5.0 Assessment of Other Relevant Information.....................................................................................13
5.1 Nutrition.........................................................................................................................................13
5.2 Water and Environment...............................................................................................................14
5.3 Our People......................................................................................................................................15
6.0 Conclusion..........................................................................................................................................16
Appendices.................................................................................................................................................1
Appendix A: Profitability......................................................................................................................1
Appendix B: Efficiency.........................................................................................................................3
Appendix C: Liquidity..........................................................................................................................6
Appendix D: Gearing............................................................................................................................7
Bibliography..............................................................................................................................................8
List of Figures
Figure 1: ROE and ROA of Nestle (Malaysia) Berhad from 2016 to 2018.................................................3
Figure 2: Net Profit Margin of Nestle (Malaysia) Berhad from 2016 to 2018.............................................4
Figure 3: Asset Turnover Ratio of Nestle (Malaysia) Berhad from 2016 to 2018.......................................5
Figure 4: Remaining Efficiency Ratios of Nestle (Malaysia) Berhad from 2016 to 2018............................6
Figure 5: Liquidity Chart of Nestle (Malaysia) Berhad from 2016 to 2018.................................................7
Figure 6: Gearing Ratio of Nestle (Malaysia) Berhad from 2016 to 2018...................................................9
⊘ This is a preview!⊘
Do you want full access?
Subscribe today to unlock all pages.
Trusted by 1+ million students worldwide
List of Tables
Table 1: Profitability Ratios of Nestle (Malaysia) Berhad from 2016 to 2018.............................................3
Table 2: Efficiency Ratios of Nestle (Malaysia) Berhad from 2016 to 2018...............................................5
Table 3: Liquidity Ratios of Nestle (Malaysia) Berhad from 2016 to 2018.................................................7
Table 4: Gearing Ratio of Nestle (Malaysia) Berhad from 2016 to 2018....................................................9
Table 5: Net Cash Flows of Nestle (Malaysia) Berhad from 2016 to 2018...............................................11
Paraphrase This Document
Need a fresh take? Get an instant paraphrase of this document with our AI Paraphraser
1.0 Introduction and Purpose of Analysis
The team has been assigned to develop a report regarding the financial and non-financial
performance of Nestle (Malaysia) Berhad for both internal and external stakeholders who might
be interested in investing in the company. The purpose of this report is to prepare an analysis on
the company’s performance within a 3-year span, particularly from 2016 to 2018. To start off,
the financial aspects of the report will be based on several factors which are the profitability,
efficiency, liquidity and lastly gearing. Additionally, an analysis of Nestle (Malaysia) Berhad
Group’s non-financial aspects which are the environmental and social responsibilities have been
conducted. Furthermore, some considerations on potential outlook are made based the
company’s current financial situation and provides recommendations to improve it. The content
of this report is to assist stakeholders in their investment decision making.
2.0 Company and Industry Background
2.1 Company
Nestle is a multinational food beverage company based in Vevey, Switzerland has been
operating since 1905 after the merging of the Anglo-Swiss Milk company which was founded in
1886 by brothers George and Charles Page, and the famously known Farine Lactée Henri
Nestlé’s founder, Henri Nestle which was founded 20 years prior to Anglo-Swiss. Nestle first
started their operations back in 1912 in Penang, after the expansion of operations, it moved its
headquarters to Kuala Lumpur in 1935 (Star Media Group Berhad 2016).
According to McGrath (2018), Nestle was ranked the world’s second largest food and beverage
company. The company operations include producing around 200 brands, and their main
products are the categories of tea, coffee, bottled water, baby food, milk products, cereals,
confectionery goods and many more.
1
2.2 Industry
The industry allocated for this report is the Food and Beverage Industry which is one of the
fastest-growing industries globally. It is an industry whereby it produces edible goods and
beverages through way of agriculture or processing (GlobalEdge 2019). In 2017, the USA was
leading in food and beverage exports and imports alike. Although the imports of the country
outweighed the exports, incurring a trade deficit. Additionally, the statistics such as user
penetration, revenue and many more are increasing every year. For example, the expected
revenue growth for the industry in 2019 is expected to grow by 22% in contrast to 2018 (Statista
2019).
However, there are many strong competitors who offer similar goods like Nestle products to the
market. One of the top Nestle rivals, Mondelez which produces various products like chocolate,
beverages, cookies, and confectionary (Bhasin 2018). Due to their great market dominance by
providing products that suit to particular place of customers plus the goods sold are mostly
similar to Nestle company, Mondelez is considered to be a strong competitor to Nestle. In
addition, other companies like Mars, Kraft, Lindt, Hershey’s, Kellogg and Unilever also compete
aggressively in the food and beverage industry.
2
⊘ This is a preview!⊘
Do you want full access?
Subscribe today to unlock all pages.
Trusted by 1+ million students worldwide
3.0 Analysis of Financial Report Data
3.1 Profitability
2018 2017 2016
Return on equity (ROE) 102.13% 100.15% 94%
Return on assets (ROA) 32.1% 31.8% 30.8%
Net profit margin 16% 15.44% 15.14%
Table 1: Profitability Ratios of Nestle (Malaysia) Berhad from 2016 to 2018
Figure 1: ROE and ROA of Nestle (Malaysia) Berhad from 2016 to 2018
Return on equity (ROE) measures how well a company create profits from its shareholders
investments in the company. Based on the figure above, ROE of Nestle (Malaysia) Berhad in
FY2016 was 94% and increase to 100.15% in FY2017 while slightly increase in FY2018 which
was 102.15%. Generally, the ROE of Nestle was increasing steadily in these three years. It is
believed that the return on equity is outstanding due to the percentage Nestle’s return on equity
from both FY2017 and FY2018 are higher than 100%. Additionally, a slight increase of ROE
may show that the company is gaining profits from its shareholders investments in the company.
3
Paraphrase This Document
Need a fresh take? Get an instant paraphrase of this document with our AI Paraphraser
On the other hand, return on assets (ROA) indicates how efficient the company utilizes its
available assets to generate an income. Refer to Figure 1, ROA of Nestle increased from 30.8%
to 31.8% from FY2016 to FY2017. ROA slightly increased from FY2017 to FY2018 which was
32.1%. From this, Nestle had utilised its assets efficiently to generate earnings as the ROA is
stably increasing over the years as shown in Figure 1 from FY2016 to FY2018. Overall, Nestle
had efficiently and effectively used its assets and this helps generate a steady profit for the
company.
Figure 2: Net Profit Margin of Nestle (Malaysia) Berhad from 2016 to 2018
Next, the net profit margin measures the percentage of profit a company earned from its total
revenue. As shown in Figure 2, the net profit margin in FY2016 was 15.14% and slightly
increased to 15.44% in FY2017. A continue increase until 16% in FY2018. This shows that the
net profit margin of Nestle had steadily increased over these three years. Ultimately, the
performance of Nestle was efficient at converting its sales into profits as the higher the ratios, the
more efficient a company generates profits.
4
3.2 Efficiency
2018 2017 2016
Asset turnover 2.02 times 2.06 times 3.69 times
Inventory turnover 53.8 days 50.9 days 51.8 days
Debtors turnover 40.7 days 40.7 days 42.4 days
Creditors turnover 149.6 days 147.8 days 154.1 days
Table 2: Efficiency Ratios of Nestle (Malaysia) Berhad from 2016 to 2018
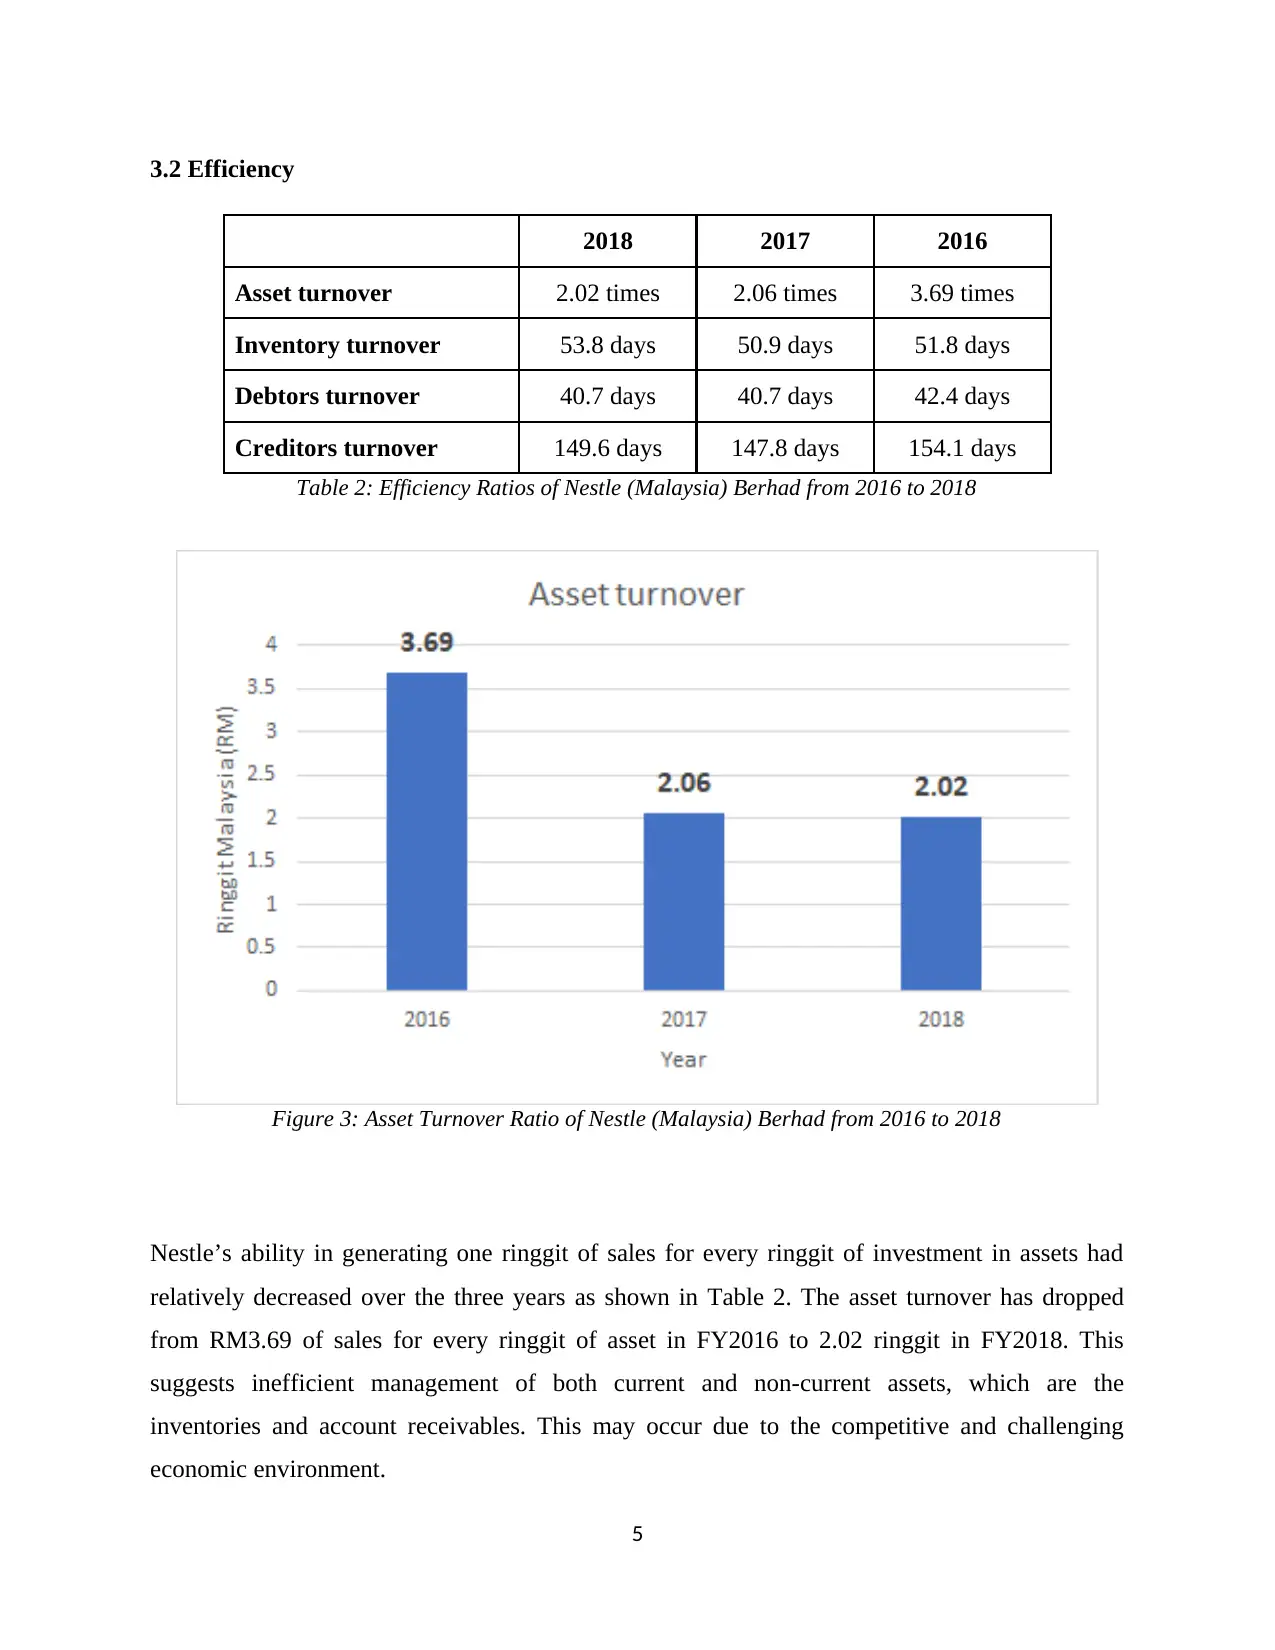
Figure 3: Asset Turnover Ratio of Nestle (Malaysia) Berhad from 2016 to 2018
Nestle’s ability in generating one ringgit of sales for every ringgit of investment in assets had
relatively decreased over the three years as shown in Table 2. The asset turnover has dropped
from RM3.69 of sales for every ringgit of asset in FY2016 to 2.02 ringgit in FY2018. This
suggests inefficient management of both current and non-current assets, which are the
inventories and account receivables. This may occur due to the competitive and challenging
economic environment.
5
2018 2017 2016
Asset turnover 2.02 times 2.06 times 3.69 times
Inventory turnover 53.8 days 50.9 days 51.8 days
Debtors turnover 40.7 days 40.7 days 42.4 days
Creditors turnover 149.6 days 147.8 days 154.1 days
Table 2: Efficiency Ratios of Nestle (Malaysia) Berhad from 2016 to 2018
Figure 3: Asset Turnover Ratio of Nestle (Malaysia) Berhad from 2016 to 2018
Nestle’s ability in generating one ringgit of sales for every ringgit of investment in assets had
relatively decreased over the three years as shown in Table 2. The asset turnover has dropped
from RM3.69 of sales for every ringgit of asset in FY2016 to 2.02 ringgit in FY2018. This
suggests inefficient management of both current and non-current assets, which are the
inventories and account receivables. This may occur due to the competitive and challenging
economic environment.
5
⊘ This is a preview!⊘
Do you want full access?
Subscribe today to unlock all pages.
Trusted by 1+ million students worldwide
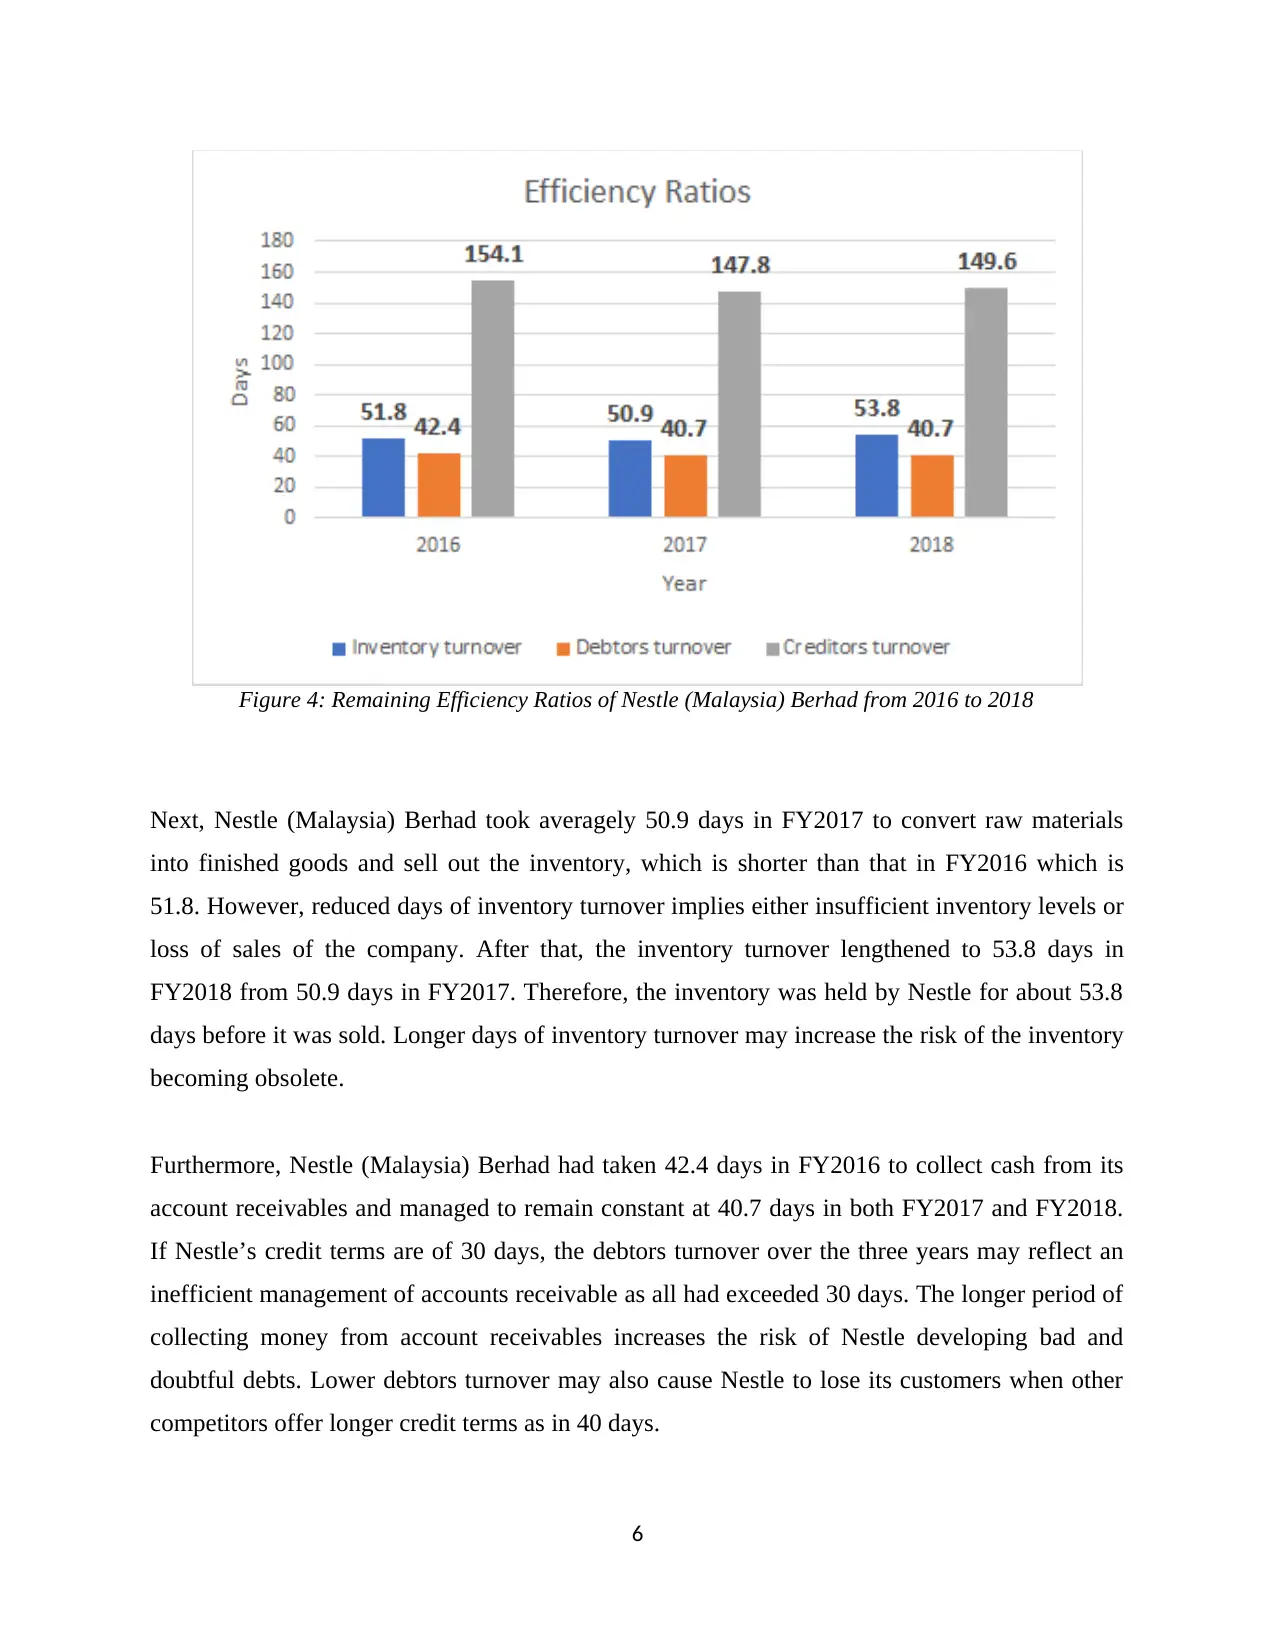
Figure 4: Remaining Efficiency Ratios of Nestle (Malaysia) Berhad from 2016 to 2018
Next, Nestle (Malaysia) Berhad took averagely 50.9 days in FY2017 to convert raw materials
into finished goods and sell out the inventory, which is shorter than that in FY2016 which is
51.8. However, reduced days of inventory turnover implies either insufficient inventory levels or
loss of sales of the company. After that, the inventory turnover lengthened to 53.8 days in
FY2018 from 50.9 days in FY2017. Therefore, the inventory was held by Nestle for about 53.8
days before it was sold. Longer days of inventory turnover may increase the risk of the inventory
becoming obsolete.
Furthermore, Nestle (Malaysia) Berhad had taken 42.4 days in FY2016 to collect cash from its
account receivables and managed to remain constant at 40.7 days in both FY2017 and FY2018.
If Nestle’s credit terms are of 30 days, the debtors turnover over the three years may reflect an
inefficient management of accounts receivable as all had exceeded 30 days. The longer period of
collecting money from account receivables increases the risk of Nestle developing bad and
doubtful debts. Lower debtors turnover may also cause Nestle to lose its customers when other
competitors offer longer credit terms as in 40 days.
6
Paraphrase This Document
Need a fresh take? Get an instant paraphrase of this document with our AI Paraphraser
Lastly, the creditors turnover of Nestle has shortened from an average of 154.1 days in FY2016
to 147.8 days in FY2017. It can be deduced that Nestle had gained satisfactory liquidity position
in FY2017 to be able to repay the account payables in a shorter period of time. Nevertheless, an
increase in accounts payable ratio from FY2017 to FY 2018 may indicate that the company had
negotiated a different payment arrangement with its suppliers or the company was facing a
financial distress.
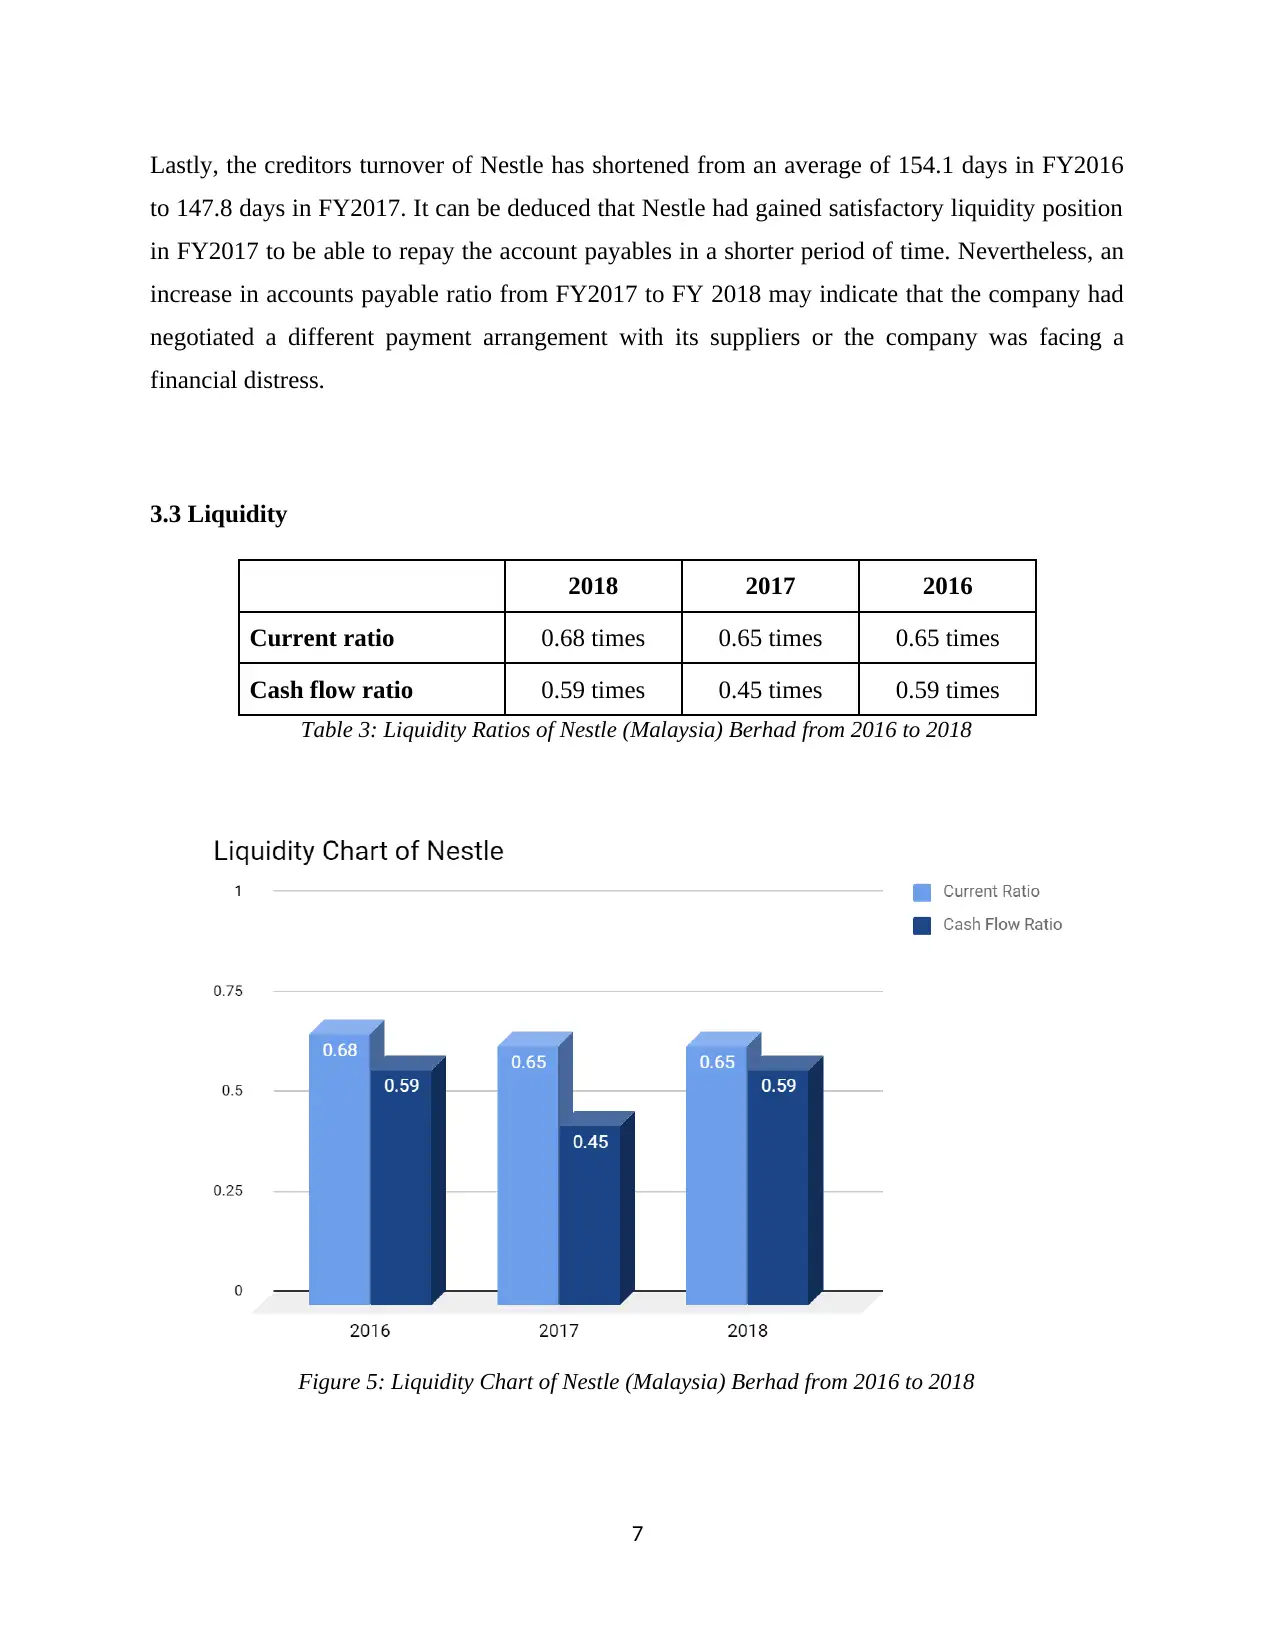
3.3 Liquidity
2018 2017 2016
Current ratio 0.68 times 0.65 times 0.65 times
Cash flow ratio 0.59 times 0.45 times 0.59 times
Table 3: Liquidity Ratios of Nestle (Malaysia) Berhad from 2016 to 2018
Figure 5: Liquidity Chart of Nestle (Malaysia) Berhad from 2016 to 2018
7
to 147.8 days in FY2017. It can be deduced that Nestle had gained satisfactory liquidity position
in FY2017 to be able to repay the account payables in a shorter period of time. Nevertheless, an
increase in accounts payable ratio from FY2017 to FY 2018 may indicate that the company had
negotiated a different payment arrangement with its suppliers or the company was facing a
financial distress.
3.3 Liquidity
2018 2017 2016
Current ratio 0.68 times 0.65 times 0.65 times
Cash flow ratio 0.59 times 0.45 times 0.59 times
Table 3: Liquidity Ratios of Nestle (Malaysia) Berhad from 2016 to 2018
Figure 5: Liquidity Chart of Nestle (Malaysia) Berhad from 2016 to 2018
7
In FY2016, Nestle has RM0.65 of current assets for every ringgit of current liabilities. This
remained constant in FY2017. Although, for a company to remain solvent, the firm must have a
current ratio of minimum 1.5x, this would ensure that the company is able to meet their current
debt obligations. In this case, Nestle has not been liquid throughout the aforementioned years but
has improved in slightly in FY2018 as it has increased by 0.03 in FY2018, making it the highest
of obtaining RM0.68 per $1 of current liabilities. Despite the improvement, the firm is still
operating at high levels of liquidity and moreover, it has a long activity cycle, which implies that
the firm is unlikely to meet its current debt obligations.
In FY2018, Nestle had RM0.59 of net operating cash flows for every ringgit current liabilities.
This may seem like positive increase compared to FY2017 with a difference of RM0.14 net
operating cash flows for every ringgit current liability. Although, after observing the timeline,
2018’s cash flow ratio is exactly the same as what FY2016 had encountered, implying that there
have been fluctuations throughout the years. With this in mind, it is possible for the firm to meet
its current obligations by using its net operating activities cash flows. Regardless, the cash flow
ratio, though more prevalent, is not a major representative of cash outflow. For example, many
companies deduct their depreciation expenses despite it not being a component of real cash
outflow, affecting the true accuracy of their cash outflow.
8
⊘ This is a preview!⊘
Do you want full access?
Subscribe today to unlock all pages.
Trusted by 1+ million students worldwide
1 out of 30
Related Documents


Your All-in-One AI-Powered Toolkit for Academic Success.
+13062052269
info@desklib.com
Available 24*7 on WhatsApp / Email
![[object Object]](/_next/static/media/star-bottom.7253800d.svg)
Unlock your academic potential
Copyright © 2020–2025 A2Z Services. All Rights Reserved. Developed and managed by ZUCOL.