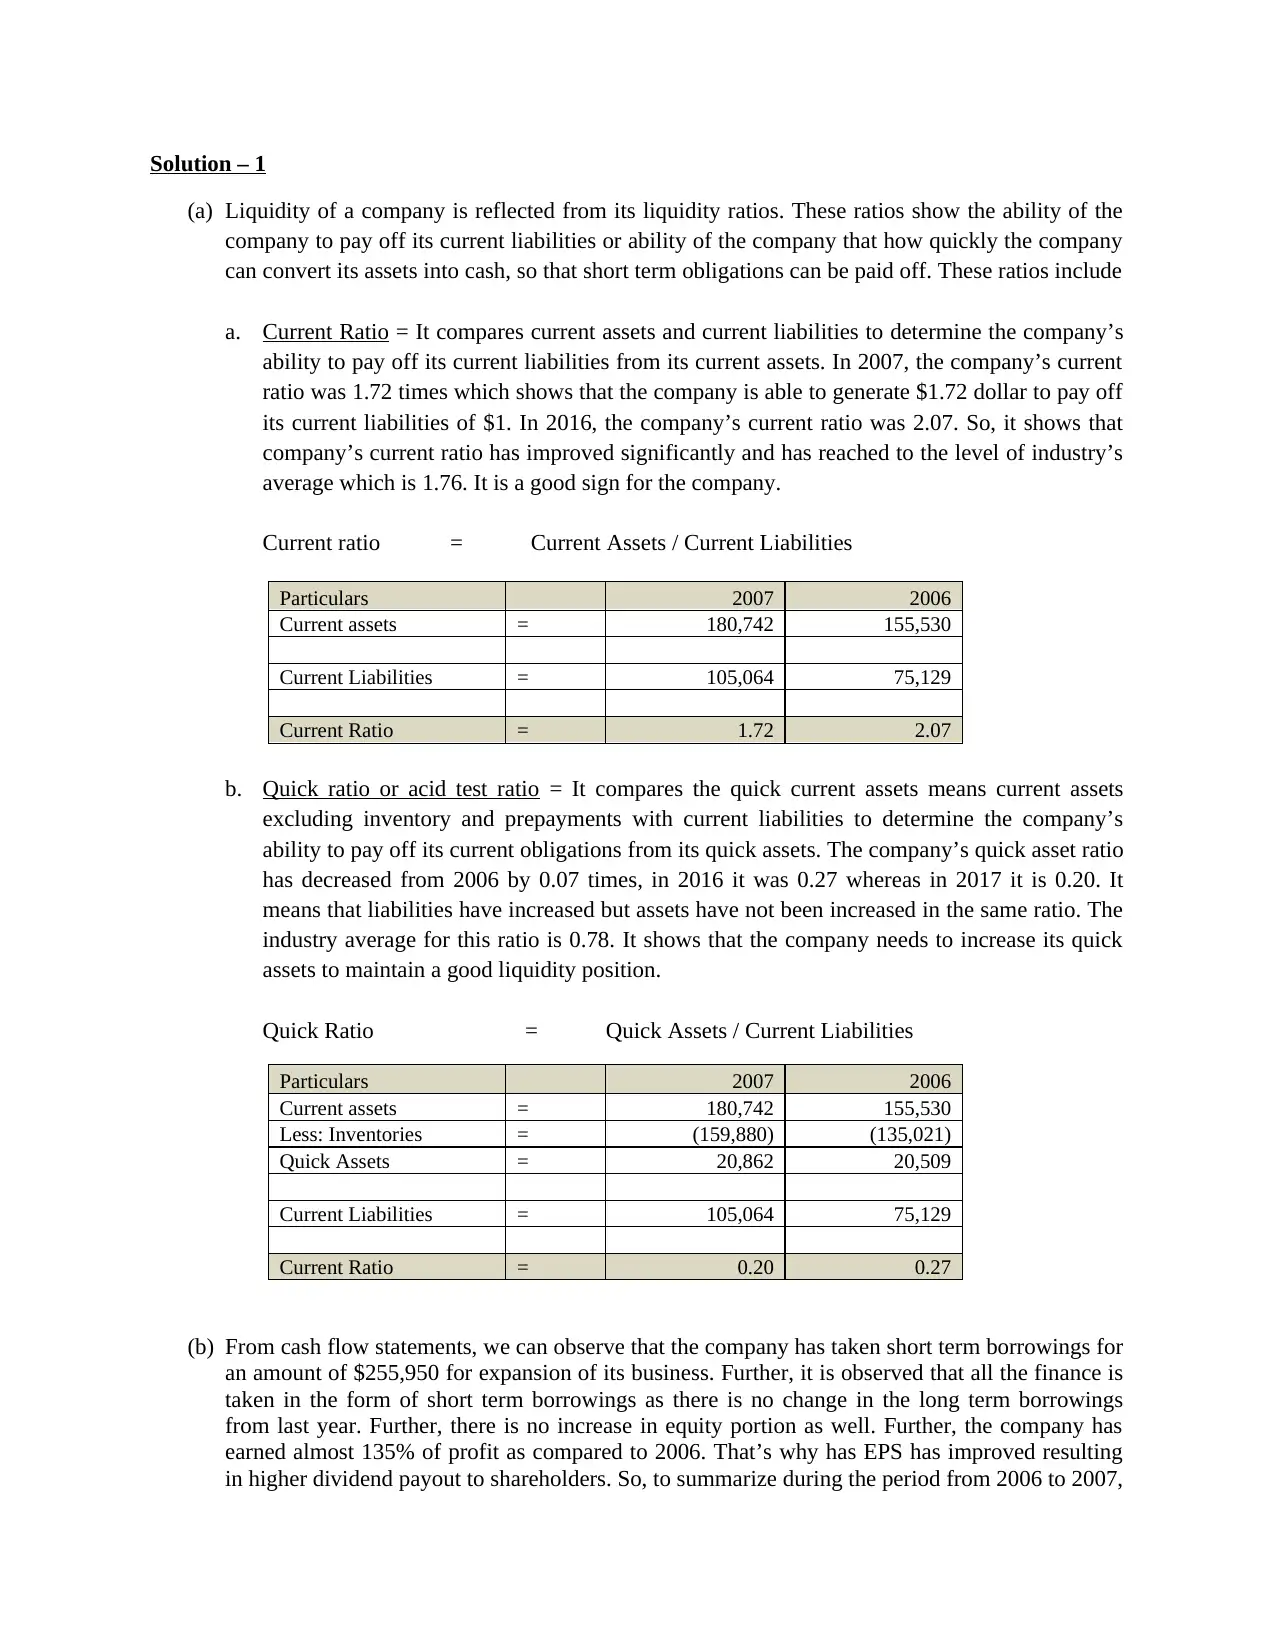
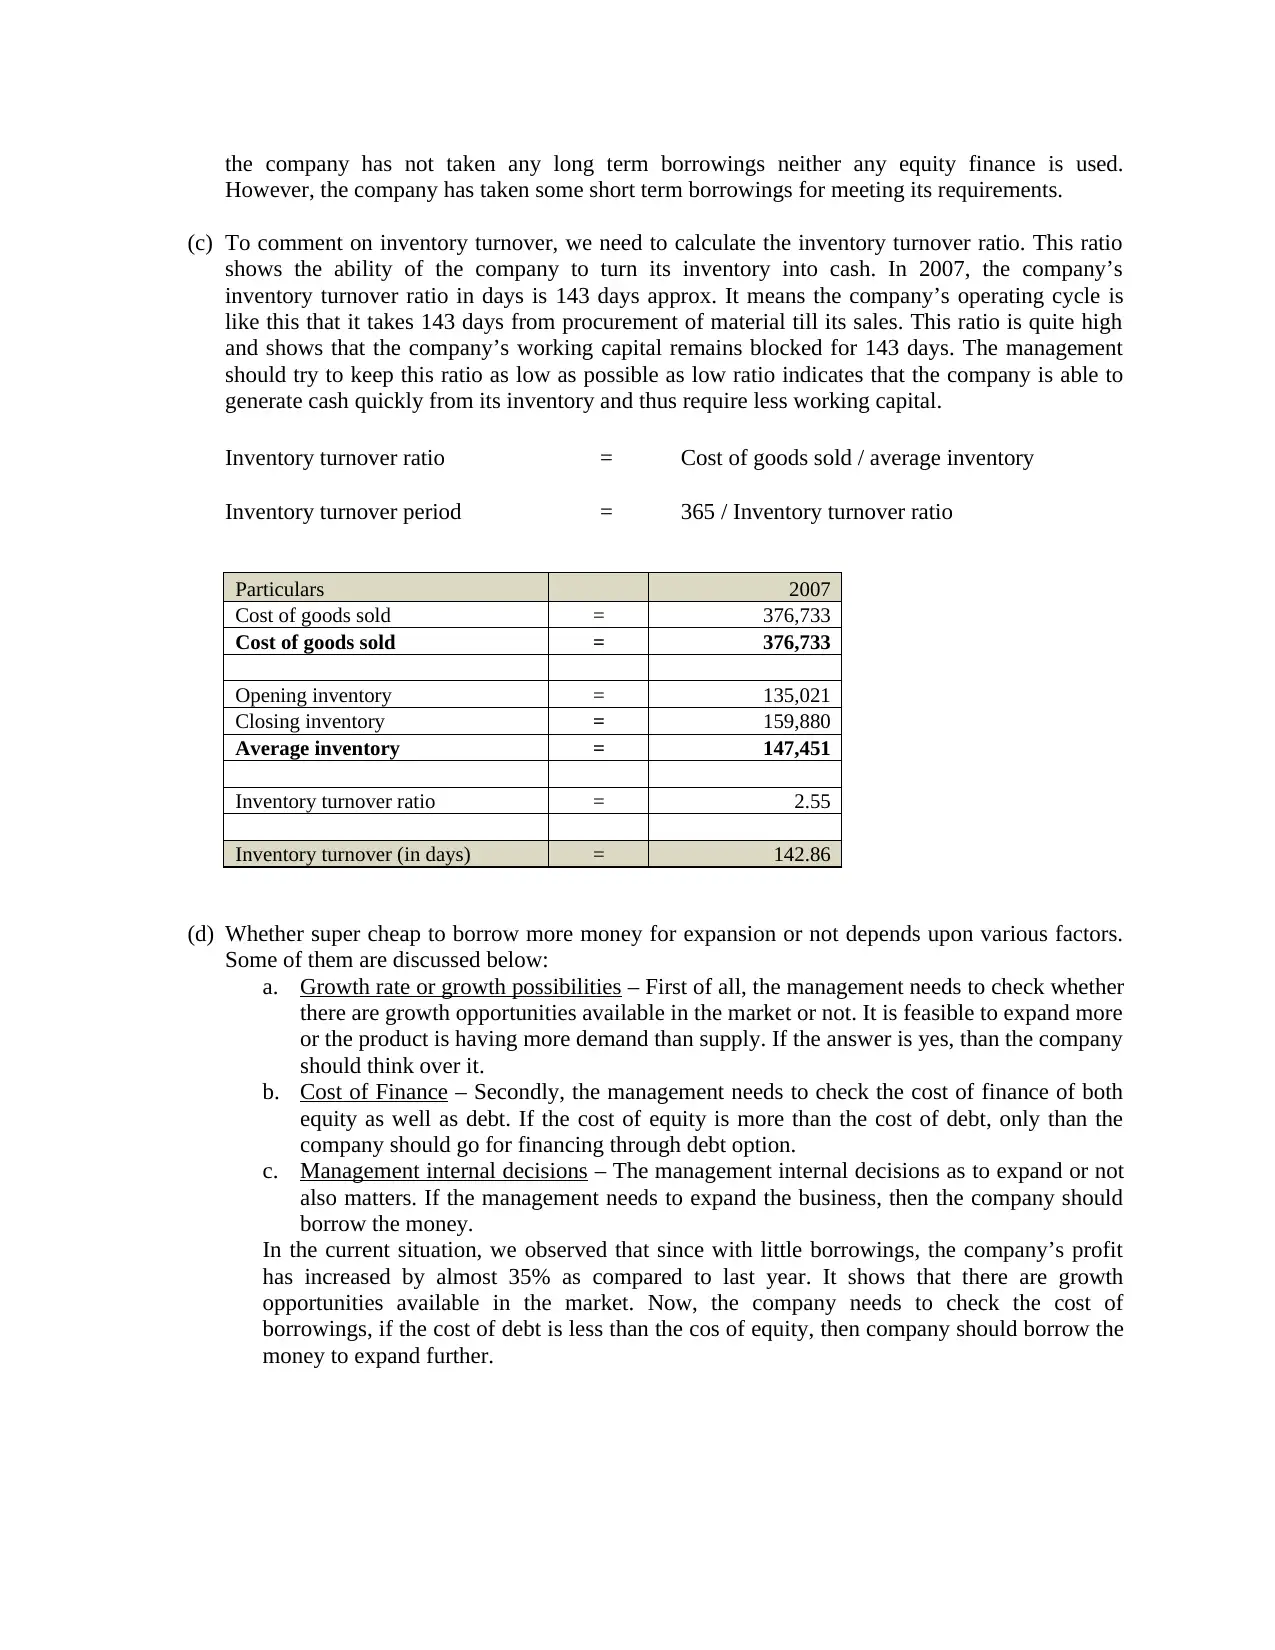
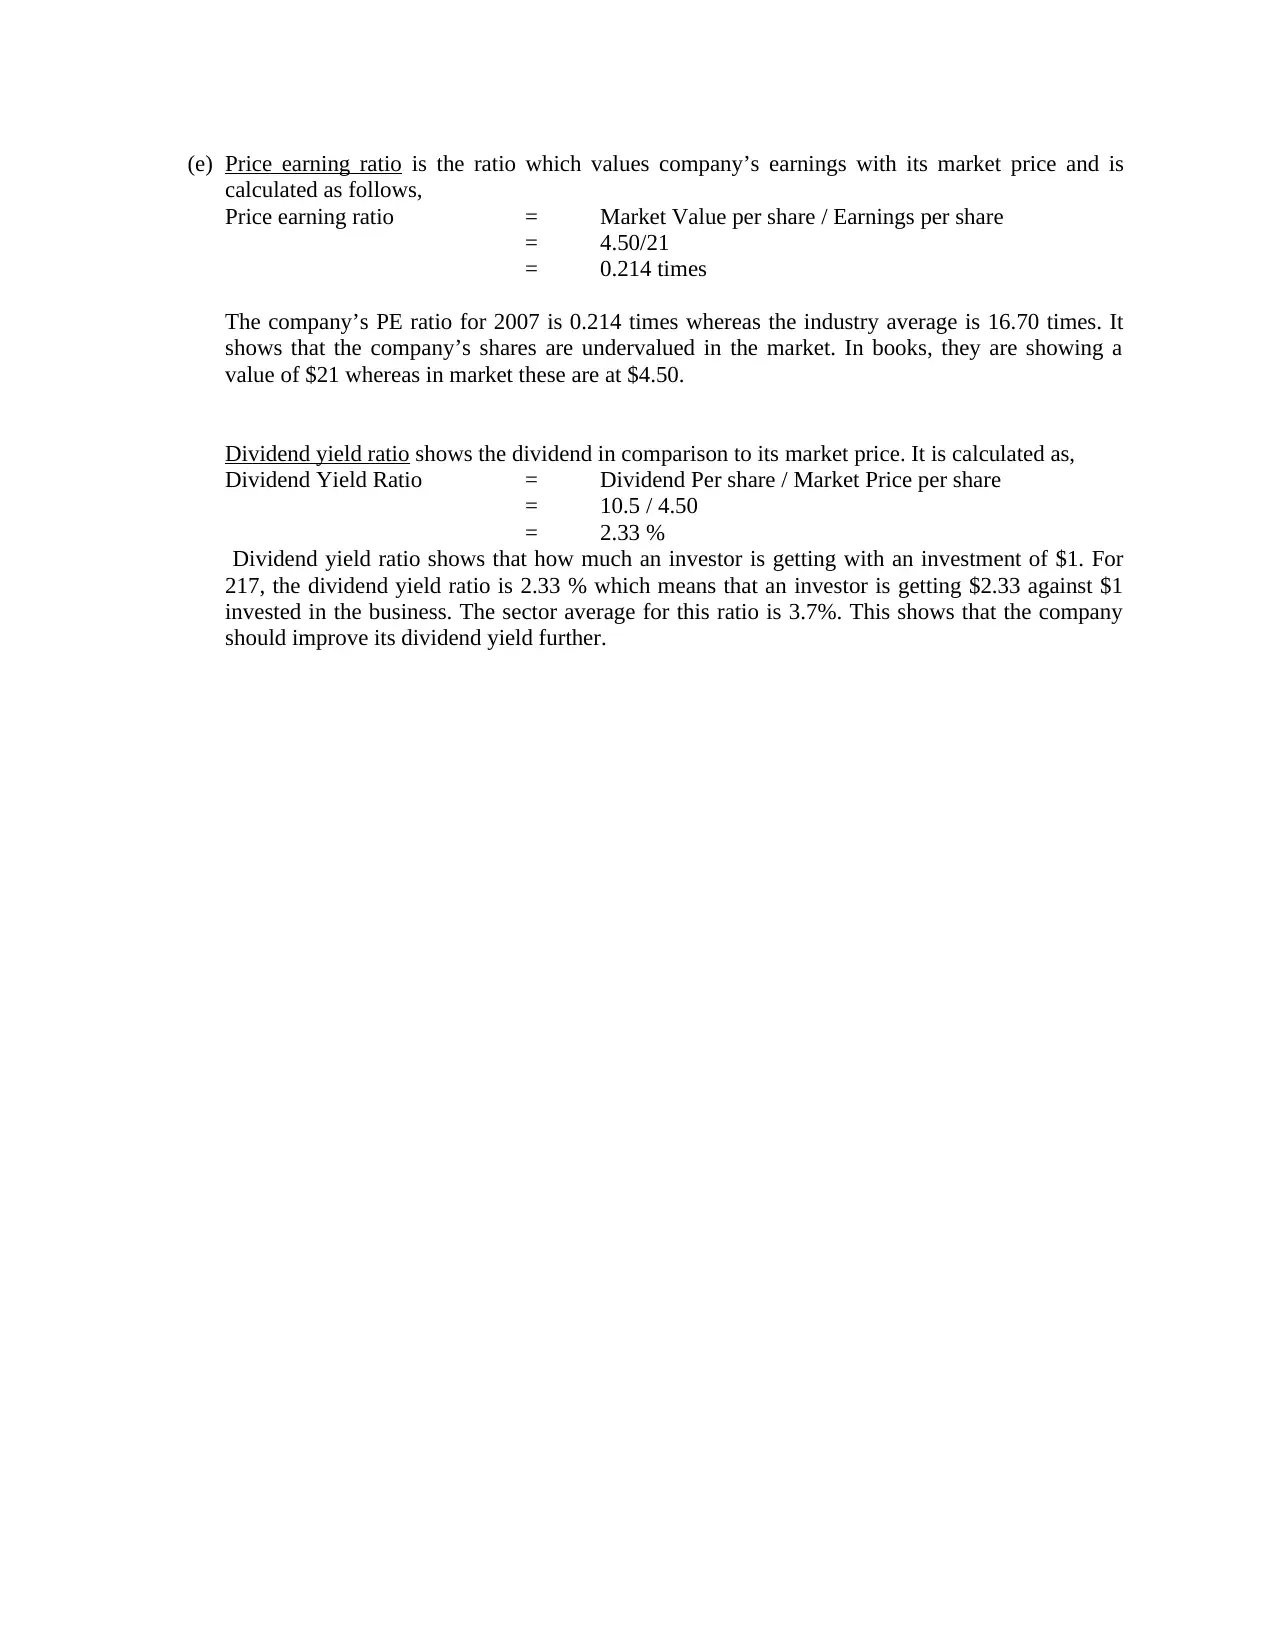
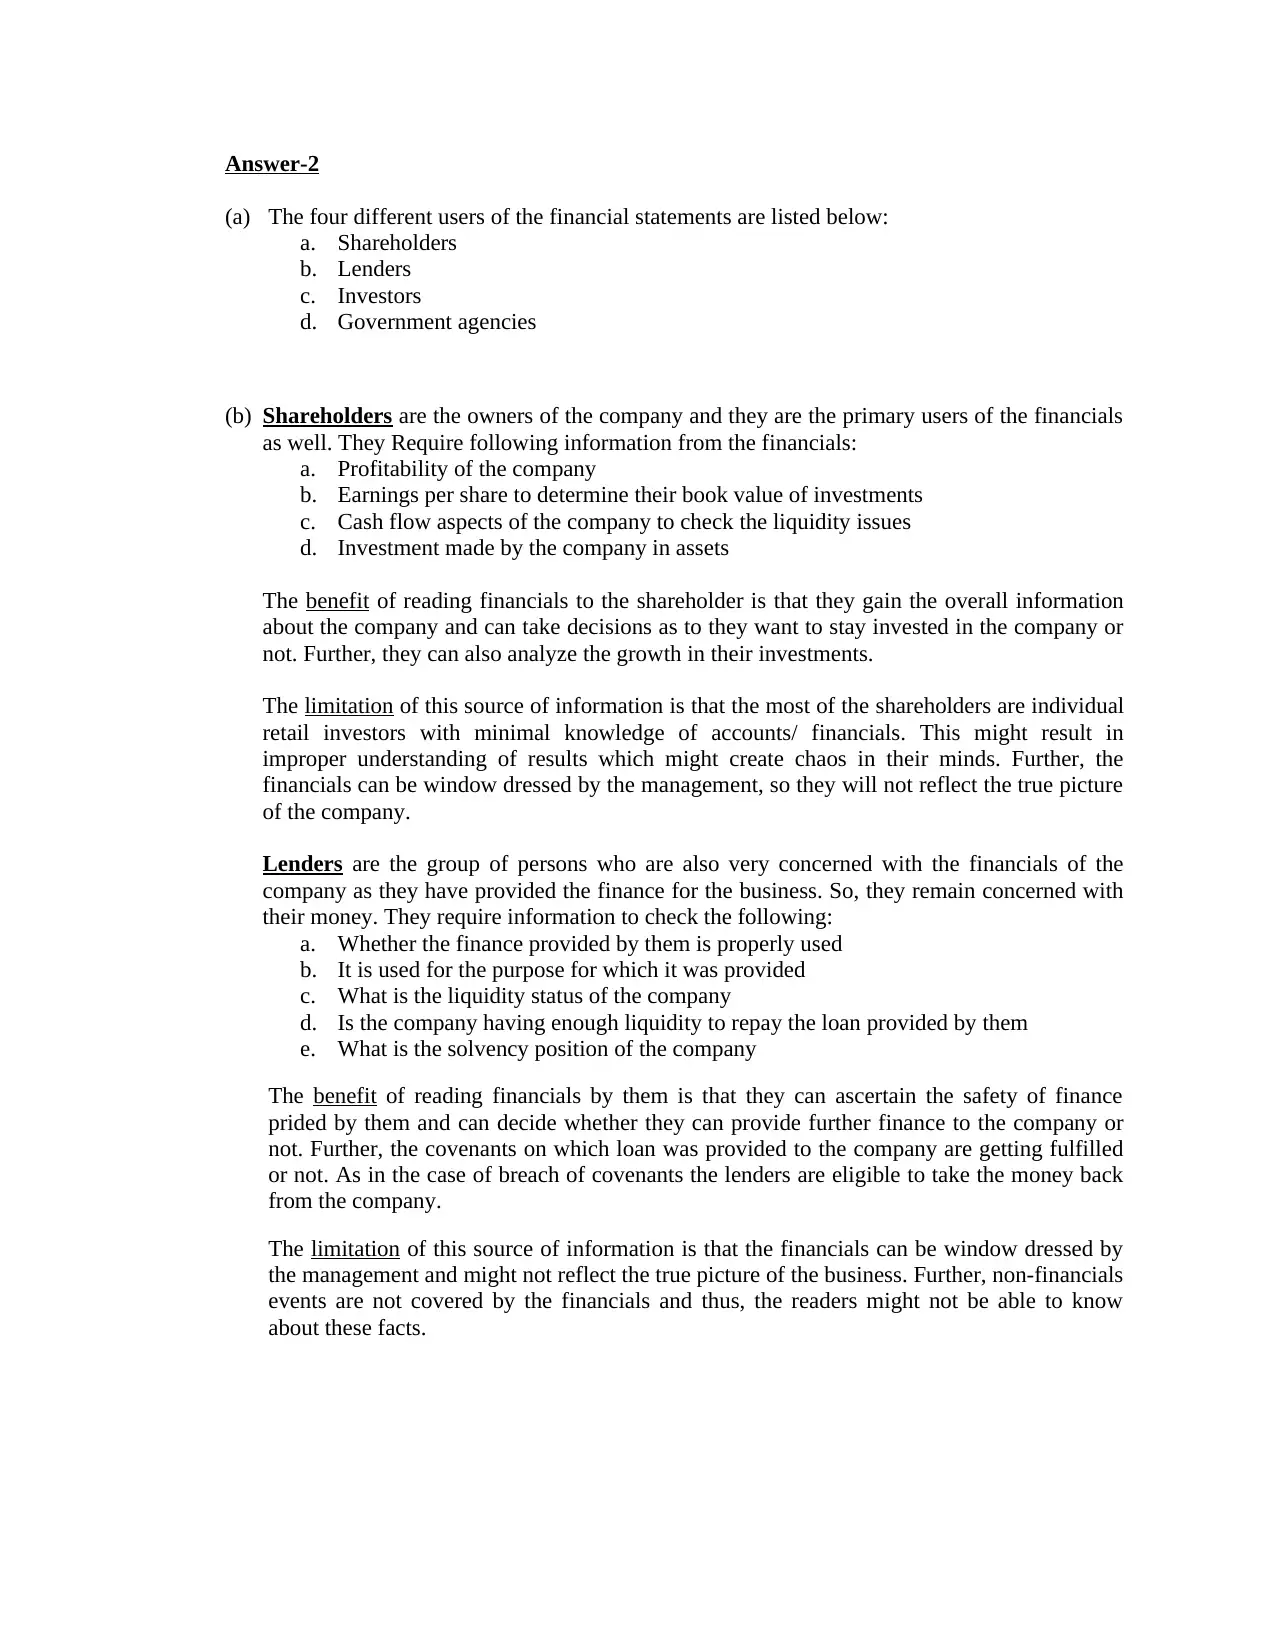
Analyzing Financial Statements & Ratios

Verified

Added on  2020/03/04

|5
|1619
|106
AI Summary
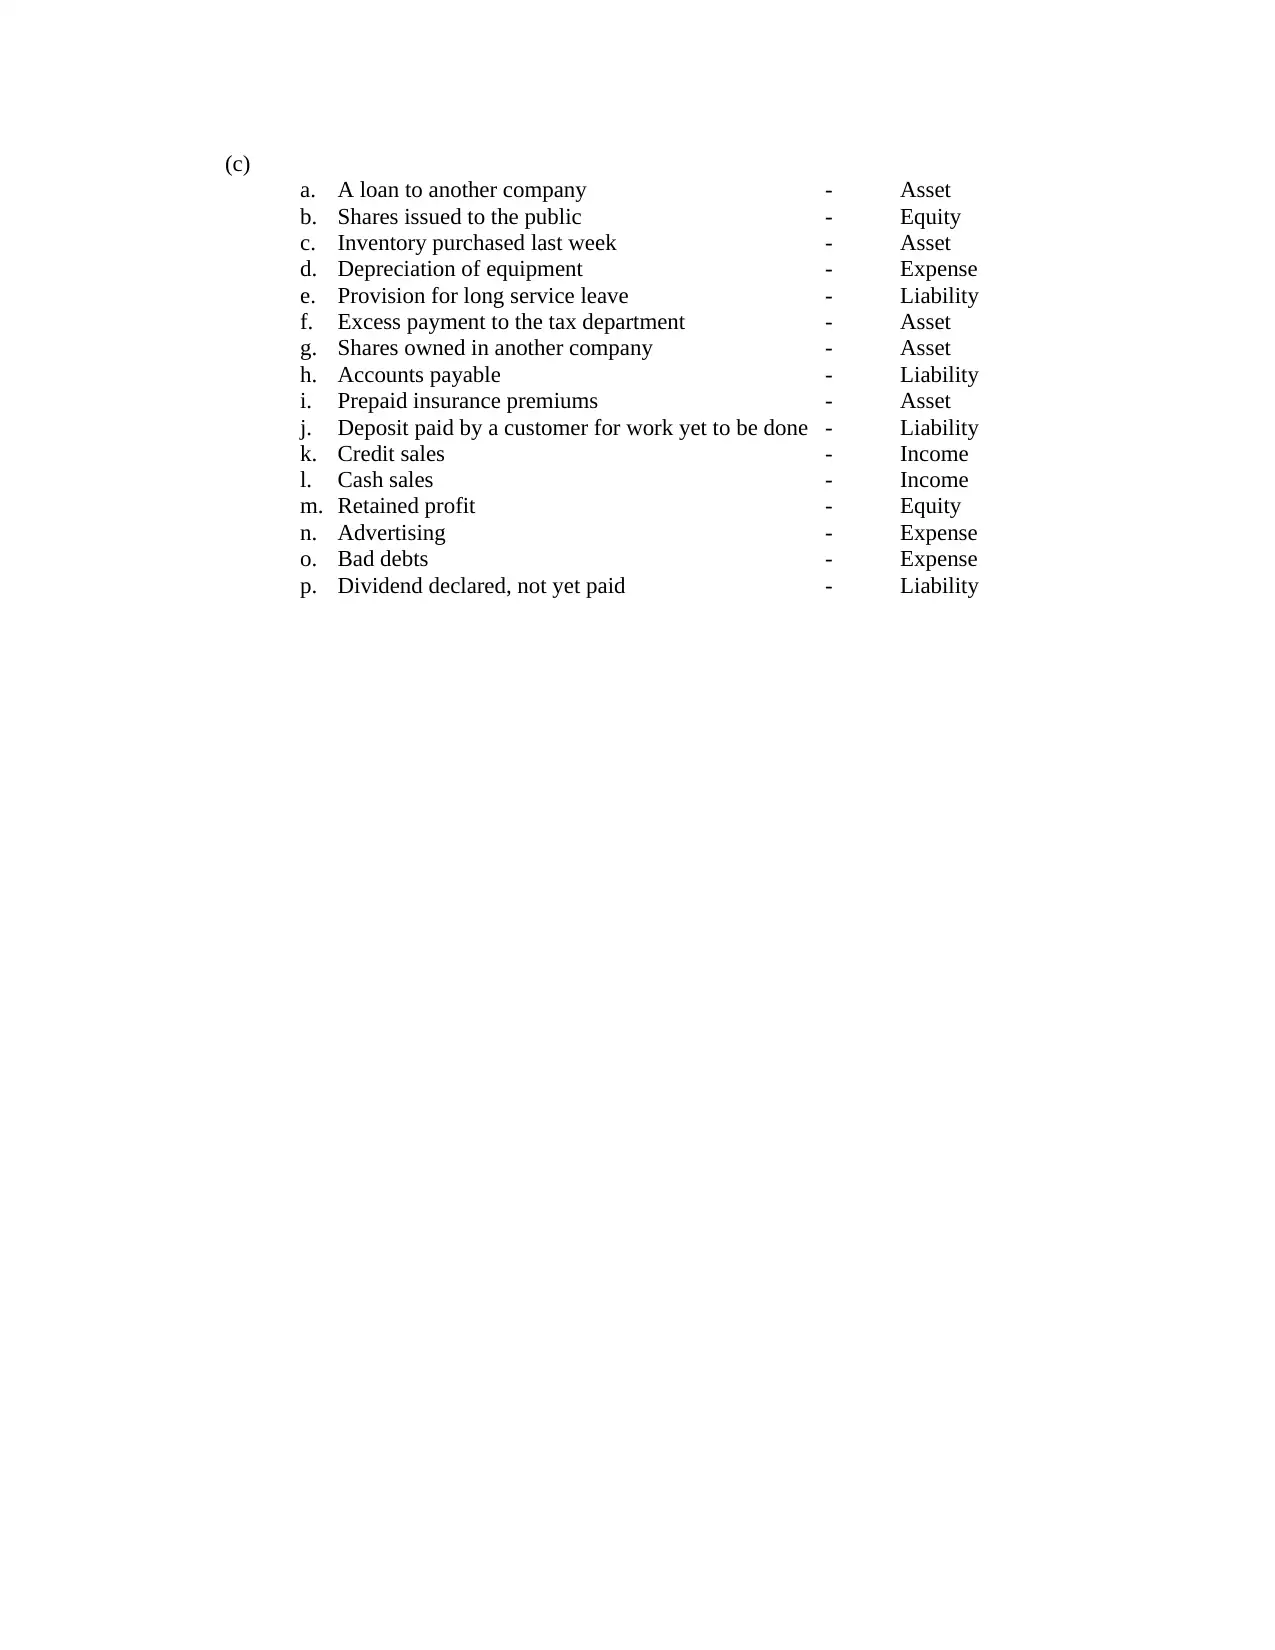
This assignment explores the concept of financial statement analysis by examining a company's performance through its dividend yield ratio and comparing it to industry averages. It also delves into the various users of financial statements, such as shareholders, lenders, and investors, highlighting their specific needs and information requirements. Furthermore, the assignment classifies different business transactions according to their impact on various accounting elements like assets, liabilities, equity, income, and expenses.
tabler-icon-diamond-filled.svg

Contribute Materials

Your contribution can guide someone’s learning journey. Share your documents today.
Document Page
Solution – 1
(a) Liquidity of a company is reflected from its liquidity ratios. These ratios show the ability of the
company to pay off its current liabilities or ability of the company that how quickly the company
can convert its assets into cash, so that short term obligations can be paid off. These ratios include
a. Current Ratio = It compares current assets and current liabilities to determine the company’s
ability to pay off its current liabilities from its current assets. In 2007, the company’s current
ratio was 1.72 times which shows that the company is able to generate $1.72 dollar to pay off
its current liabilities of $1. In 2016, the company’s current ratio was 2.07. So, it shows that
company’s current ratio has improved significantly and has reached to the level of industry’s
average which is 1.76. It is a good sign for the company.
Current ratio = Current Assets / Current Liabilities
Particulars 2007 2006
Current assets = 180,742 155,530
Current Liabilities = 105,064 75,129
Current Ratio = 1.72 2.07
b. Quick ratio or acid test ratio = It compares the quick current assets means current assets
excluding inventory and prepayments with current liabilities to determine the company’s
ability to pay off its current obligations from its quick assets. The company’s quick asset ratio
has decreased from 2006 by 0.07 times, in 2016 it was 0.27 whereas in 2017 it is 0.20. It
means that liabilities have increased but assets have not been increased in the same ratio. The
industry average for this ratio is 0.78. It shows that the company needs to increase its quick
assets to maintain a good liquidity position.
Quick Ratio = Quick Assets / Current Liabilities
Particulars 2007 2006
Current assets = 180,742 155,530
Less: Inventories = (159,880) (135,021)
Quick Assets = 20,862 20,509
Current Liabilities = 105,064 75,129
Current Ratio = 0.20 0.27
(b) From cash flow statements, we can observe that the company has taken short term borrowings for
an amount of $255,950 for expansion of its business. Further, it is observed that all the finance is
taken in the form of short term borrowings as there is no change in the long term borrowings
from last year. Further, there is no increase in equity portion as well. Further, the company has
earned almost 135% of profit as compared to 2006. That’s why has EPS has improved resulting
in higher dividend payout to shareholders. So, to summarize during the period from 2006 to 2007,
tabler-icon-diamond-filled.svg

Secure Best Marks with AI Grader

Need help grading? Try our AI Grader for instant feedback on your assignments.
Document Page
the company has not taken any long term borrowings neither any equity finance is used.
However, the company has taken some short term borrowings for meeting its requirements.
(c) To comment on inventory turnover, we need to calculate the inventory turnover ratio. This ratio
shows the ability of the company to turn its inventory into cash. In 2007, the company’s
inventory turnover ratio in days is 143 days approx. It means the company’s operating cycle is
like this that it takes 143 days from procurement of material till its sales. This ratio is quite high
and shows that the company’s working capital remains blocked for 143 days. The management
should try to keep this ratio as low as possible as low ratio indicates that the company is able to
generate cash quickly from its inventory and thus require less working capital.
Inventory turnover ratio = Cost of goods sold / average inventory
Inventory turnover period = 365 / Inventory turnover ratio
Particulars 2007
Cost of goods sold = 376,733
Opening inventory = 135,021
Closing inventory = 159,880
Average inventory = 147,451
Inventory turnover ratio = 2.55
Inventory turnover (in days) = 142.86
(d) Whether super cheap to borrow more money for expansion or not depends upon various factors.
Some of them are discussed below:
a. Growth rate or growth possibilities – First of all, the management needs to check whether
there are growth opportunities available in the market or not. It is feasible to expand more
or the product is having more demand than supply. If the answer is yes, than the company
should think over it.
b. Cost of Finance – Secondly, the management needs to check the cost of finance of both
equity as well as debt. If the cost of equity is more than the cost of debt, only than the
company should go for financing through debt option.
c. Management internal decisions – The management internal decisions as to expand or not
also matters. If the management needs to expand the business, then the company should
borrow the money.
In the current situation, we observed that since with little borrowings, the company’s profit
has increased by almost 35% as compared to last year. It shows that there are growth
opportunities available in the market. Now, the company needs to check the cost of
borrowings, if the cost of debt is less than the cos of equity, then company should borrow the
money to expand further.
Document Page
(e) Price earning ratio is the ratio which values company’s earnings with its market price and is
calculated as follows,
Price earning ratio = Market Value per share / Earnings per share
= 4.50/21
= 0.214 times
The company’s PE ratio for 2007 is 0.214 times whereas the industry average is 16.70 times. It
shows that the company’s shares are undervalued in the market. In books, they are showing a
value of $21 whereas in market these are at $4.50.
Dividend yield ratio shows the dividend in comparison to its market price. It is calculated as,
Dividend Yield Ratio = Dividend Per share / Market Price per share
= 10.5 / 4.50
= 2.33 %
Dividend yield ratio shows that how much an investor is getting with an investment of $1. For
217, the dividend yield ratio is 2.33 % which means that an investor is getting $2.33 against $1
invested in the business. The sector average for this ratio is 3.7%. This shows that the company
should improve its dividend yield further.
Document Page
Answer-2
(a) The four different users of the financial statements are listed below:
a. Shareholders
b. Lenders
c. Investors
d. Government agencies
(b) Shareholders are the owners of the company and they are the primary users of the financials
as well. They Require following information from the financials:
a. Profitability of the company
b. Earnings per share to determine their book value of investments
c. Cash flow aspects of the company to check the liquidity issues
d. Investment made by the company in assets
The benefit of reading financials to the shareholder is that they gain the overall information
about the company and can take decisions as to they want to stay invested in the company or
not. Further, they can also analyze the growth in their investments.
The limitation of this source of information is that the most of the shareholders are individual
retail investors with minimal knowledge of accounts/ financials. This might result in
improper understanding of results which might create chaos in their minds. Further, the
financials can be window dressed by the management, so they will not reflect the true picture
of the company.
Lenders are the group of persons who are also very concerned with the financials of the
company as they have provided the finance for the business. So, they remain concerned with
their money. They require information to check the following:
a. Whether the finance provided by them is properly used
b. It is used for the purpose for which it was provided
c. What is the liquidity status of the company
d. Is the company having enough liquidity to repay the loan provided by them
e. What is the solvency position of the company
The benefit of reading financials by them is that they can ascertain the safety of finance
prided by them and can decide whether they can provide further finance to the company or
not. Further, the covenants on which loan was provided to the company are getting fulfilled
or not. As in the case of breach of covenants the lenders are eligible to take the money back
from the company.
The limitation of this source of information is that the financials can be window dressed by
the management and might not reflect the true picture of the business. Further, non-financials
events are not covered by the financials and thus, the readers might not be able to know
about these facts.
tabler-icon-diamond-filled.svg

Secure Best Marks with AI Grader

Need help grading? Try our AI Grader for instant feedback on your assignments.
Document Page
(c)
a. A loan to another company - Asset
b. Shares issued to the public - Equity
c. Inventory purchased last week - Asset
d. Depreciation of equipment - Expense
e. Provision for long service leave - Liability
f. Excess payment to the tax department - Asset
g. Shares owned in another company - Asset
h. Accounts payable - Liability
i. Prepaid insurance premiums - Asset
j. Deposit paid by a customer for work yet to be done - Liability
k. Credit sales - Income
l. Cash sales - Income
m. Retained profit - Equity
n. Advertising - Expense
o. Bad debts - Expense
p. Dividend declared, not yet paid - Liability
chevron_up_icon
1 out of 5
circle_padding
hide_on_mobile
zoom_out_icon
[object Object]

Your All-in-One AI-Powered Toolkit for Academic Success.

Available 24*7 on WhatsApp / Email

[object Object]