ACC508: Information Systems, Decision Support, and Finance Report
VerifiedAdded on 2020/04/01
|16
|2256
|461
Report
AI Summary
This report analyzes Riverlea's decision to supply a private label confectionery to Wowcoles, assessing the viability of the investment through capital budgeting techniques. The report is divided into two sections. The first section focuses on determining Riverlea's discount rate using the CAPM model, calculating after-tax cash flows under a base scenario, and conducting sensitivity analysis through two additional scenarios. The analysis includes calculating Net Present Value (NPV), Internal Rate of Return (IRR), Payback Period, and Profitability Index (PI) to evaluate the project's financial attractiveness. The second section tests the semi-strong form market efficiency by examining Riverlea's stock price movement before and after the announcement of the new project. The analysis concludes that based on the positive NPV, IRR, and PI under all scenarios, Riverlea should invest in the project, and that the company’s stock price is consistent with semi-strong form market efficiency.

Corporate Finance Assignment
Paraphrase This Document
Need a fresh take? Get an instant paraphrase of this document with our AI Paraphraser
EXECUTIVE SUMMARY
To assess the viability of an investment such as the purchase or replacement of plant or
equipment, or a new product line, a company will need to perform capital budgeting
(Accounting Explained, 2017).
There are various techniques that may be used for capital budgeting. These include the
payback period, discounted payback period, internal rate of return, the net present value
and profitability index. These techniques can either be used alone or in a combination
for better results.
The hurdle rate or discount rate is the minimum return that a business expects to earn
on an investment. The cost of capital may be taken as a good initial point to assess the
company’s hurdle rate (Tucker, 2009).
Informational efficiency measures how the market reacts and responds to new
information. For example, when a company announces plans to invest in a new product
line or similar project, this news may have an effect on the company’s share price. The
semi-strong form of efficiency states all publicly available information will be reflected in
the firm’s share prices (Investopedia, 2017).
.
i
TABLE OF CONTENTS
EXECUTIVE SUMMARY..........................................................................................................................i
TABLE OF CONTENTS...........................................................................................................................ii
LIST OF TABLES.....................................................................................................................................iii
LIST OF FIGURES..................................................................................................................................iv
CHAPTER 1 : SECTION ONE- CAPITAL BUDGETING.....................................................................1
1.1 Introduction.....................................................................................................................................1
1.2 Discount or Hurdle Rate................................................................................................................1
1.3 Base Scenario- After Tax Cash Flows........................................................................................1
1.4 Sensitivity Analysis- - After Tax Cash Flows..............................................................................3
1.5 Conclusion.......................................................................................................................................6
CHAPTER 2 : SECTION TWO- SEMI-STRONG FORM MARKET EFFICIENCY...........................7
2.1 Introduction.....................................................................................................................................7
2.2 Semi-Strong Form Market Hypothesis........................................................................................7
2.3 Test for Semi-Strong Form Market Hypothesis..........................................................................7
2.4 Conclusion.......................................................................................................................................8
REFERENCES..........................................................................................................................................9
APPENDIX...............................................................................................................................................10
ii
⊘ This is a preview!⊘
Do you want full access?
Subscribe today to unlock all pages.
Trusted by 1+ million students worldwide
LIST OF TABLES
Table 1-1: After Tax Cash Flow Operations.....................................................................2
Table 1-2: Cash Flows Investment...................................................................................2
Table 1-3: After Tax Cash Flows -Base Scenario............................................................3
Table 1-4: NPV, IRR, PBP, PI- Base Scenario................................................................3
Table 1-5: After Tax Cash Flows - Scenario 1.................................................................4
Table 1-6: NPV, IRR, PBP, PI- Scenario One..................................................................5
Table 1-7: After Tax Cash Flows - Scenario 2.................................................................5
Table 1-8: NPV, IRR, PBP, PI- Scenario Two..................................................................6
iii
Paraphrase This Document
Need a fresh take? Get an instant paraphrase of this document with our AI Paraphraser

LIST OF FIGURES
Figure 2-1: Riverlea stock price....................................................................................... 7
iv
Figure 2-1: Riverlea stock price....................................................................................... 7
iv
CHAPTER 1: SECTION ONE- CAPITAL BUDGETING
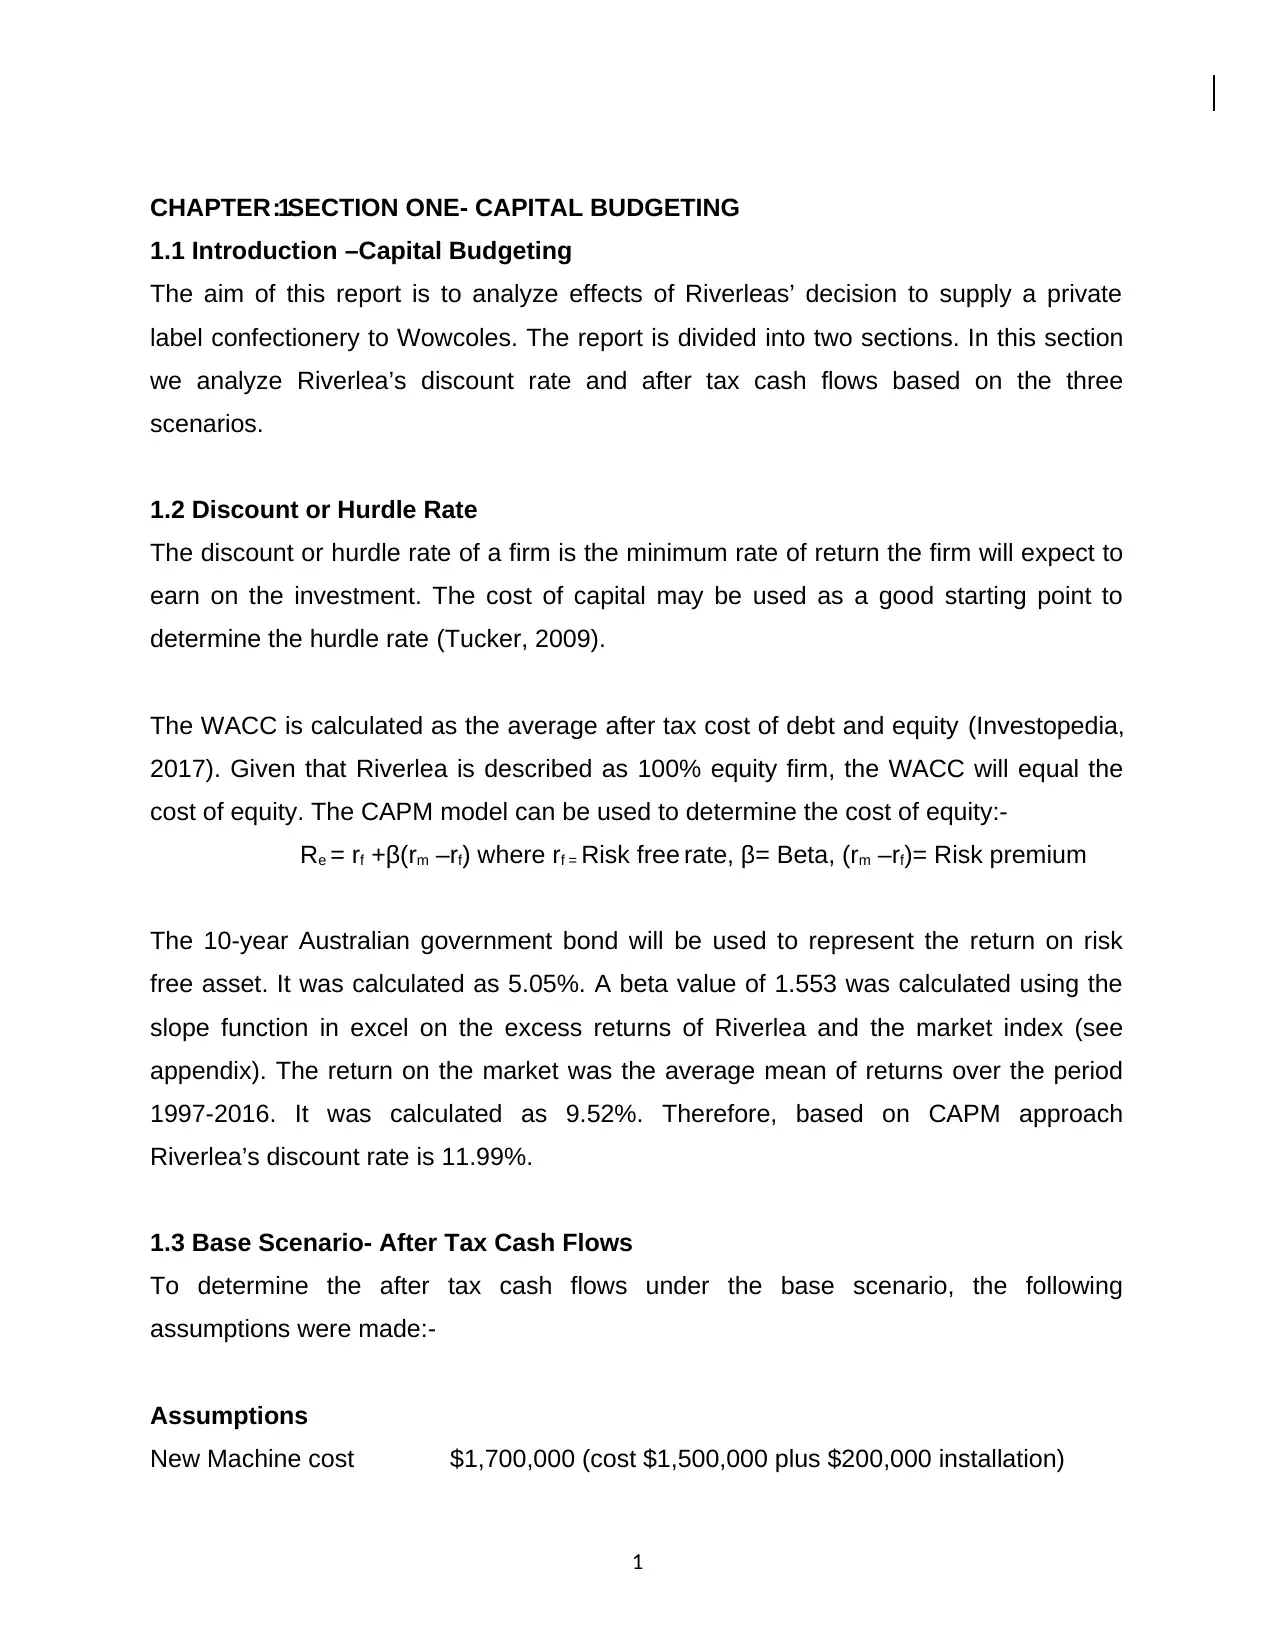
1.1 Introduction –Capital Budgeting
The aim of this report is to analyze effects of Riverleas’ decision to supply a private
label confectionery to Wowcoles. The report is divided into two sections. In this section
we analyze Riverlea’s discount rate and after tax cash flows based on the three
scenarios.
1.2 Discount or Hurdle Rate
The discount or hurdle rate of a firm is the minimum rate of return the firm will expect to
earn on the investment. The cost of capital may be used as a good starting point to
determine the hurdle rate (Tucker, 2009).
The WACC is calculated as the average after tax cost of debt and equity (Investopedia,
2017). Given that Riverlea is described as 100% equity firm, the WACC will equal the
cost of equity. The CAPM model can be used to determine the cost of equity:-
Re = rf +β(rm –rf) where rf = Risk free rate, β= Beta, (rm –rf)= Risk premium
The 10-year Australian government bond will be used to represent the return on risk
free asset. It was calculated as 5.05%. A beta value of 1.553 was calculated using the
slope function in excel on the excess returns of Riverlea and the market index (see
appendix). The return on the market was the average mean of returns over the period
1997-2016. It was calculated as 9.52%. Therefore, based on CAPM approach
Riverlea’s discount rate is 11.99%.
1.3 Base Scenario- After Tax Cash Flows
To determine the after tax cash flows under the base scenario, the following
assumptions were made:-
Assumptions
New Machine cost $1,700,000 (cost $1,500,000 plus $200,000 installation)
1
⊘ This is a preview!⊘
Do you want full access?
Subscribe today to unlock all pages.
Trusted by 1+ million students worldwide
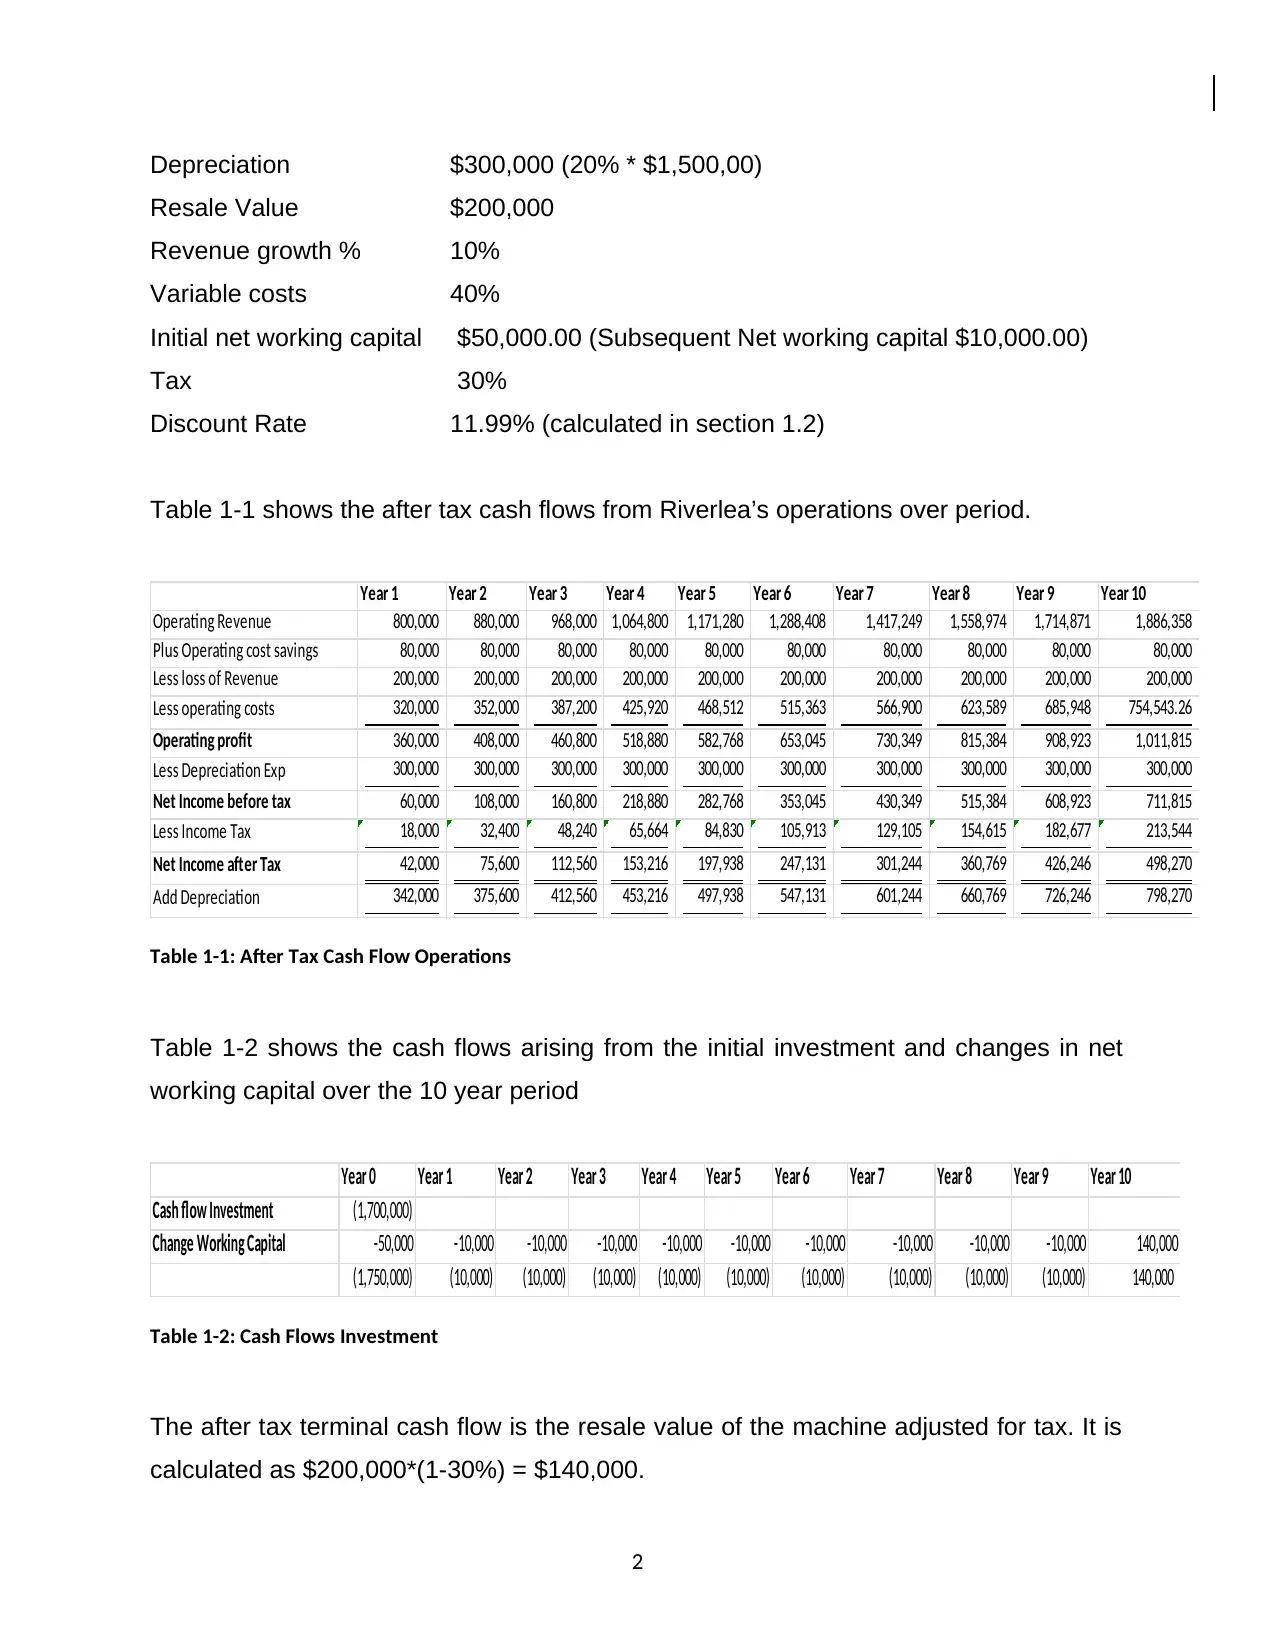
Depreciation $300,000 (20% * $1,500,00)
Resale Value $200,000
Revenue growth % 10%
Variable costs 40%
Initial net working capital $50,000.00 (Subsequent Net working capital $10,000.00)
Tax 30%
Discount Rate 11.99% (calculated in section 1.2)
Table 1-1 shows the after tax cash flows from Riverlea’s operations over period.
Year 1 Year 2 Year 3 Year 4 Year 5 Year 6 Year 7 Year 8 Year 9 Year 10
Operating Revenue 800,000 880,000 968,000 1,064,800 1,171,280 1,288,408 1,417,249 1,558,974 1,714,871 1,886,358
Plus Operating cost savings 80,000 80,000 80,000 80,000 80,000 80,000 80,000 80,000 80,000 80,000
Less loss of Revenue 200,000 200,000 200,000 200,000 200,000 200,000 200,000 200,000 200,000 200,000
Less operating costs 320,000 352,000 387,200 425,920 468,512 515,363 566,900 623,589 685,948 754,543.26
Operating profit 360,000 408,000 460,800 518,880 582,768 653,045 730,349 815,384 908,923 1,011,815
Less Depreciation Exp 300,000 300,000 300,000 300,000 300,000 300,000 300,000 300,000 300,000 300,000
Net Income before tax 60,000 108,000 160,800 218,880 282,768 353,045 430,349 515,384 608,923 711,815
Less Income Tax 18,000 32,400 48,240 65,664 84,830 105,913 129,105 154,615 182,677 213,544
Net Income after Tax 42,000 75,600 112,560 153,216 197,938 247,131 301,244 360,769 426,246 498,270
Add Depreciation 342,000 375,600 412,560 453,216 497,938 547,131 601,244 660,769 726,246 798,270
After Tax Cash inflow operations 384,000 451,200 525,120 606,432 695,875 794,263 902,489 1,021,538 1,152,492 1,296,541
Table 1-1: After Tax Cash Flow Operations
Table 1-2 shows the cash flows arising from the initial investment and changes in net
working capital over the 10 year period
Year 0 Year 1 Year 2 Year 3 Year 4 Year 5 Year 6 Year 7 Year 8 Year 9 Year 10
Cash flow Investment (1,700,000)
Change Working Capital -50,000 -10,000 -10,000 -10,000 -10,000 -10,000 -10,000 -10,000 -10,000 -10,000 140,000
(1,750,000) (10,000) (10,000) (10,000) (10,000) (10,000) (10,000) (10,000) (10,000) (10,000) 140,000
Table 1-2: Cash Flows Investment
The after tax terminal cash flow is the resale value of the machine adjusted for tax. It is
calculated as $200,000*(1-30%) = $140,000.
2
Paraphrase This Document
Need a fresh take? Get an instant paraphrase of this document with our AI Paraphraser
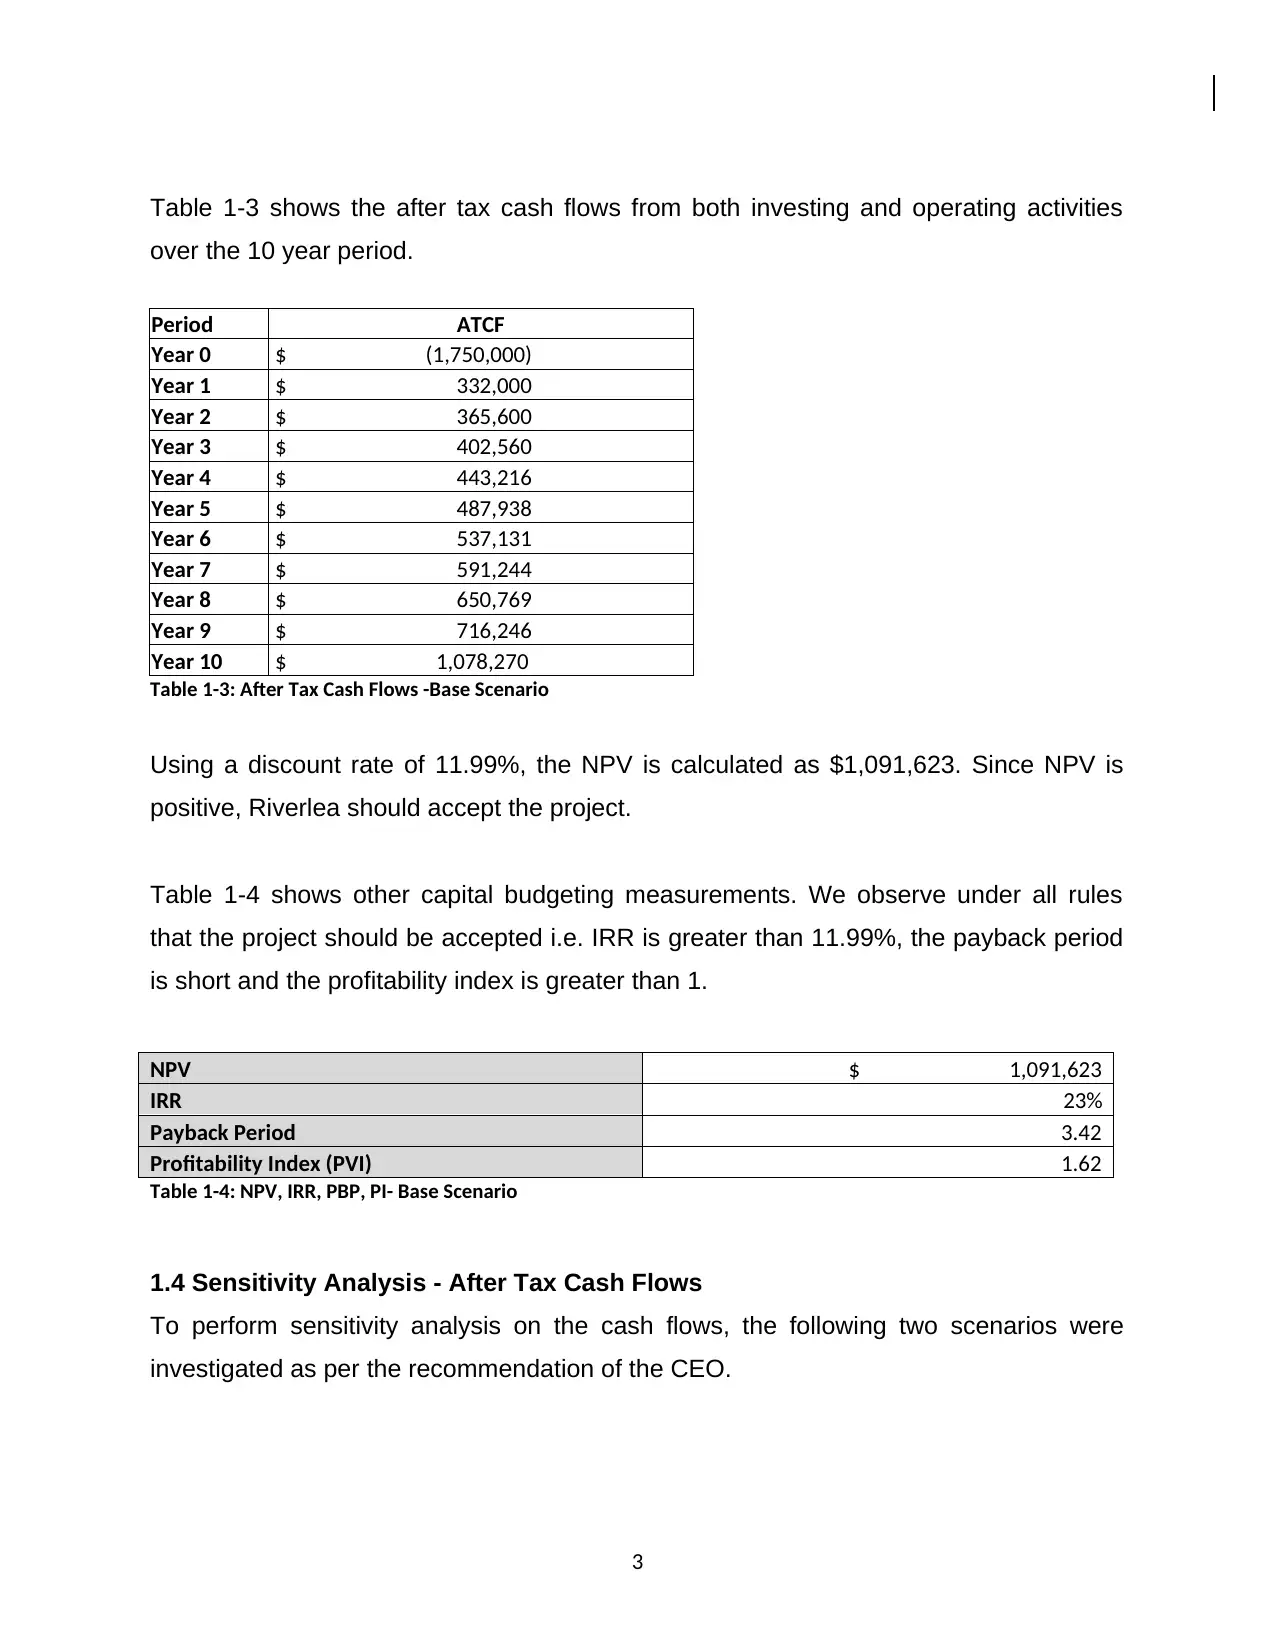
Table 1-3 shows the after tax cash flows from both investing and operating activities
over the 10 year period.
Period ATCF
Year 0 $ (1,750,000)
Year 1 $ 332,000
Year 2 $ 365,600
Year 3 $ 402,560
Year 4 $ 443,216
Year 5 $ 487,938
Year 6 $ 537,131
Year 7 $ 591,244
Year 8 $ 650,769
Year 9 $ 716,246
Year 10 $ 1,078,270
Table 1-3: After Tax Cash Flows -Base Scenario
Using a discount rate of 11.99%, the NPV is calculated as $1,091,623. Since NPV is
positive, Riverlea should accept the project.
Table 1-4 shows other capital budgeting measurements. We observe under all rules
that the project should be accepted i.e. IRR is greater than 11.99%, the payback period
is short and the profitability index is greater than 1.
NPV $ 1,091,623
IRR 23%
Payback Period 3.42
Profitability Index (PVI) 1.62
Table 1-4: NPV, IRR, PBP, PI- Base Scenario
1.4 Sensitivity Analysis - After Tax Cash Flows
To perform sensitivity analysis on the cash flows, the following two scenarios were
investigated as per the recommendation of the CEO.
3
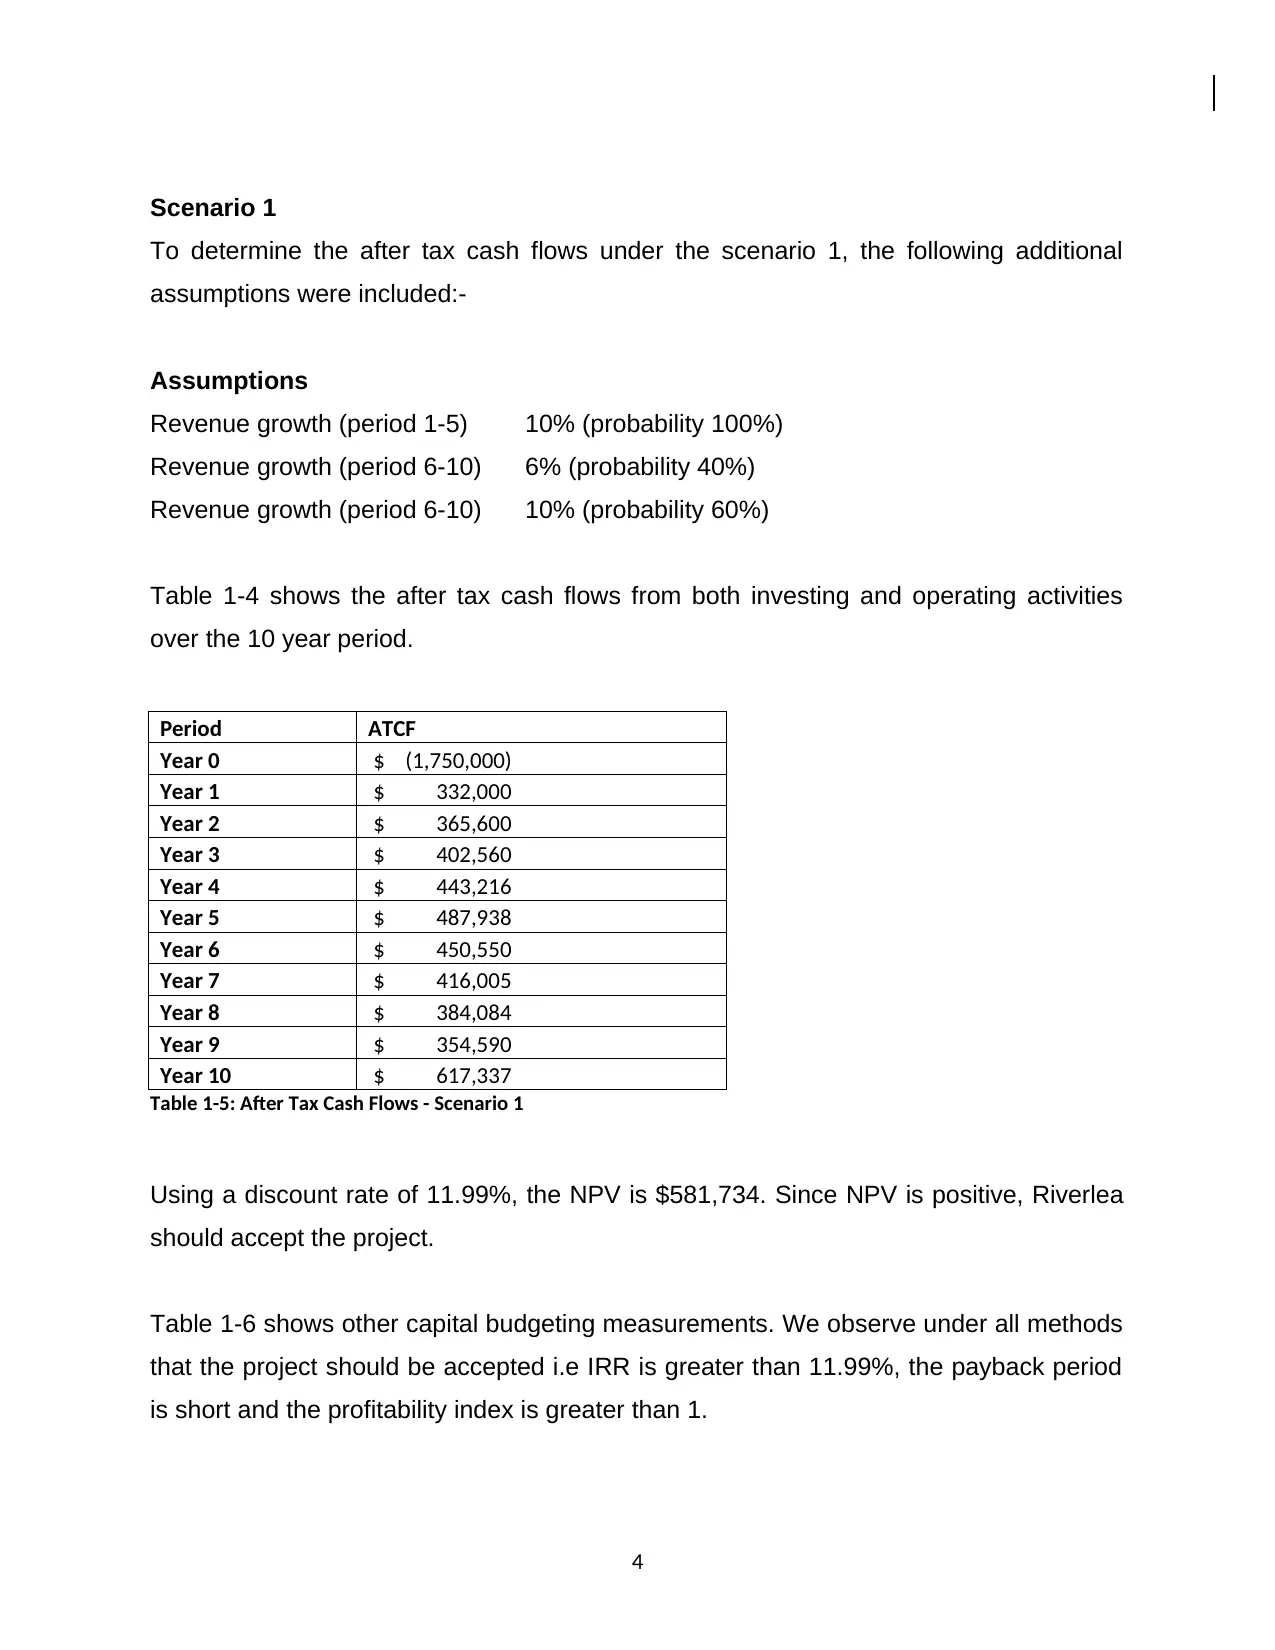
Scenario 1
To determine the after tax cash flows under the scenario 1, the following additional
assumptions were included:-
Assumptions
Revenue growth (period 1-5) 10% (probability 100%)
Revenue growth (period 6-10) 6% (probability 40%)
Revenue growth (period 6-10) 10% (probability 60%)
Table 1-4 shows the after tax cash flows from both investing and operating activities
over the 10 year period.
Period ATCF
Year 0 $ (1,750,000)
Year 1 $ 332,000
Year 2 $ 365,600
Year 3 $ 402,560
Year 4 $ 443,216
Year 5 $ 487,938
Year 6 $ 450,550
Year 7 $ 416,005
Year 8 $ 384,084
Year 9 $ 354,590
Year 10 $ 617,337
Table 1-5: After Tax Cash Flows - Scenario 1
Using a discount rate of 11.99%, the NPV is $581,734. Since NPV is positive, Riverlea
should accept the project.
Table 1-6 shows other capital budgeting measurements. We observe under all methods
that the project should be accepted i.e IRR is greater than 11.99%, the payback period
is short and the profitability index is greater than 1.
4
⊘ This is a preview!⊘
Do you want full access?
Subscribe today to unlock all pages.
Trusted by 1+ million students worldwide
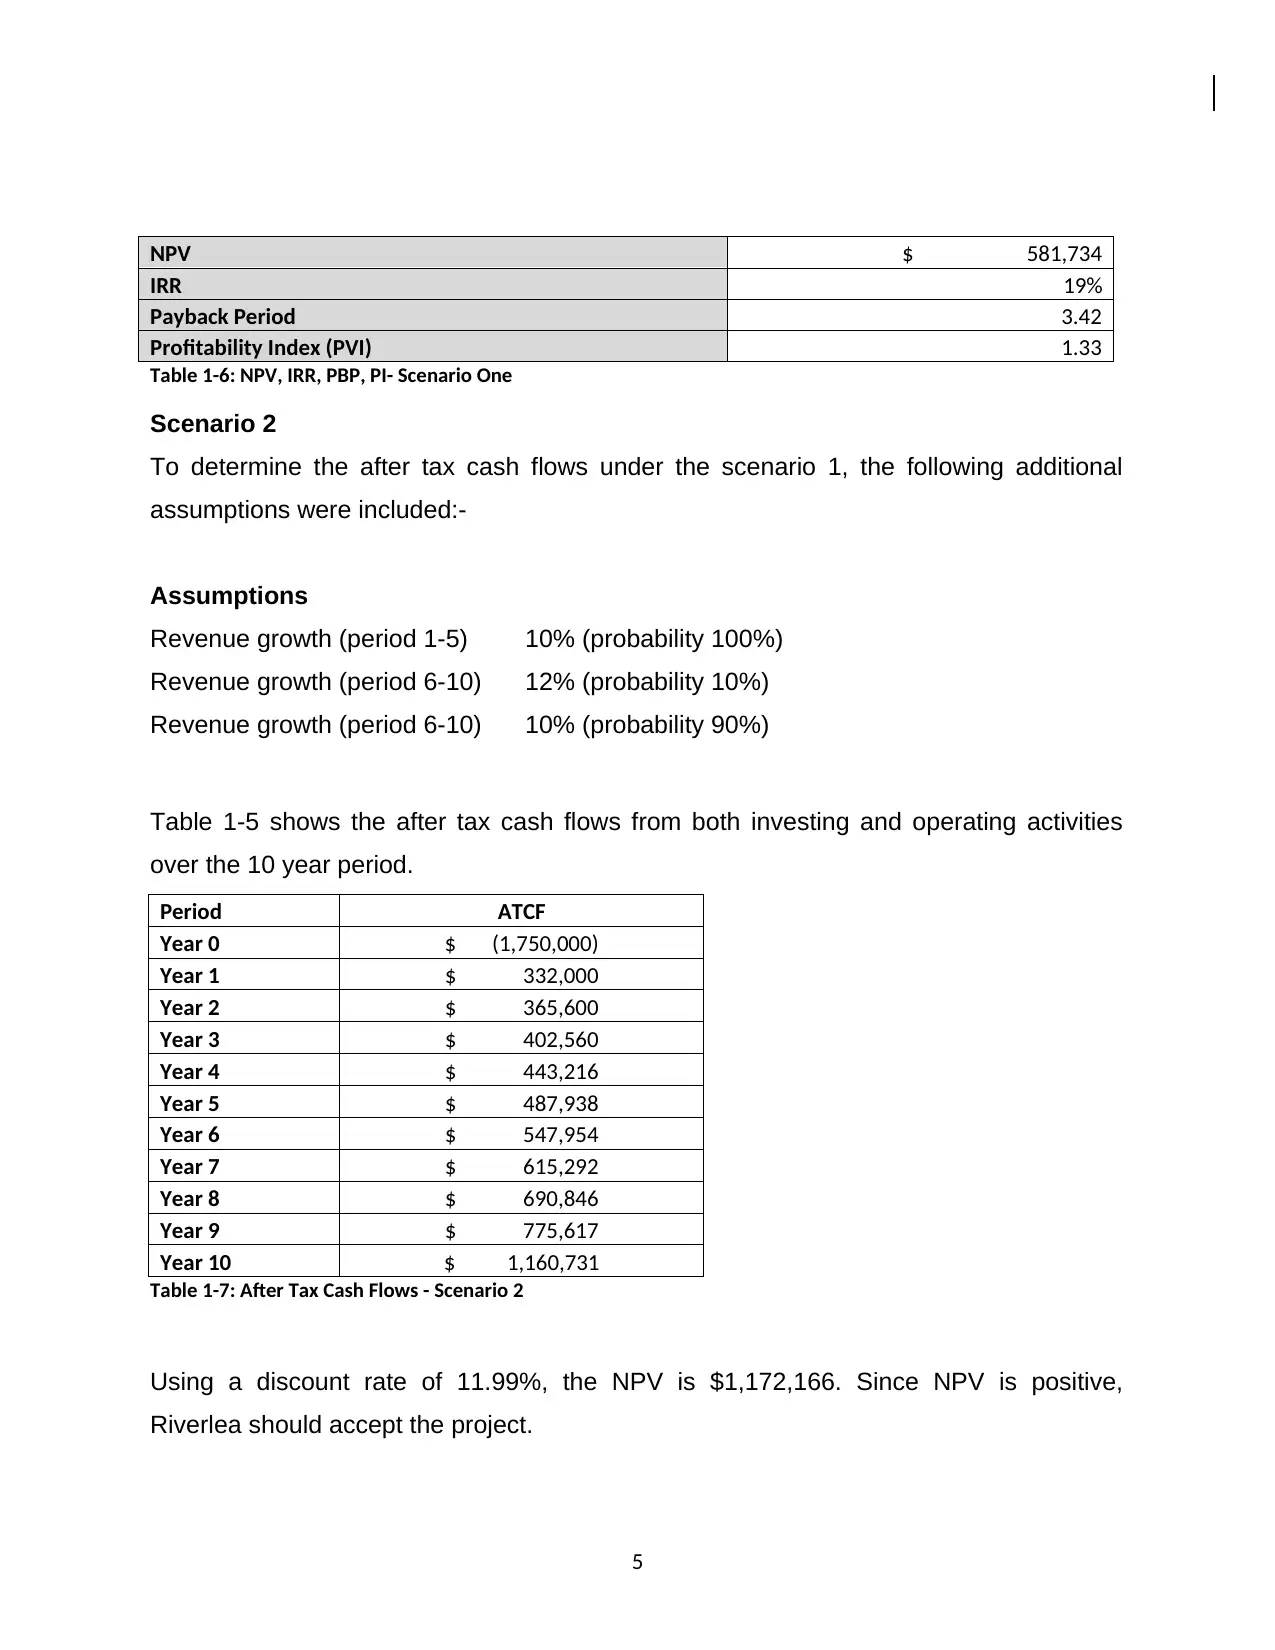
NPV $ 581,734
IRR 19%
Payback Period 3.42
Profitability Index (PVI) 1.33
Table 1-6: NPV, IRR, PBP, PI- Scenario One
Scenario 2
To determine the after tax cash flows under the scenario 1, the following additional
assumptions were included:-
Assumptions
Revenue growth (period 1-5) 10% (probability 100%)
Revenue growth (period 6-10) 12% (probability 10%)
Revenue growth (period 6-10) 10% (probability 90%)
Table 1-5 shows the after tax cash flows from both investing and operating activities
over the 10 year period.
Period ATCF
Year 0 $ (1,750,000)
Year 1 $ 332,000
Year 2 $ 365,600
Year 3 $ 402,560
Year 4 $ 443,216
Year 5 $ 487,938
Year 6 $ 547,954
Year 7 $ 615,292
Year 8 $ 690,846
Year 9 $ 775,617
Year 10 $ 1,160,731
Table 1-7: After Tax Cash Flows - Scenario 2
Using a discount rate of 11.99%, the NPV is $1,172,166. Since NPV is positive,
Riverlea should accept the project.
5
Paraphrase This Document
Need a fresh take? Get an instant paraphrase of this document with our AI Paraphraser
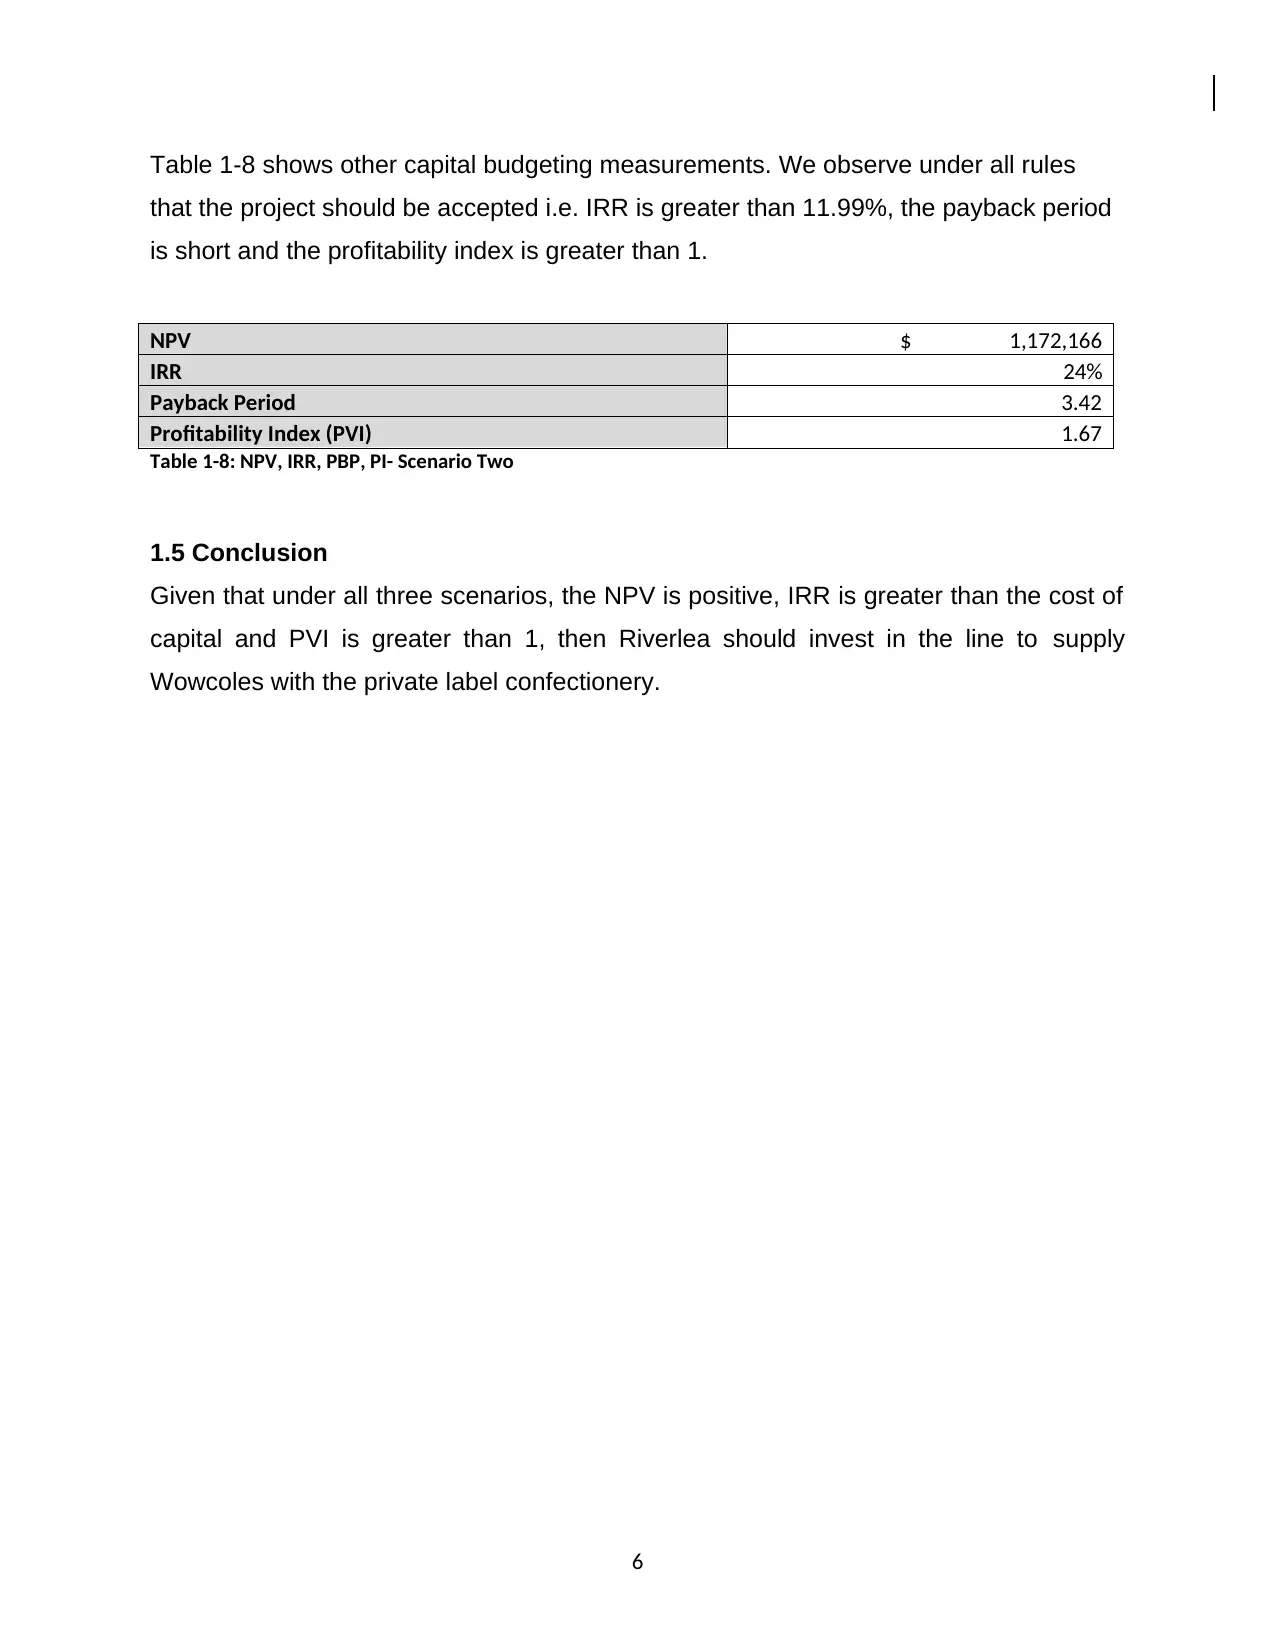
Table 1-8 shows other capital budgeting measurements. We observe under all rules
that the project should be accepted i.e. IRR is greater than 11.99%, the payback period
is short and the profitability index is greater than 1.
NPV $ 1,172,166
IRR 24%
Payback Period 3.42
Profitability Index (PVI) 1.67
Table 1-8: NPV, IRR, PBP, PI- Scenario Two
1.5 Conclusion
Given that under all three scenarios, the NPV is positive, IRR is greater than the cost of
capital and PVI is greater than 1, then Riverlea should invest in the line to supply
Wowcoles with the private label confectionery.
6
CHAPTER 2: SECTION TWO- SEMI-STRONG FORM MARKET EFFICIENCY
2.1 Introduction
In this section we test whether Riverlea’s stock price changes before, during and after
the announcement of its new project, is consistent with semi-strong form market
hypothesis.
2.2 Semi-Strong Form Market Hypothesis
The semi strong-form hypothesis states that all publicly available information regarding
the prospects of a firm must be reflected in its share price (Investopedia, 2017).
Examples of public information includes, management quality, fundamental data on a
product line, forecasts on earnings, accounting standards, composition of its balance
sheet and past prices. If an investor has this information, then it should be reflected in
stock prices (Vialar, 2009).
In other words, according to the semi strong-form, it is not fruitful trying to make any
prediction using public information i.e. information that is publicly available (Shleifer &
Vishny, 1997). Examples of public information include analyst’s report, news one can
read in the newspaper, business magazine etc.
2.3 Test for Semi-Strong Form Market Hypothesis
When testing whether a market is efficient with respect to publicly available information,
researchers often choose an information event and investigate if the market responded
quickly and sensibly to the information. This test is the basis for an “event study” (Fama,
1970).
Riverlea Price Movement Before and After Announcement
The event study under investigation is Riverlea’s decision to supply the private label
confectionary to Wowcoles. We observe in figure 2-1 the Riverlea share price rose from
$2.16 (Day -1) to $4.35 on the day of the announcement of the product line. The reason
for increase in price is it is expected that the new supply private label will increase the
value of Riverlea and thus create value for shareholder’s.
7
⊘ This is a preview!⊘
Do you want full access?
Subscribe today to unlock all pages.
Trusted by 1+ million students worldwide
1 out of 16
Related Documents


Your All-in-One AI-Powered Toolkit for Academic Success.
+13062052269
info@desklib.com
Available 24*7 on WhatsApp / Email
![[object Object]](/_next/static/media/star-bottom.7253800d.svg)
Unlock your academic potential
Copyright © 2020–2025 A2Z Services. All Rights Reserved. Developed and managed by ZUCOL.