Rate of Reaction of Sodium Thiosulphate and Hydrochloric Acid
Added on 2023-01-18
11 Pages2167 Words28 Views
Access to HE Diploma Unit Title: Energetics, Kinetics and Redox Assignment
Student name
Course name
Professor name
University name
Sate name
Date
Student name
Course name
Professor name
University name
Sate name
Date
Question 1
Report on Rate of Reaction of Sodium Thiosulphate and Hydrochloric Acid.
Introduction
This demonstration was aimed at investigating the effects of sodium thiosulphate
concentration on a reaction involving 2M hydrochloric acid and sodium thiosulphate. The
products of this reaction include sulfur and being opaque, the reaction time can be predicted by
measuring the time it takes the produced Sulphur to make a cross made on a graph paper
disappear. The obtained results will be graphically analyzed with an objective of evaluating the
reaction’s order. The order of the reaction obtained provides a mathematical relationship
between the reactant’s concentration and reaction rate.
Background theory
Reactant concentration plays a major role in reaction rate. Increasing reactant’s
concentration consequently raises the number of reacting molecules (Leffler & Grunwald, 2013).
This has an effect of increasing the number collisions which increases the rate of reaction.
Reaction between hydrochloric acid and sodium thiosulphate
The impact of concentration on reaction rate is easily studied by examining a reaction
between sodium thiosulfate and HCl. The two reagents react to produce SO2, S and water. SO2
produced is soluble in water. Sulfur on the other hand is insoluble. It forms a precipitate made of
pale yellow or white colloid which forms an opaque vision (Covington, 2012). This property
makes it possible to study reaction rates by considering how long it takes to form amount of
sulfur that block the possibility of seeing the cross.
Aim
This experiment is aimed at finding the rate equation for a reaction between sodium thiosulphate
and hydrochloric acid.
Methodology
Requirements
0.4 mol/dm3 sodium thiosulphate Na2SO3 (aq)
2.0 mol/dm3 hydrochloric acid HCl(aq)
De-ionized water
Conical flask
Graduated pipette
Stop clock
Graph paper
Procedure
A cross was marked on a graph paper with a waterproof pen. A 250cm3 conical flask was
erected over the cross. Using a labelled burette, thiosulphate and de-ionized water was added to
the flask using quantities in the table below. The acid was then added to the flask using 10cm3
graduated pipette. Stop clock was started at the same time while the flask was given a swirl to
ensure mixing. The duration it takes the cross to disappear was recorded by looking down at the
cross. The flask was then cleansed and the experiment repeated as shown in the result section.
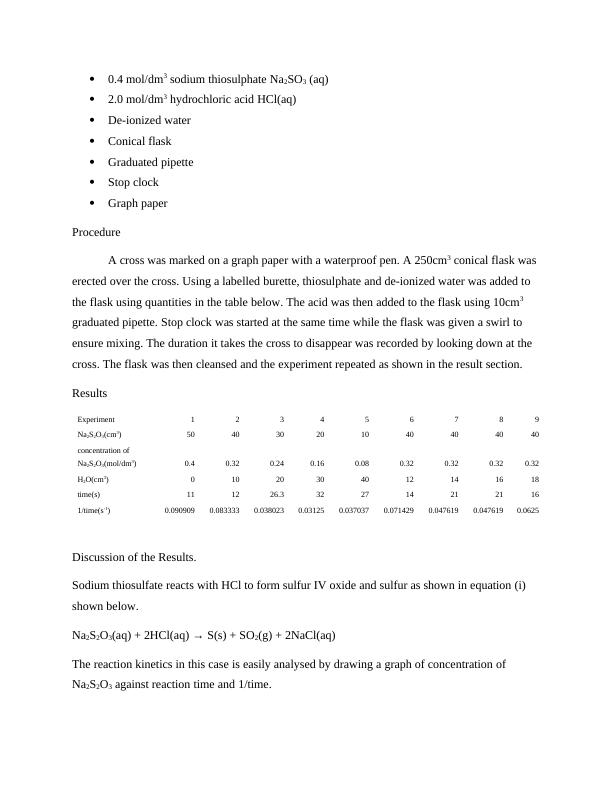
Results
Experiment 1 2 3 4 5 6 7 8 9
Na2S2O3(cm3) 50 40 30 20 10 40 40 40 40
concentration of
Na2S2O3(mol/dm3) 0.4 0.32 0.24 0.16 0.08 0.32 0.32 0.32 0.32
H2O(cm3) 0 10 20 30 40 12 14 16 18
time(s) 11 12 26.3 32 27 14 21 21 16
1/time(s-1) 0.090909 0.083333 0.038023 0.03125 0.037037 0.071429 0.047619 0.047619 0.0625
Discussion of the Results.
Sodium thiosulfate reacts with HCl to form sulfur IV oxide and sulfur as shown in equation (i)
shown below.
Na2S2O3(aq) + 2HCl(aq) → S(s) + SO2(g) + 2NaCl(aq)
The reaction kinetics in this case is easily analysed by drawing a graph of concentration of
Na2S2O3 against reaction time and 1/time.
2.0 mol/dm3 hydrochloric acid HCl(aq)
De-ionized water
Conical flask
Graduated pipette
Stop clock
Graph paper
Procedure
A cross was marked on a graph paper with a waterproof pen. A 250cm3 conical flask was
erected over the cross. Using a labelled burette, thiosulphate and de-ionized water was added to
the flask using quantities in the table below. The acid was then added to the flask using 10cm3
graduated pipette. Stop clock was started at the same time while the flask was given a swirl to
ensure mixing. The duration it takes the cross to disappear was recorded by looking down at the
cross. The flask was then cleansed and the experiment repeated as shown in the result section.
Results
Experiment 1 2 3 4 5 6 7 8 9
Na2S2O3(cm3) 50 40 30 20 10 40 40 40 40
concentration of
Na2S2O3(mol/dm3) 0.4 0.32 0.24 0.16 0.08 0.32 0.32 0.32 0.32
H2O(cm3) 0 10 20 30 40 12 14 16 18
time(s) 11 12 26.3 32 27 14 21 21 16
1/time(s-1) 0.090909 0.083333 0.038023 0.03125 0.037037 0.071429 0.047619 0.047619 0.0625
Discussion of the Results.
Sodium thiosulfate reacts with HCl to form sulfur IV oxide and sulfur as shown in equation (i)
shown below.
Na2S2O3(aq) + 2HCl(aq) → S(s) + SO2(g) + 2NaCl(aq)
The reaction kinetics in this case is easily analysed by drawing a graph of concentration of
Na2S2O3 against reaction time and 1/time.
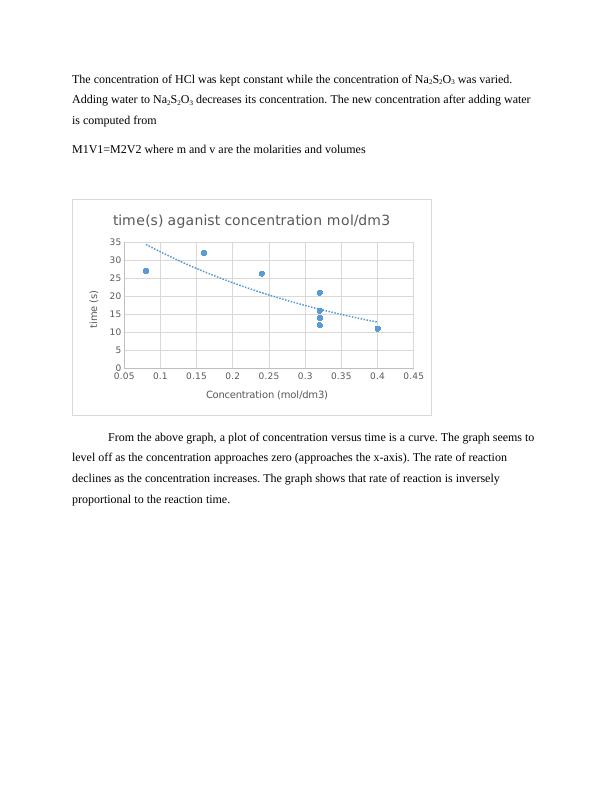
The concentration of HCl was kept constant while the concentration of Na2S2O3 was varied.
Adding water to Na2S2O3 decreases its concentration. The new concentration after adding water
is computed from
M1V1=M2V2 where m and v are the molarities and volumes
0.05 0.1 0.15 0.2 0.25 0.3 0.35 0.4 0.45
0
5
10
15
20
25
30
35
time(s) aganist concentration mol/dm3
Concentration (mol/dm3)
time (s)
From the above graph, a plot of concentration versus time is a curve. The graph seems to
level off as the concentration approaches zero (approaches the x-axis). The rate of reaction
declines as the concentration increases. The graph shows that rate of reaction is inversely
proportional to the reaction time.
End of preview
Want to access all the pages? Upload your documents or become a member.
Related Documents
Kinetics and Chemical Equilibriumlg...
|8
|972
|186
Effect of Hypo Solution Concentration on Reaction Rate with Hydrochloric Acidlg...
|8
|1429
|259
Comparison of SN1 and SN2 Mechanismslg...
|5
|1232
|75
Experimental Design of Rates of Reactionslg...
|4
|877
|131
Lab Report on Neutralization Reaction 2022lg...
|7
|1698
|24