Access to Higher Education Chemistry: Chemical Spectroscopy Assignment
VerifiedAdded on 2022/08/17
|17
|3413
|13
Homework Assignment
AI Summary
This chemistry assignment focuses on chemical spectroscopy, covering mass spectrometry, infrared (IR) spectroscopy, and nuclear magnetic resonance (NMR) spectroscopy. The assignment tasks include interpreting mass spectra to propose organic molecule structures, understanding the principles of time-of-flight mass spectrometers, and identifying fragment ions. It also involves analyzing IR spectra to identify functional groups and distinguish between different organic molecules. Furthermore, the assignment requires the interpretation of 1H NMR spectra to deduce molecular structures, including identifying chemical shifts, splitting patterns, and integration factors. Finally, the assignment culminates in proposing structural formulas for unknown organic compounds using data from a combination of spectroscopic techniques, including mass spec, IR, and NMR. The solutions provided demonstrate the ability to analyze spectral data and deduce the structures of organic molecules.
A Assignment Details
Student Name Centre
Tutor Name Unit Title: CHEMICAL SPECTROSCOPY
Subject: CHEMISTRY Unit Code: 1384064
Assignment Title: CHEMICAL
SPECTROSCOPY Indicative Word Count n/a
Assignments for this Unit 1 of 1
This unit is graded
1,2,3,5,7 No. of Credits 3 Level 3
Date set Date due Date submitted
If a resubmission Date due Date submitted
Student Declaration
I understand that copying / taking ideas from other sources (e.g. reference books, journals, internet, and
tutor handouts) without acknowledging them is plagiarism. I confirm that:
This assignment is all my own work.
All contributions taken from other reading and research have been referenced accurately.
Any direct quotations taken from other reading and research have been acknowledged and attributed
accurately.
I have attached a bibliography listing all sources used in producing this assignment.
I have added the word count below. NB unless specified otherwise, the word count indicated above is
acceptable.
I have read and understood the Ascentis document entitled ‘Policies and Procedures for Dealing with
Malpractice’ provided by the tutor and understand the consequences of non-compliance with this
document.
To be completed by student on submission and in confirmation of above declaration
Student signature
Word count
To be completed by tutor
Tutor signature
Unit grade award Word count confirmed as accurate Yes/No
To be completed by the IM (Internal Moderator) if work has been internally moderated
IM name (printed) IM signature
Date internally moderated
Validated from 1st August 2019 to 31st July 2024 V1 Page 1 of 17 ©Ascentis
Access to Higher Education
Chemistry
Assignment Brief
Paraphrase This Document
Need a fresh take? Get an instant paraphrase of this document with our AI Paraphraser
B The Assignment Brief
Assignment Brief
You will need a chemistry data sheet or access to a book of data to complete this assignment
LO1 – Understand molecular structure through interpretation of low resolution mass spectra.
AC 1.1 Outline the functions of the main parts of a ‘time of flight’ mass spectrometer.
AC 1.2 Interpret mass spectra to propose the structure of organic molecules.
1. Use a labelled diagram to explain the principles of a simple time of flight mass spectrometer.
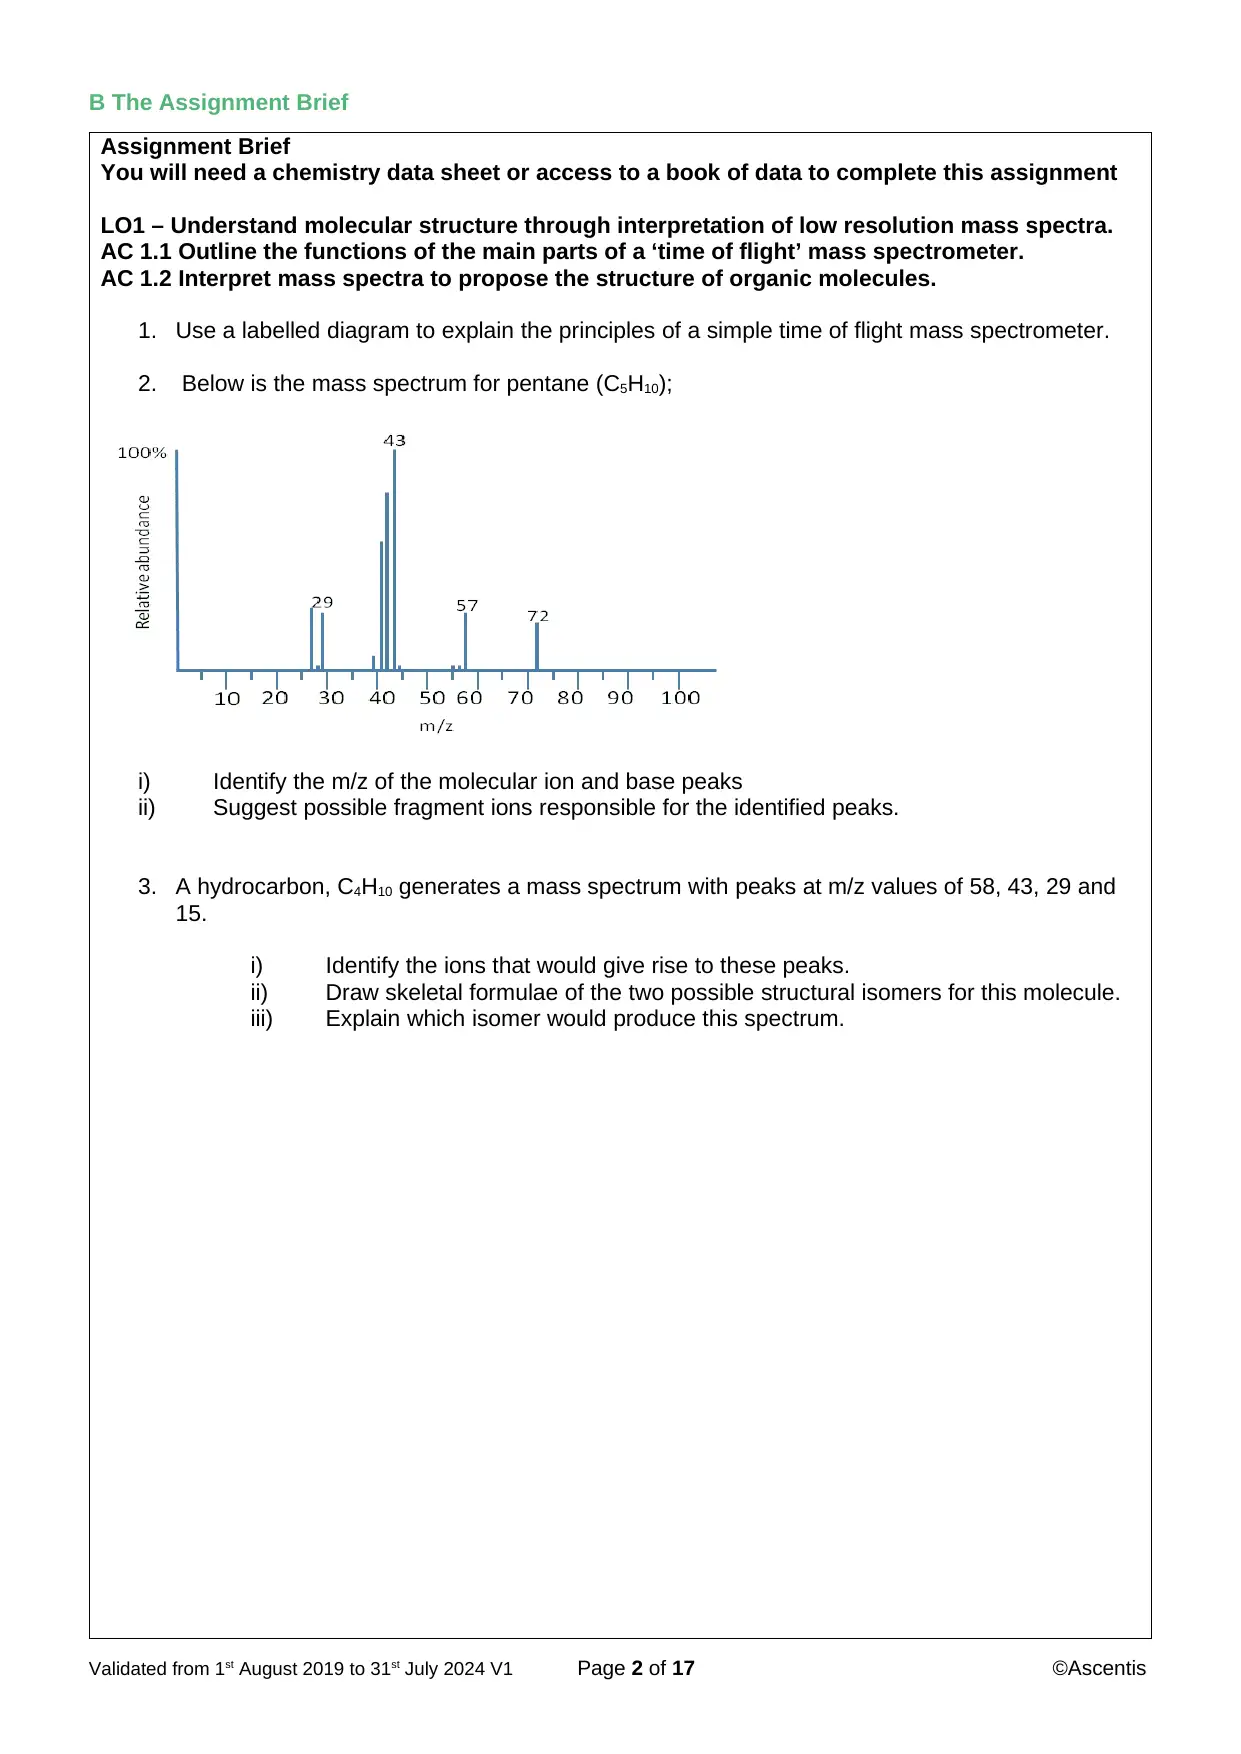
2. Below is the mass spectrum for pentane (C5H10);
i) Identify the m/z of the molecular ion and base peaks
ii) Suggest possible fragment ions responsible for the identified peaks.
3. A hydrocarbon, C4H10 generates a mass spectrum with peaks at m/z values of 58, 43, 29 and
15.
i) Identify the ions that would give rise to these peaks.
ii) Draw skeletal formulae of the two possible structural isomers for this molecule.
iii) Explain which isomer would produce this spectrum.
Validated from 1st August 2019 to 31st July 2024 V1 Page 2 of 17 ©Ascentis
Assignment Brief
You will need a chemistry data sheet or access to a book of data to complete this assignment
LO1 – Understand molecular structure through interpretation of low resolution mass spectra.
AC 1.1 Outline the functions of the main parts of a ‘time of flight’ mass spectrometer.
AC 1.2 Interpret mass spectra to propose the structure of organic molecules.
1. Use a labelled diagram to explain the principles of a simple time of flight mass spectrometer.
2. Below is the mass spectrum for pentane (C5H10);
i) Identify the m/z of the molecular ion and base peaks
ii) Suggest possible fragment ions responsible for the identified peaks.
3. A hydrocarbon, C4H10 generates a mass spectrum with peaks at m/z values of 58, 43, 29 and
15.
i) Identify the ions that would give rise to these peaks.
ii) Draw skeletal formulae of the two possible structural isomers for this molecule.
iii) Explain which isomer would produce this spectrum.
Validated from 1st August 2019 to 31st July 2024 V1 Page 2 of 17 ©Ascentis
LO2 – Determine the features of molecular structure through interpretation of infra-red
(IR) spectra.
AC 2.1 Outline the principles behind IR spectroscopy
AC 2.2 Interpret IR spectra to identify the functional groups present in organic
molecules.
1. Summarise the principles behind infrared spectroscopy.
The infra-red region of the spectrum has radiations with energy enough to stretch or bend
bonds in a molecule. In the IR region, each functional group of molecules has a specific range
of characteristic absorption frequencies. Infra-red absorption spectroscopy involves detection
of the frequencies of IR light absorbed by a given molecule to determine the basic functional
groups of molecules (Meislich 2014).
Atoms in a molecule are subject to different vibrations (stretching or bending) since they are
not fixed in the molecular structure. During IR absorption, a net change is caused in the dipole
moment of the molecule due to the vibrations or rotations within the molecules of compounds
with polar bonds. The IR radiation is absorbed when the radiation’s frequency and the
vibrational frequency of the molecules matches thus causing a change in amplitudes of the
vibrations. (Jones, Mulloy and Thomas 2013).The concept of absorption of specific
frequencies of light by molecules is used to deduce the corresponding molecular structure
from the molecule’s characteristic absorption. The absorbed frequencies of the infrared light
correspond to the resonant frequencies of vibration of the molecular bonds (Meislich 2014).
The resonant frequencies relate to the molecular bonds’ strength and the molecular atomic
mass and thus absorbed frequencies can be associated with a specific type of bond and
functional group.
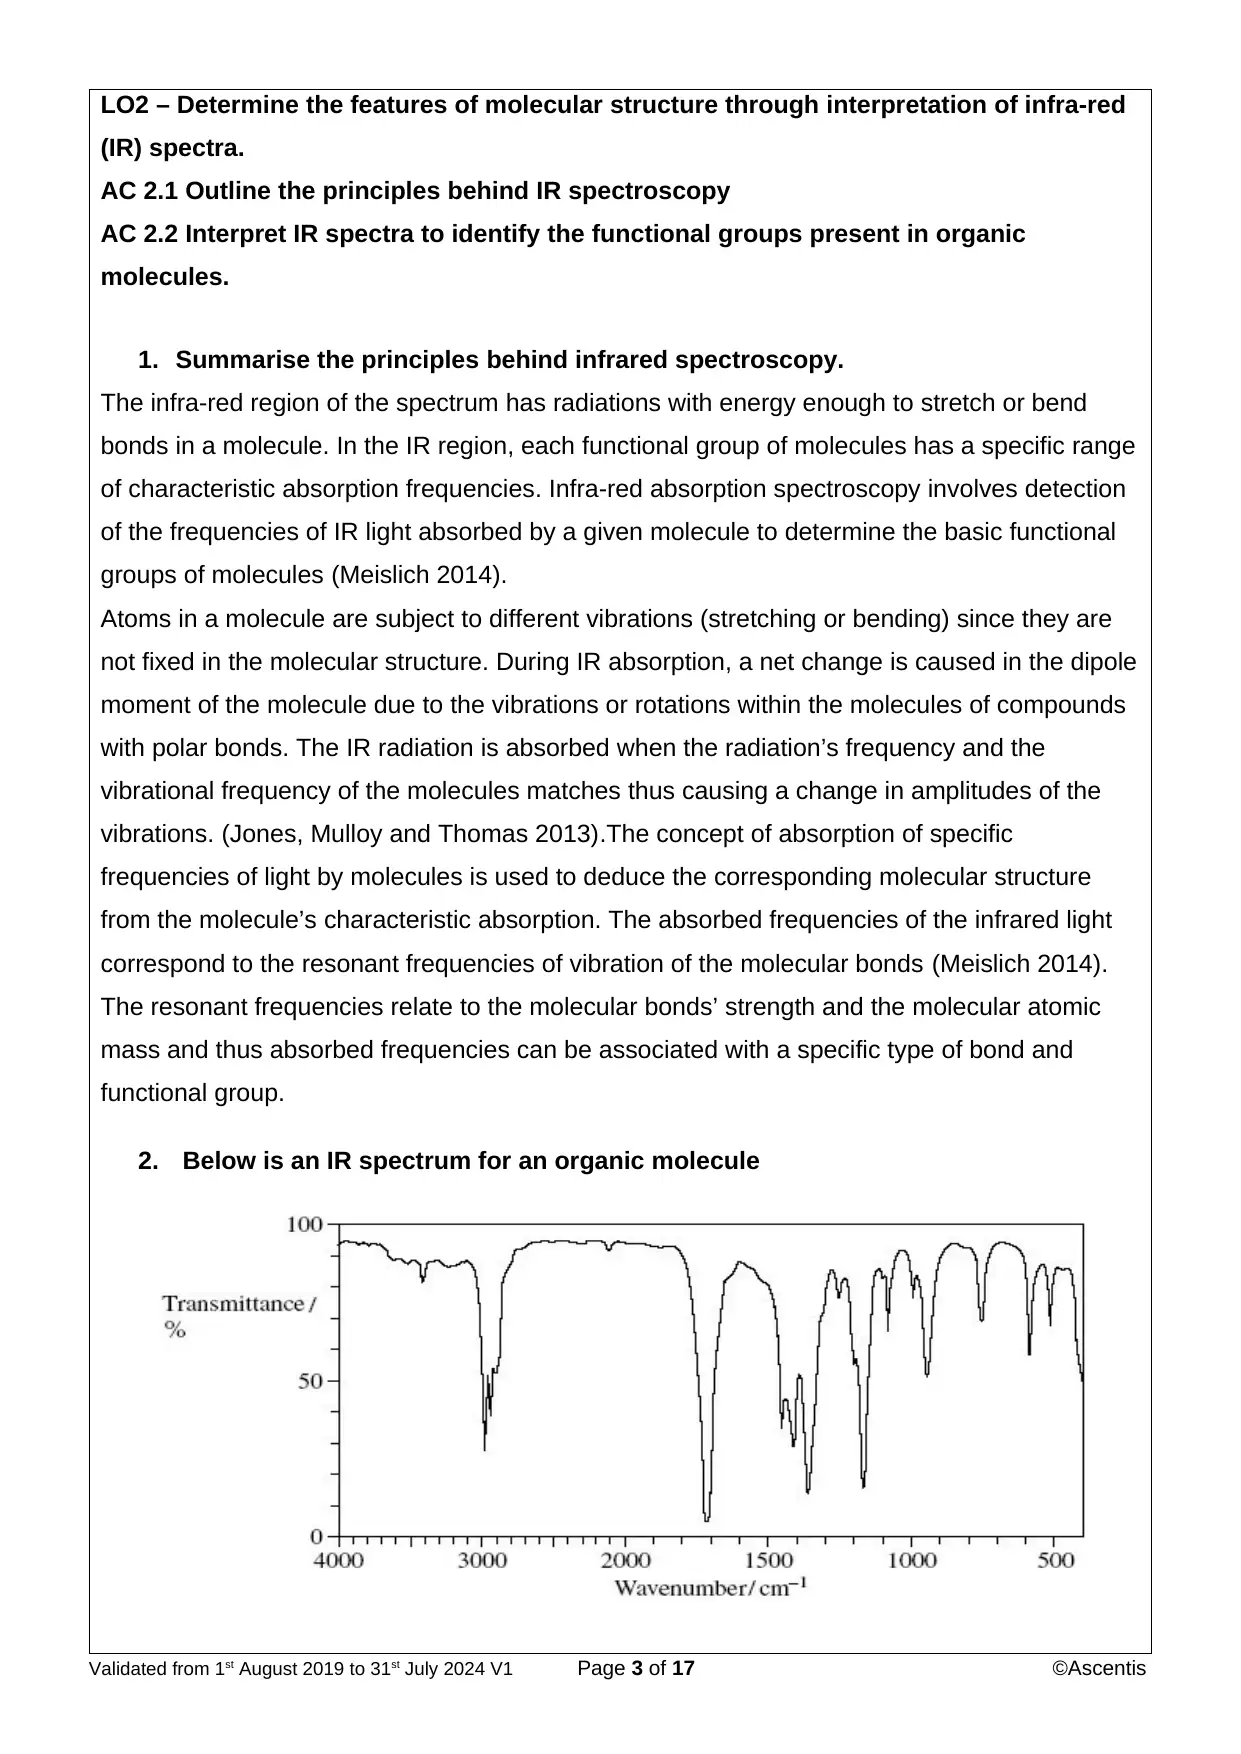
2. Below is an IR spectrum for an organic molecule
Validated from 1st August 2019 to 31st July 2024 V1 Page 3 of 17 ©Ascentis
(IR) spectra.
AC 2.1 Outline the principles behind IR spectroscopy
AC 2.2 Interpret IR spectra to identify the functional groups present in organic
molecules.
1. Summarise the principles behind infrared spectroscopy.
The infra-red region of the spectrum has radiations with energy enough to stretch or bend
bonds in a molecule. In the IR region, each functional group of molecules has a specific range
of characteristic absorption frequencies. Infra-red absorption spectroscopy involves detection
of the frequencies of IR light absorbed by a given molecule to determine the basic functional
groups of molecules (Meislich 2014).
Atoms in a molecule are subject to different vibrations (stretching or bending) since they are
not fixed in the molecular structure. During IR absorption, a net change is caused in the dipole
moment of the molecule due to the vibrations or rotations within the molecules of compounds
with polar bonds. The IR radiation is absorbed when the radiation’s frequency and the
vibrational frequency of the molecules matches thus causing a change in amplitudes of the
vibrations. (Jones, Mulloy and Thomas 2013).The concept of absorption of specific
frequencies of light by molecules is used to deduce the corresponding molecular structure
from the molecule’s characteristic absorption. The absorbed frequencies of the infrared light
correspond to the resonant frequencies of vibration of the molecular bonds (Meislich 2014).
The resonant frequencies relate to the molecular bonds’ strength and the molecular atomic
mass and thus absorbed frequencies can be associated with a specific type of bond and
functional group.
2. Below is an IR spectrum for an organic molecule
Validated from 1st August 2019 to 31st July 2024 V1 Page 3 of 17 ©Ascentis
⊘ This is a preview!⊘
Do you want full access?
Subscribe today to unlock all pages.
Trusted by 1+ million students worldwide
i) Explain why the region between 1000cm-1 and 1550cm-1 is described as the
‘fingerprint region’.
The region between 1000 cm-1 and 1550 cm-1 is known as the fingerprint region because it
consists of bands that are unique to each molecule. It is specific to each molecule and is full
of small peaks showing that IR absorption results from vibrations of the whole molecule
(Thornton 2009).
ii) Identify the functional groups that could be responsible for the peaks in the
non-fingerprint region of the spectrum.
a) alkyl C−H group
b) carboxylic acid C=O group
c) ketone C=O group
The non-fingerprint region of the IR spectrum generally has five zones namely Zone 1 (4000-
3200 cm-1), zone 2 (3200-2600 cm-1), zone 3 (2400 -2000 cm-1), zone 4 (1850-1650 cm-1) and
zone 5 (1680-1550 cm-1). Each zone has distinct peaks corresponding to the possibility of
presence different molecular functional groups.
Performing the five-zone analysis, the peaks found in zone 2 only occur after 3000 cm-1 hence
there are alkyl C−H functional group in this region.
The peak around 3000 cm-1 as well as the peak occurring at around 1720 cm-1 indicates that
carboxylic acid C=O group is present.
The strong peak occurring at around 1720 cm-1 indicates that ketone C=O group is present.
iii. Is this the spectrum of butan-2-ol or butanone? Explain your answer.
This is butanone spectrum since butanone has ketone group which are present.
Butan-2-ol has alcohol group which is absent (Academics.eckerd.edu 2020).
3. Explain how IR spectroscopy can be used to distinguish between alcohols,
carboxylic acids and esters.
The five-zone analysis of the non-fingerprint regions of IR spectrum is used (Meislich 2014).
Alcohol ( O=H ) groups demonstrate strong and broad peaks between 3650-3200 cm-1.
Carboxylic acid ( C=O) groups demonstrate broad peaks that are very strong between
3000-2500 cm-1 and also similar peaks between 1725- 1700 cm-1 (Ibarra, Valencia and Pérez
2015).
Ester group demonstrates strong peaks between 1750-1735 cm-1.
LO3- Use nuclear magnetic resonance (NMR) spectra to understand the features of molecular
structure.
AC 3.1 Outline the principles behind NMR spectroscopy.
Validated from 1st August 2019 to 31st July 2024 V1 Page 4 of 17 ©Ascentis
Paraphrase This Document
Need a fresh take? Get an instant paraphrase of this document with our AI Paraphraser
AC 3.2 Interpret proton/H+ NMR spectra to propose the structure of organic molecules.
1. Summarise the principles behind 1H NMR spectroscopy.
2. a) What does the number of peaks on a 1H NMR spectrum correspond to?
b) What does the area beneath the peaks on a 1H NMR spectrum correspond to?
c) What molecule is used a reference and given a chemical shift of 0?
d) What information does the chemical shift give about the hydrogen nuclei?
3. A compound with molecular formula C3H6O2 generated the following peaks in its 1H NMR
spectrum:
Chemical shift
(ppm)
Splitting Integration
factor
1.1 Triplet 3
2.2 Quartet 2
11.8 Singlet 1
Use the data in the table (and on your data sheet) to identify the molecule. Include the
displayed formula, link the H atom environments to the peaks on the spectrum and explain the
splitting patterns.
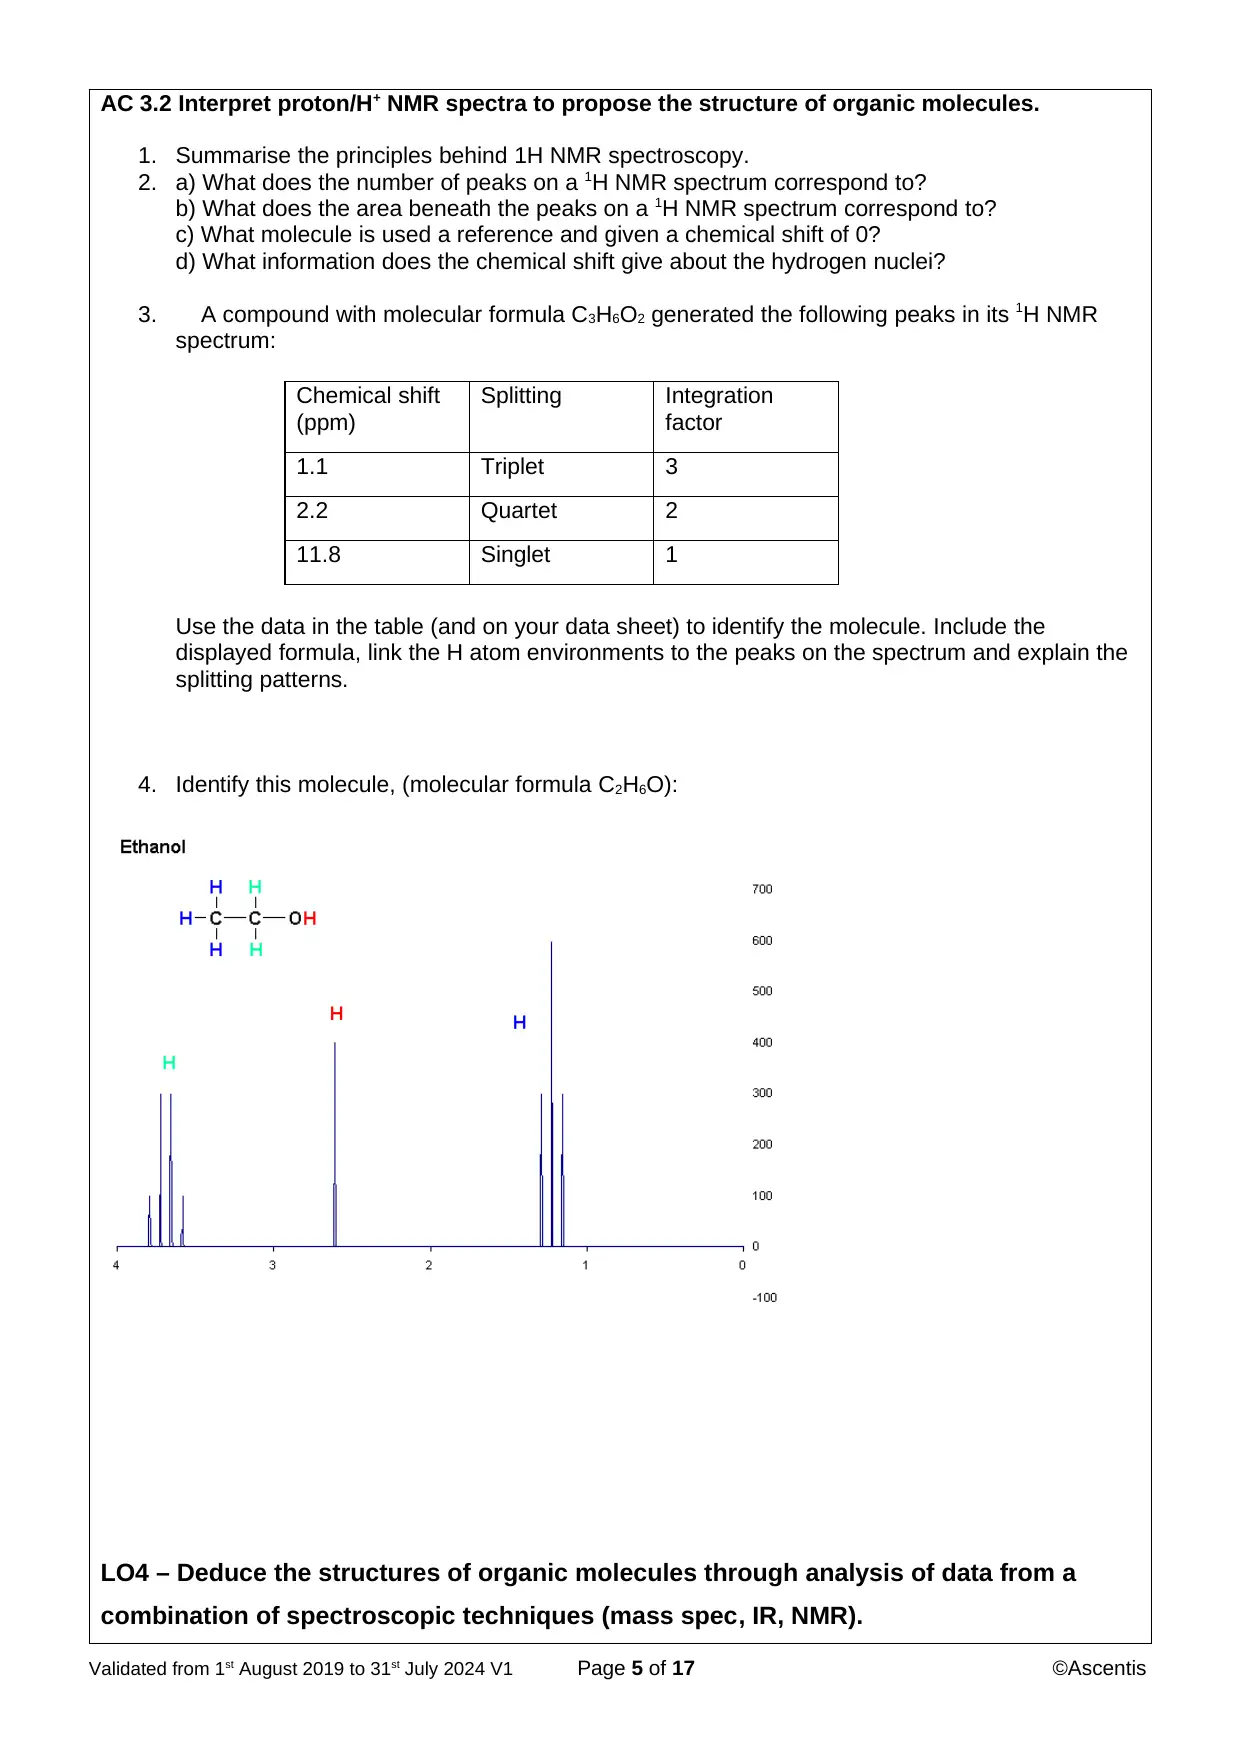
4. Identify this molecule, (molecular formula C2H6O):
LO4 – Deduce the structures of organic molecules through analysis of data from a
combination of spectroscopic techniques (mass spec, IR, NMR).
Validated from 1st August 2019 to 31st July 2024 V1 Page 5 of 17 ©Ascentis
1. Summarise the principles behind 1H NMR spectroscopy.
2. a) What does the number of peaks on a 1H NMR spectrum correspond to?
b) What does the area beneath the peaks on a 1H NMR spectrum correspond to?
c) What molecule is used a reference and given a chemical shift of 0?
d) What information does the chemical shift give about the hydrogen nuclei?
3. A compound with molecular formula C3H6O2 generated the following peaks in its 1H NMR
spectrum:
Chemical shift
(ppm)
Splitting Integration
factor
1.1 Triplet 3
2.2 Quartet 2
11.8 Singlet 1
Use the data in the table (and on your data sheet) to identify the molecule. Include the
displayed formula, link the H atom environments to the peaks on the spectrum and explain the
splitting patterns.
4. Identify this molecule, (molecular formula C2H6O):
LO4 – Deduce the structures of organic molecules through analysis of data from a
combination of spectroscopic techniques (mass spec, IR, NMR).
Validated from 1st August 2019 to 31st July 2024 V1 Page 5 of 17 ©Ascentis
AC 4.1 Propose the structure of an organic molecule through interpretation of data
from at least two types of spectral analysis.
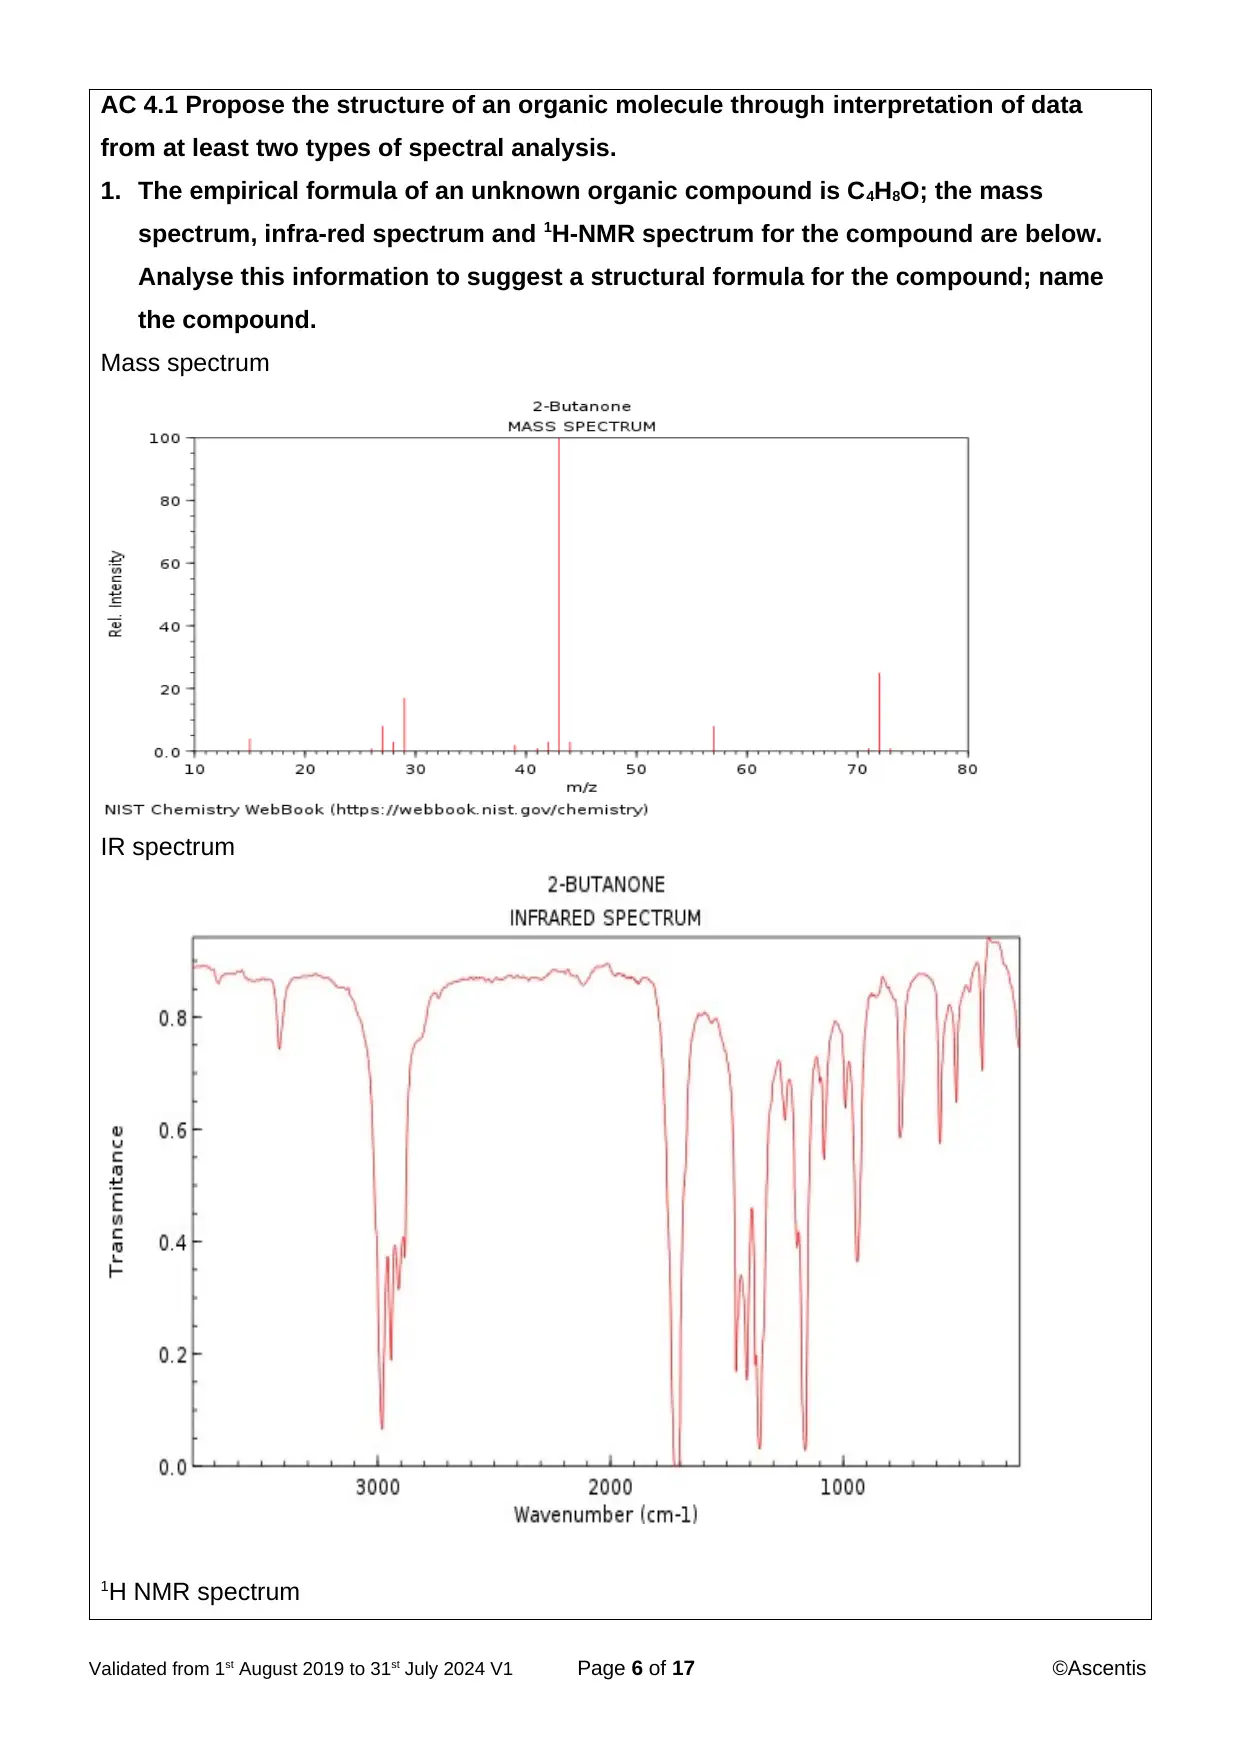
1. The empirical formula of an unknown organic compound is C4H8O; the mass
spectrum, infra-red spectrum and 1H-NMR spectrum for the compound are below.
Analyse this information to suggest a structural formula for the compound; name
the compound.
Mass spectrum
IR spectrum
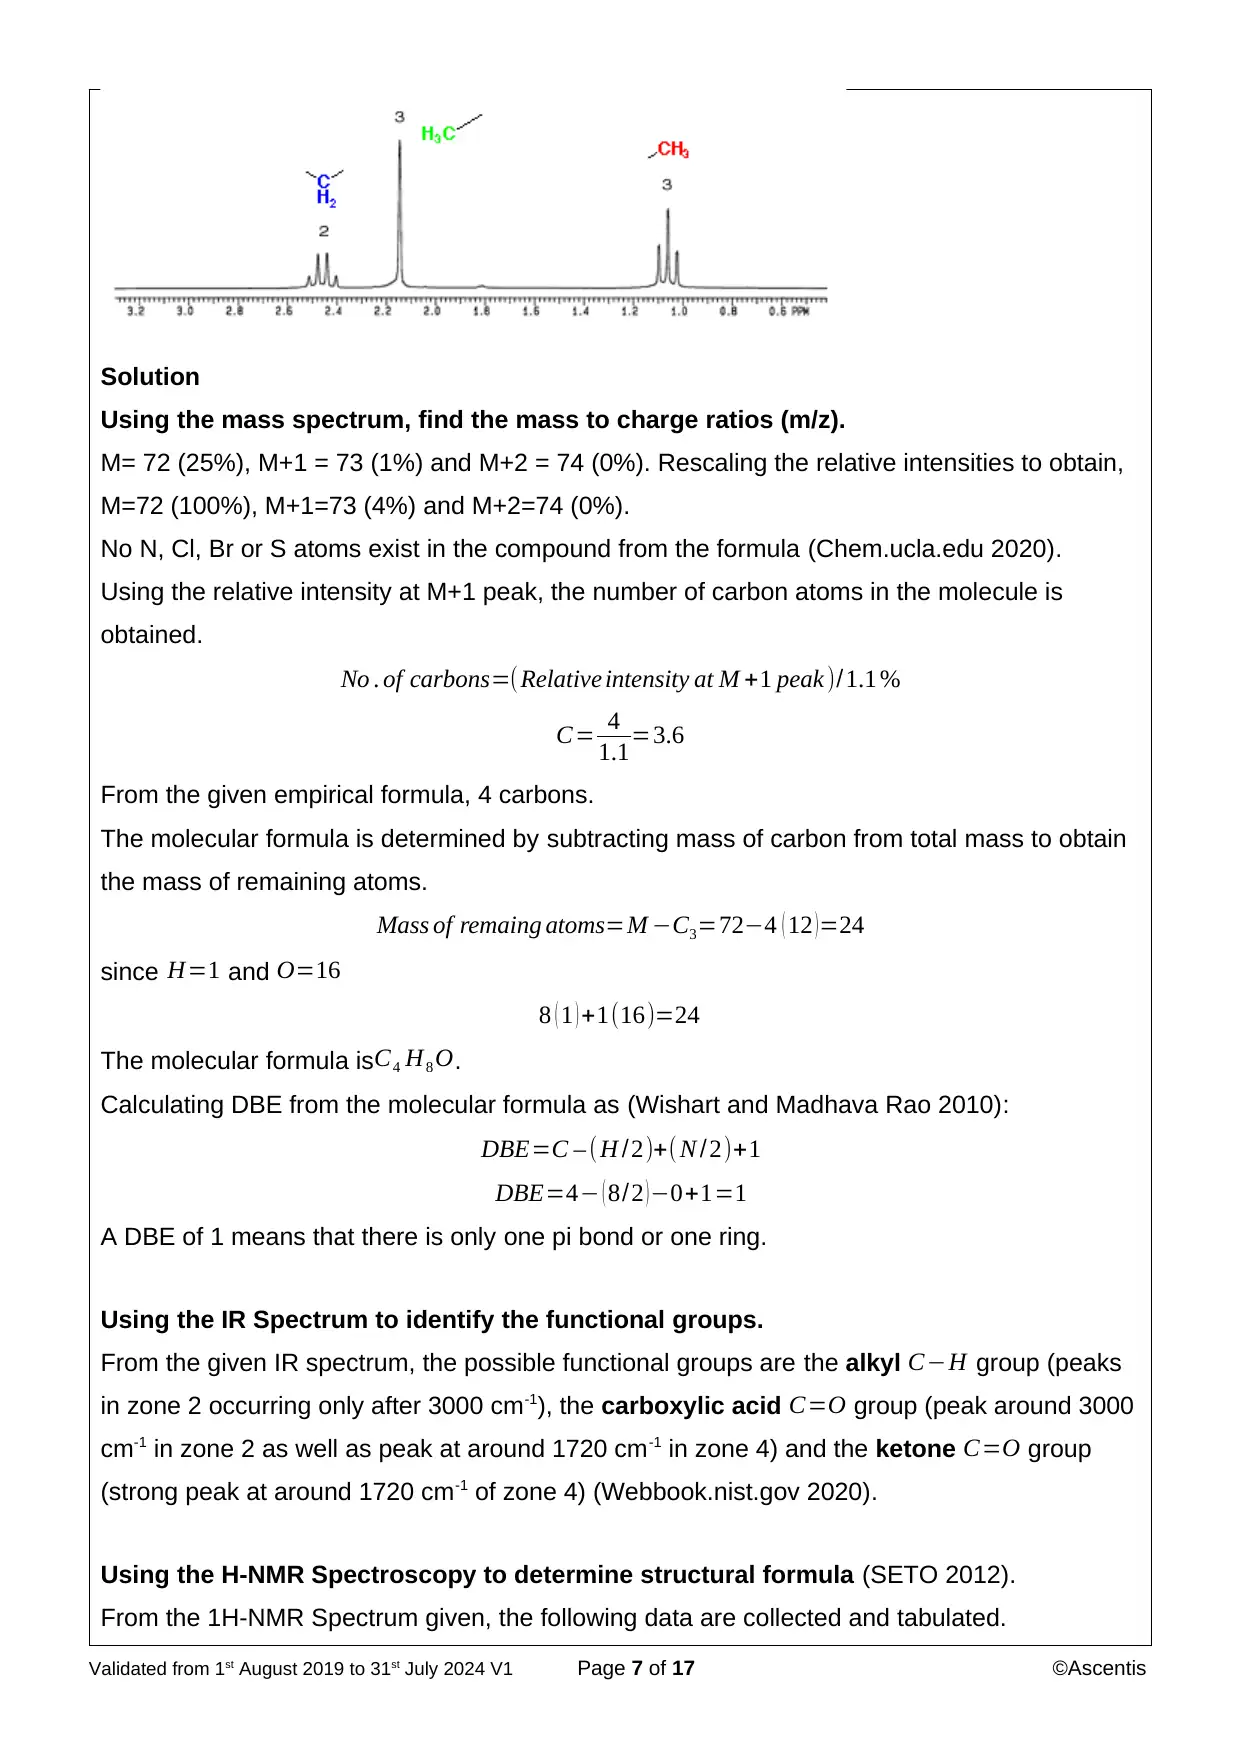
1H NMR spectrum
Validated from 1st August 2019 to 31st July 2024 V1 Page 6 of 17 ©Ascentis
from at least two types of spectral analysis.
1. The empirical formula of an unknown organic compound is C4H8O; the mass
spectrum, infra-red spectrum and 1H-NMR spectrum for the compound are below.
Analyse this information to suggest a structural formula for the compound; name
the compound.
Mass spectrum
IR spectrum
1H NMR spectrum
Validated from 1st August 2019 to 31st July 2024 V1 Page 6 of 17 ©Ascentis
⊘ This is a preview!⊘
Do you want full access?
Subscribe today to unlock all pages.
Trusted by 1+ million students worldwide
Solution
Using the mass spectrum, find the mass to charge ratios (m/z).
M= 72 (25%), M+1 = 73 (1%) and M+2 = 74 (0%). Rescaling the relative intensities to obtain,
M=72 (100%), M+1=73 (4%) and M+2=74 (0%).
No N, Cl, Br or S atoms exist in the compound from the formula (Chem.ucla.edu 2020).
Using the relative intensity at M+1 peak, the number of carbon atoms in the molecule is
obtained.
No . of carbons=(Relative intensity at M +1 peak )/1.1 %
C= 4
1.1=3.6
From the given empirical formula, 4 carbons.
The molecular formula is determined by subtracting mass of carbon from total mass to obtain
the mass of remaining atoms.
Mass of remaing atoms=M −C3=72−4 ( 12 )=24
since H=1 and O=16
8 ( 1 ) +1(16)=24
The molecular formula is C4 H8 O.
Calculating DBE from the molecular formula as (Wishart and Madhava Rao 2010):
DBE=C – (H /2)+( N /2)+1
DBE=4− ( 8/2 )−0+1=1
A DBE of 1 means that there is only one pi bond or one ring.
Using the IR Spectrum to identify the functional groups.
From the given IR spectrum, the possible functional groups are the alkyl C−H group (peaks
in zone 2 occurring only after 3000 cm-1), the carboxylic acid C=O group (peak around 3000
cm-1 in zone 2 as well as peak at around 1720 cm-1 in zone 4) and the ketone C=O group
(strong peak at around 1720 cm-1 of zone 4) (Webbook.nist.gov 2020).
Using the H-NMR Spectroscopy to determine structural formula (SETO 2012).
From the 1H-NMR Spectrum given, the following data are collected and tabulated.
Validated from 1st August 2019 to 31st July 2024 V1 Page 7 of 17 ©Ascentis
Paraphrase This Document
Need a fresh take? Get an instant paraphrase of this document with our AI Paraphraser
Splitting Integral Factor Number of
hydrogen
Implications
Quartet 2 2 CH 2 in CH 2 CH 3
Triplet 3 3 CH 3 in CH 3 CH 2
Singlet 3 3 CH 3 in CH 3 CH 2
Total number of integrals:
3+2+3=10
Therefore for each integral, there is one hydrogen atom (Thornton 2009).
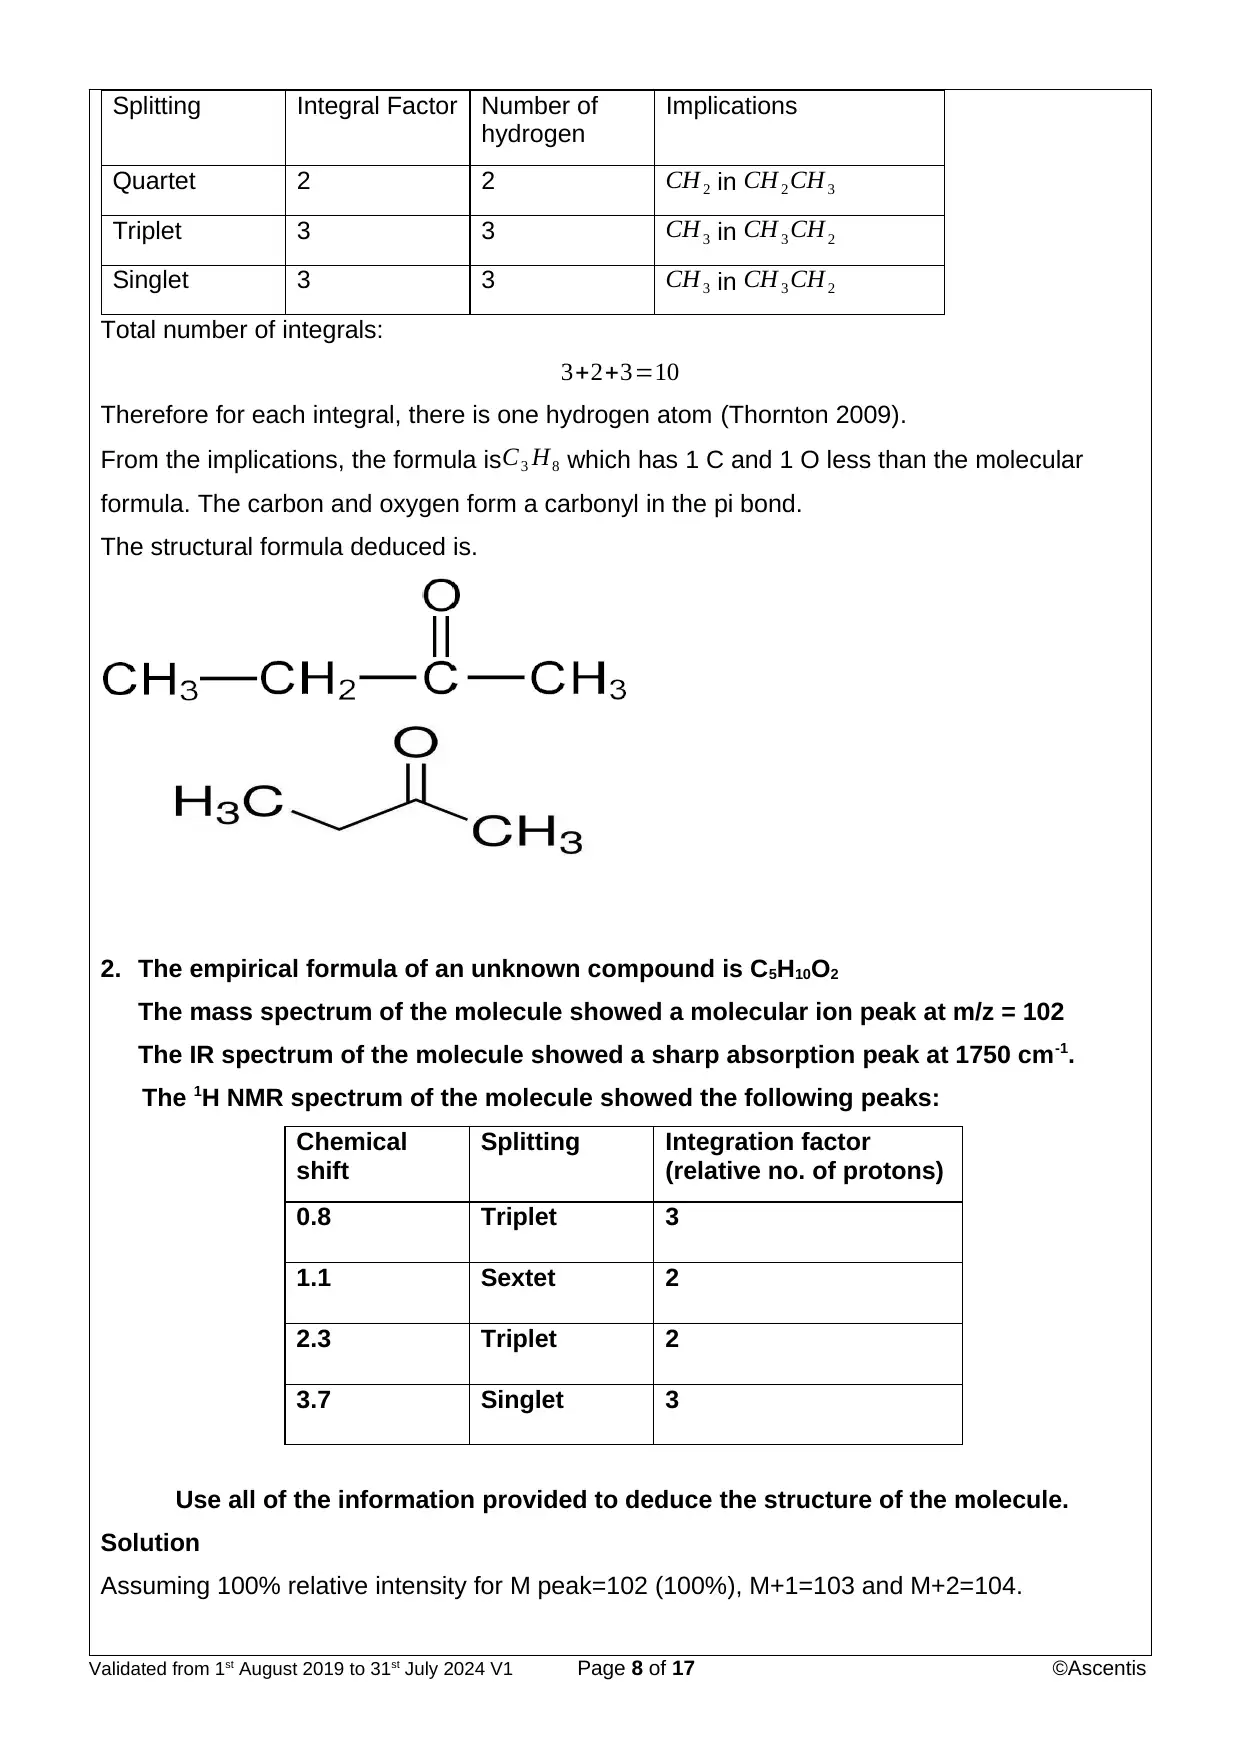
From the implications, the formula isC3 H8 which has 1 C and 1 O less than the molecular
formula. The carbon and oxygen form a carbonyl in the pi bond.
The structural formula deduced is.
2. The empirical formula of an unknown compound is C5H10O2
The mass spectrum of the molecule showed a molecular ion peak at m/z = 102
The IR spectrum of the molecule showed a sharp absorption peak at 1750 cm-1.
The 1H NMR spectrum of the molecule showed the following peaks:
Chemical
shift
Splitting Integration factor
(relative no. of protons)
0.8 Triplet 3
1.1 Sextet 2
2.3 Triplet 2
3.7 Singlet 3
Use all of the information provided to deduce the structure of the molecule.
Solution
Assuming 100% relative intensity for M peak=102 (100%), M+1=103 and M+2=104.
Validated from 1st August 2019 to 31st July 2024 V1 Page 8 of 17 ©Ascentis
hydrogen
Implications
Quartet 2 2 CH 2 in CH 2 CH 3
Triplet 3 3 CH 3 in CH 3 CH 2
Singlet 3 3 CH 3 in CH 3 CH 2
Total number of integrals:
3+2+3=10
Therefore for each integral, there is one hydrogen atom (Thornton 2009).
From the implications, the formula isC3 H8 which has 1 C and 1 O less than the molecular
formula. The carbon and oxygen form a carbonyl in the pi bond.
The structural formula deduced is.
2. The empirical formula of an unknown compound is C5H10O2
The mass spectrum of the molecule showed a molecular ion peak at m/z = 102
The IR spectrum of the molecule showed a sharp absorption peak at 1750 cm-1.
The 1H NMR spectrum of the molecule showed the following peaks:
Chemical
shift
Splitting Integration factor
(relative no. of protons)
0.8 Triplet 3
1.1 Sextet 2
2.3 Triplet 2
3.7 Singlet 3
Use all of the information provided to deduce the structure of the molecule.
Solution
Assuming 100% relative intensity for M peak=102 (100%), M+1=103 and M+2=104.
Validated from 1st August 2019 to 31st July 2024 V1 Page 8 of 17 ©Ascentis
From the given empirical formula, the minimum number of carbon atoms are 5.
To figure out the molecular formula, subtract the known atomic masses from the compound’s
mass to obtain mass of remaining atoms (Wishart and Madhava Rao 2010)
M −C5=102−5 ( 12 ) =42.
Since H=1 and O=16
10(1)+2(16)=42
The molecular formula isC5 H10 O2.
The sharp absorption peak at 1750 cm-1 from IR spectrum indicated that esters or ketones
groups ( C=O ¿ could be present.
Calculating DBE from the molecular formula as:
DBE=C – (H /2)+( N /2)+1
DBE=5− ( 10/2 )−0+1=1
A DBE of 1 shows that there is one pi bond or one ring.
Using the data from H-NMR Spectroscopy, determine the structural formula (SETO 2012).
Chemical shift Splitting Integral factor Number of
hydrogen
Implications
0.8 Triplet 3 3 CH 3 in CH 3 CH 2
1.1 Sextet 2 2 CH 2 in CH 2 CH 3
2.3 Triplet 2 2 CH 2 in CH 2 CH 3
3.7 Singlet 3 3 CH 3 in CH 3 CH 2
Total number of integrals:
3+2+2+3=10
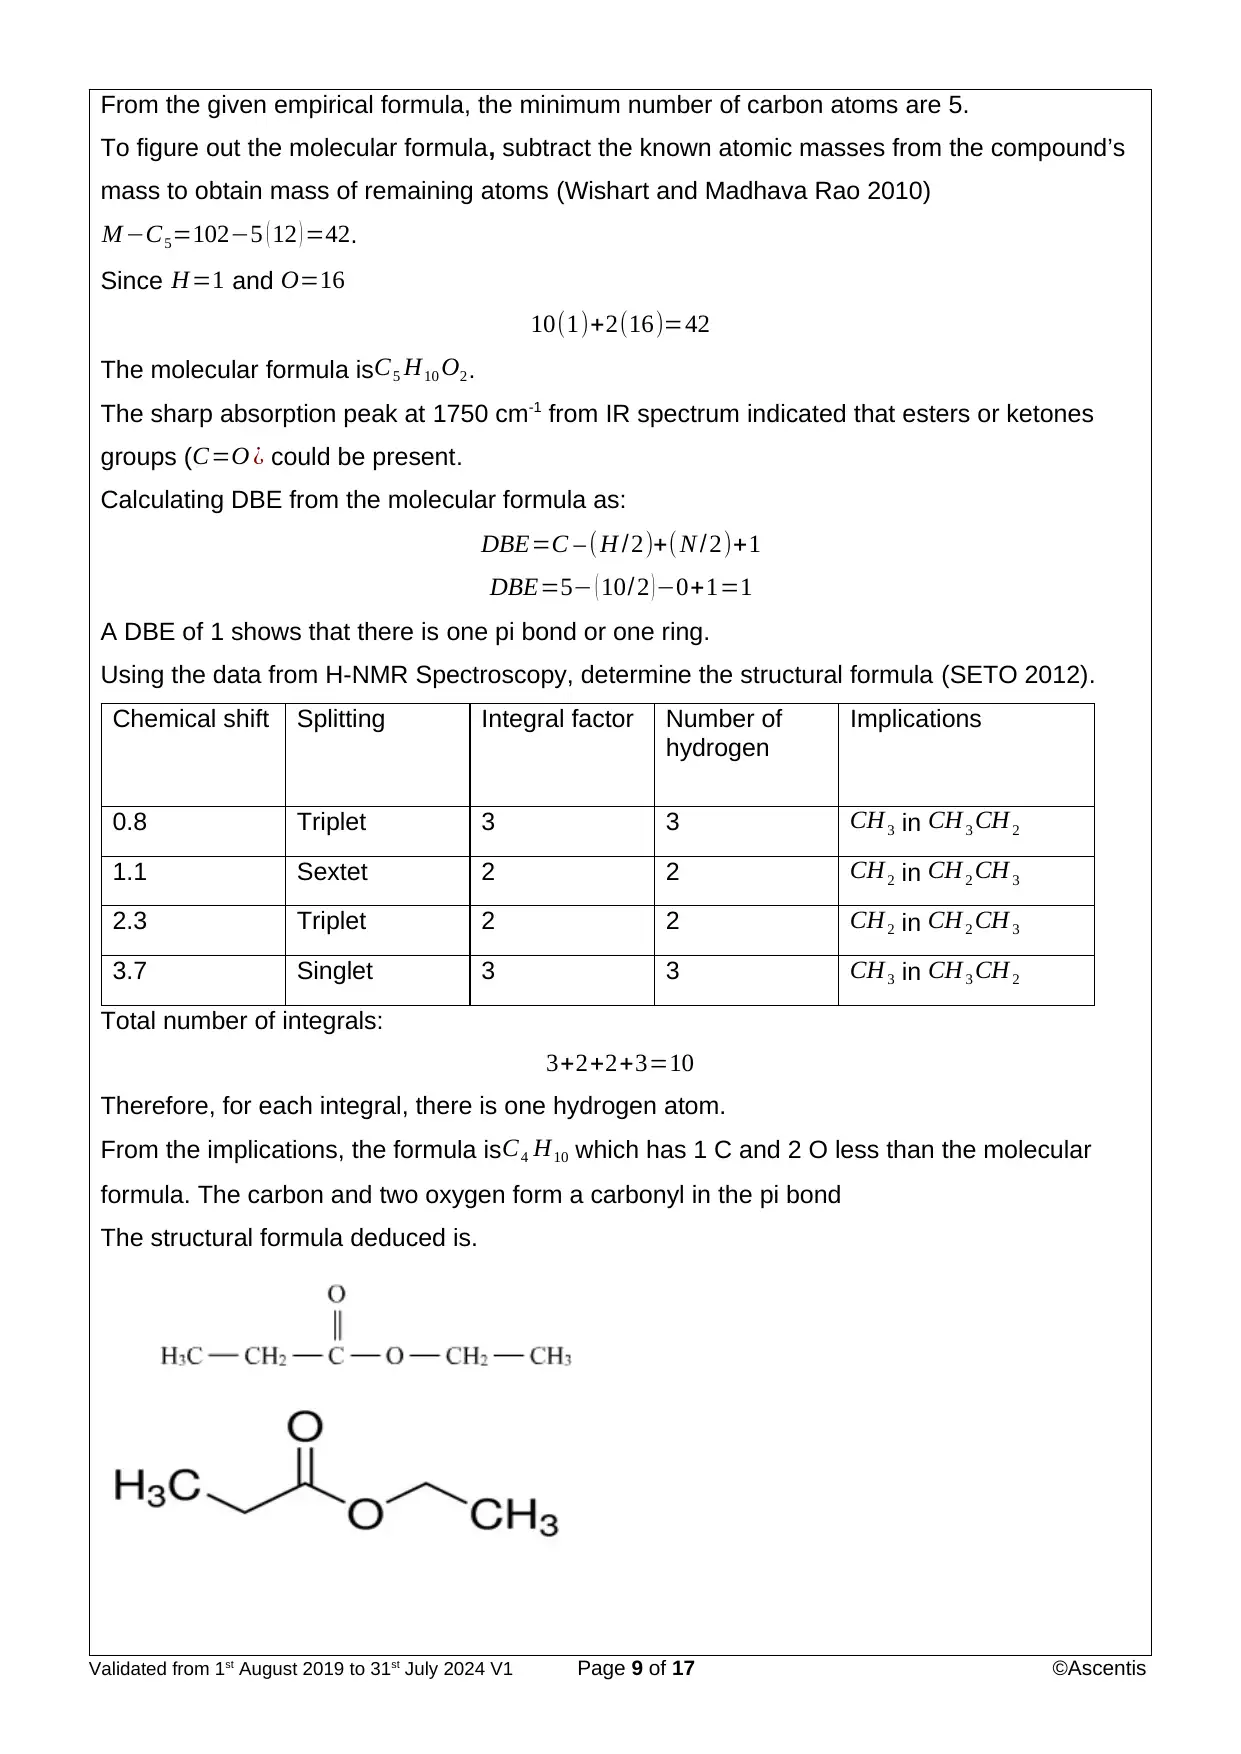
Therefore, for each integral, there is one hydrogen atom.
From the implications, the formula isC4 H10 which has 1 C and 2 O less than the molecular
formula. The carbon and two oxygen form a carbonyl in the pi bond
The structural formula deduced is.
Validated from 1st August 2019 to 31st July 2024 V1 Page 9 of 17 ©Ascentis
To figure out the molecular formula, subtract the known atomic masses from the compound’s
mass to obtain mass of remaining atoms (Wishart and Madhava Rao 2010)
M −C5=102−5 ( 12 ) =42.
Since H=1 and O=16
10(1)+2(16)=42
The molecular formula isC5 H10 O2.
The sharp absorption peak at 1750 cm-1 from IR spectrum indicated that esters or ketones
groups ( C=O ¿ could be present.
Calculating DBE from the molecular formula as:
DBE=C – (H /2)+( N /2)+1
DBE=5− ( 10/2 )−0+1=1
A DBE of 1 shows that there is one pi bond or one ring.
Using the data from H-NMR Spectroscopy, determine the structural formula (SETO 2012).
Chemical shift Splitting Integral factor Number of
hydrogen
Implications
0.8 Triplet 3 3 CH 3 in CH 3 CH 2
1.1 Sextet 2 2 CH 2 in CH 2 CH 3
2.3 Triplet 2 2 CH 2 in CH 2 CH 3
3.7 Singlet 3 3 CH 3 in CH 3 CH 2
Total number of integrals:
3+2+2+3=10
Therefore, for each integral, there is one hydrogen atom.
From the implications, the formula isC4 H10 which has 1 C and 2 O less than the molecular
formula. The carbon and two oxygen form a carbonyl in the pi bond
The structural formula deduced is.
Validated from 1st August 2019 to 31st July 2024 V1 Page 9 of 17 ©Ascentis
⊘ This is a preview!⊘
Do you want full access?
Subscribe today to unlock all pages.
Trusted by 1+ million students worldwide
Reference List
Ibarra, E., Valencia, O. and Pérez, H. (2015). Analysis of Betaines Using near Infrared
Spectroscopy. Journal of Near Infrared Spectroscopy, 13(3), pp.133-138.
Jones, C., Mulloy, B. and Thomas, A. (2013). Spectroscopic methods and analyses. Totowa,
N.J.: Humana Press, pp.88-122.
Meislich, H. (2014). Organic chemistry. New York, NY: McGraw-Hill Press.
SETO, H. (2012). The latest NMR measuring method - 1: Supersensitive NMR measuring
method subjected to HMBC. Kagaku To Seibutsu, 33(1), pp.42-49.
Thornton, D. (2009). Some Applications of Infrared Spectroscopy To Inorganic
Chemistry. Transactions of the Royal Society of South Africa, 47(2), pp.119-143.
Wishart, J. and Madhava Rao, B. (2010). Recent trends in radiation chemistry. Singapore:
World Scientific.
Webbook.nist.gov. (2020). 2-Butanone. [online] Available at:
https://webbook.nist.gov/cgi/cbook.cgi?ID=C78933&Mask=200 [Accessed 5 Feb. 2020].
Chem.ucla.edu. (2020). [online] Available at:
http://www.chem.ucla.edu/~harding/ec_tutorials/tutorial36.pdf [Accessed 4 Feb. 2020].
Academics.eckerd.edu. (2020). Eckerd College Academics. [online] Available at:
http://academics.eckerd.edu/ [Accessed 4 Feb. 2020].
C Learning Outcomes
Validated from 1st August 2019 to 31st July 2024 V1 Page 10 of 17
©Ascentis
Paraphrase This Document
Need a fresh take? Get an instant paraphrase of this document with our AI Paraphraser

Learning Outcomes Assessment Criteria
1st
submission
Achieved
Y/N
2nd
submission
Achieved
Y/N
The student should be
able to:
The student has achieved this
outcome because s/he can:
1 Understand
molecular structure
through interpretation
of low resolution
mass spectra.
1.1 Outline the functions of the
main parts of a ‘time of
flight’ mass spectrometer.
1.2 Interpret mass spectra to
propose the structure of
organic molecules.
3 Determine the
features of molecular
structure through
interpretation of infra-
red (IR) spectra.
2.1 Outline the principles
behind IR spectroscopy
2.2 Interpret IR spectra to
identify the functional
groups present in organic
molecules.
5 Use nuclear
magnetic resonance
(NMR) spectra to
understand the
features of molecular
structure.
3.1 Outline the principles
behind NMR
spectroscopy.
3.2 Interpret proton/H+ NMR
spectra to propose the
structure of organic
molecules.
7 Deduce the
structures of organic
molecules through
analysis of data from
a combination of
spectroscopic
techniques (mass
spec, IR, NMR).
4.1 Propose the structure of
an organic molecule
through interpretation of
data from at least two
types of spectral analysis.
Validated from 1st August 2019 to 31st July 2024 V1 Page 11 of 17
©Ascentis

D Tutor Assignment Feedback
Tutor Comments (1st Submission)
Tutor Comments (2nd Submission)
E Grade Profile
Tick if
applicable
to this
assignment
Tutor comments
Performanc
e against
descriptor
(P / M / D)
1 Understanding of the
subject
2 Application of
knowledge
3. Application of skills
5 Communication and
presentation
7 Quality
Overall unit grade
Validated from 1st August 2019 to 31st July 2024 V1 Page 12 of 17
©Ascentis
⊘ This is a preview!⊘
Do you want full access?
Subscribe today to unlock all pages.
Trusted by 1+ million students worldwide
1 out of 17
Your All-in-One AI-Powered Toolkit for Academic Success.
+13062052269
info@desklib.com
Available 24*7 on WhatsApp / Email
![[object Object]](/_next/static/media/star-bottom.7253800d.svg)
Unlock your academic potential
Copyright © 2020–2025 A2Z Services. All Rights Reserved. Developed and managed by ZUCOL.