CHEMICAL SPECTROSCOPY Unit Code: 1384064
Access to Higher Education Chemistry Assignment Brief A: Chemical Spectroscopy - This assignment requires students to understand and interpret infrared spectroscopy, specifically focusing on characteristic absorption frequencies and their corresponding bond types.
Added on 2022-08-17
About This Document
pleas make sure to use diagrams in the assignment at least in each question and all the information should be A Level, and the most important part on the assignment is LO4 please I want it to be specific and detailed. many thanks .
CHEMICAL SPECTROSCOPY Unit Code: 1384064
Access to Higher Education Chemistry Assignment Brief A: Chemical Spectroscopy - This assignment requires students to understand and interpret infrared spectroscopy, specifically focusing on characteristic absorption frequencies and their corresponding bond types.
Added on 2022-08-17
Student Name Centre
Tutor Name Unit Title: CHEMICAL SPECTROSCOPY
Subject: CHEMISTRY Unit Code: 1384064
Assignment Title: CHEMICAL
SPECTROSCOPY Indicative Word Count n/a
Assignments for this Unit 1 of 1
This unit is graded
1,2,3,5,7 No. of Credits 3 Level 3
Date set Date due Date submitted
If a resubmission Date due Date submitted
Student Declaration
I understand that copying / taking ideas from other sources (e.g. reference books, journals, internet, and
tutor handouts) without acknowledging them is plagiarism. I confirm that:
This assignment is all my own work.
All contributions taken from other reading and research have been referenced accurately.
Any direct quotations taken from other reading and research have been acknowledged and attributed
accurately.
I have attached a bibliography listing all sources used in producing this assignment.
I have added the word count below. NB unless specified otherwise, the word count indicated above is
acceptable.
I have read and understood the Ascentis document entitled ‘Policies and Procedures for Dealing with
Malpractice’ provided by the tutor and understand the consequences of non-compliance with this
document.
To be completed by student on submission and in confirmation of above declaration
Student signature
Word count
To be completed by tutor
Tutor signature
Unit grade award Word count confirmed as accurate Yes/No
To be completed by the IM (Internal Moderator) if work has been internally moderated
IM name (printed) IM signature
Date internally moderated
Validated from 1st August 2019 to 31st July 2024 V1 Page 1 of 17 ©Ascentis
Access to Higher Education
Chemistry
Assignment Brief
Assignment Brief
You will need a chemistry data sheet or access to a book of data to complete this assignment
LO1 – Understand molecular structure through interpretation of low resolution mass spectra.
AC 1.1 Outline the functions of the main parts of a ‘time of flight’ mass spectrometer.
AC 1.2 Interpret mass spectra to propose the structure of organic molecules.
1. Use a labelled diagram to explain the principles of a simple time of flight mass spectrometer.
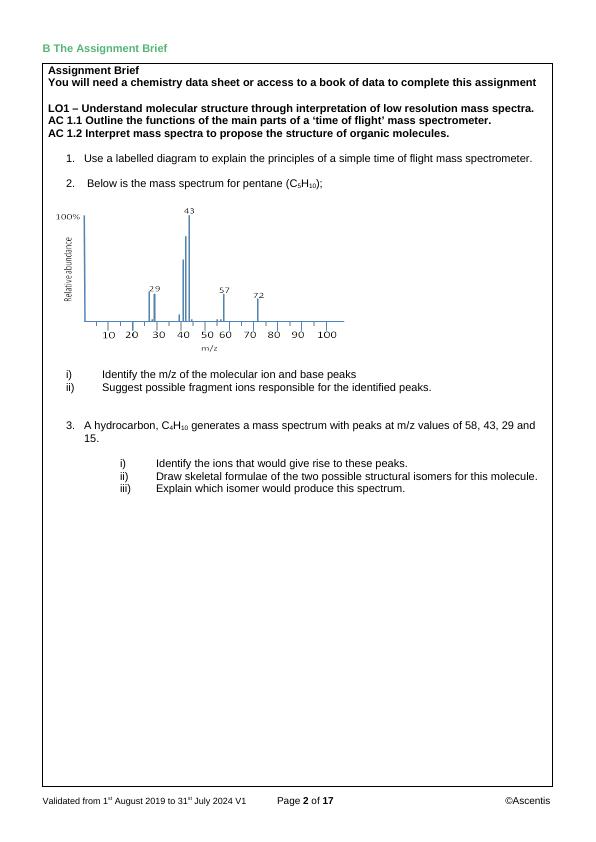
2. Below is the mass spectrum for pentane (C5H10);
i) Identify the m/z of the molecular ion and base peaks
ii) Suggest possible fragment ions responsible for the identified peaks.
3. A hydrocarbon, C4H10 generates a mass spectrum with peaks at m/z values of 58, 43, 29 and
15.
i) Identify the ions that would give rise to these peaks.
ii) Draw skeletal formulae of the two possible structural isomers for this molecule.
iii) Explain which isomer would produce this spectrum.
Validated from 1st August 2019 to 31st July 2024 V1 Page 2 of 17 ©Ascentis
(IR) spectra.
AC 2.1 Outline the principles behind IR spectroscopy
AC 2.2 Interpret IR spectra to identify the functional groups present in organic
molecules.
1. Summarise the principles behind infrared spectroscopy.
The infra-red region of the spectrum has radiations with energy enough to stretch or bend
bonds in a molecule. In the IR region, each functional group of molecules has a specific range
of characteristic absorption frequencies. Infra-red absorption spectroscopy involves detection
of the frequencies of IR light absorbed by a given molecule to determine the basic functional
groups of molecules (Meislich 2014).
Atoms in a molecule are subject to different vibrations (stretching or bending) since they are
not fixed in the molecular structure. During IR absorption, a net change is caused in the dipole
moment of the molecule due to the vibrations or rotations within the molecules of compounds
with polar bonds. The IR radiation is absorbed when the radiation’s frequency and the
vibrational frequency of the molecules matches thus causing a change in amplitudes of the
vibrations. (Jones, Mulloy and Thomas 2013).The concept of absorption of specific
frequencies of light by molecules is used to deduce the corresponding molecular structure
from the molecule’s characteristic absorption. The absorbed frequencies of the infrared light
correspond to the resonant frequencies of vibration of the molecular bonds (Meislich 2014).
The resonant frequencies relate to the molecular bonds’ strength and the molecular atomic
mass and thus absorbed frequencies can be associated with a specific type of bond and
functional group.
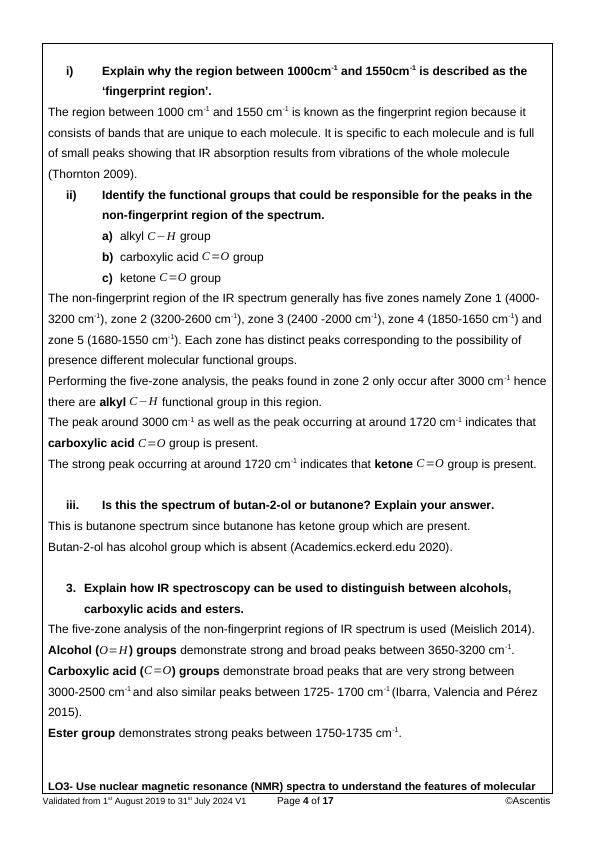
2. Below is an IR spectrum for an organic molecule
Validated from 1st August 2019 to 31st July 2024 V1 Page 3 of 17 ©Ascentis
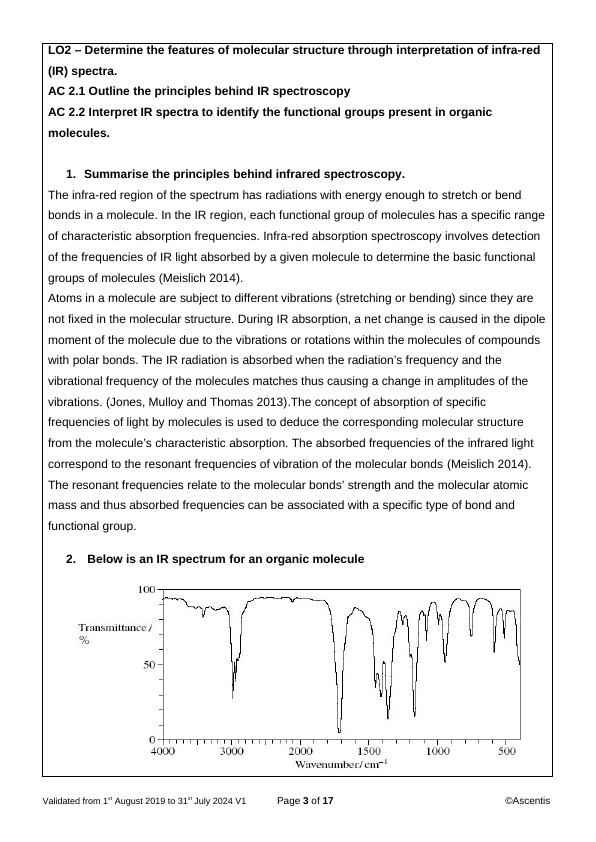
‘fingerprint region’.
The region between 1000 cm-1 and 1550 cm-1 is known as the fingerprint region because it
consists of bands that are unique to each molecule. It is specific to each molecule and is full
of small peaks showing that IR absorption results from vibrations of the whole molecule
(Thornton 2009).
ii) Identify the functional groups that could be responsible for the peaks in the
non-fingerprint region of the spectrum.
a) alkyl C−H group
b) carboxylic acid C=O group
c) ketone C=O group
The non-fingerprint region of the IR spectrum generally has five zones namely Zone 1 (4000-
3200 cm-1), zone 2 (3200-2600 cm-1), zone 3 (2400 -2000 cm-1), zone 4 (1850-1650 cm-1) and
zone 5 (1680-1550 cm-1). Each zone has distinct peaks corresponding to the possibility of
presence different molecular functional groups.
Performing the five-zone analysis, the peaks found in zone 2 only occur after 3000 cm-1 hence
there are alkyl C−H functional group in this region.
The peak around 3000 cm-1 as well as the peak occurring at around 1720 cm-1 indicates that
carboxylic acid C=O group is present.
The strong peak occurring at around 1720 cm-1 indicates that ketone C=O group is present.
iii. Is this the spectrum of butan-2-ol or butanone? Explain your answer.
This is butanone spectrum since butanone has ketone group which are present.
Butan-2-ol has alcohol group which is absent (Academics.eckerd.edu 2020).
3. Explain how IR spectroscopy can be used to distinguish between alcohols,
carboxylic acids and esters.
The five-zone analysis of the non-fingerprint regions of IR spectrum is used (Meislich 2014).
Alcohol (O=H ) groups demonstrate strong and broad peaks between 3650-3200 cm-1.
Carboxylic acid ( C=O) groups demonstrate broad peaks that are very strong between
3000-2500 cm-1 and also similar peaks between 1725- 1700 cm-1 (Ibarra, Valencia and Pérez
2015).
Ester group demonstrates strong peaks between 1750-1735 cm-1.
LO3- Use nuclear magnetic resonance (NMR) spectra to understand the features of molecular
Validated from 1st August 2019 to 31st July 2024 V1 Page 4 of 17 ©Ascentis
End of preview
Want to access all the pages? Upload your documents or become a member.