Accounting for Managers (ACC00724) Assignment Solution
VerifiedAdded on 2022/11/07
|9
|914
|479
Homework Assignment
AI Summary
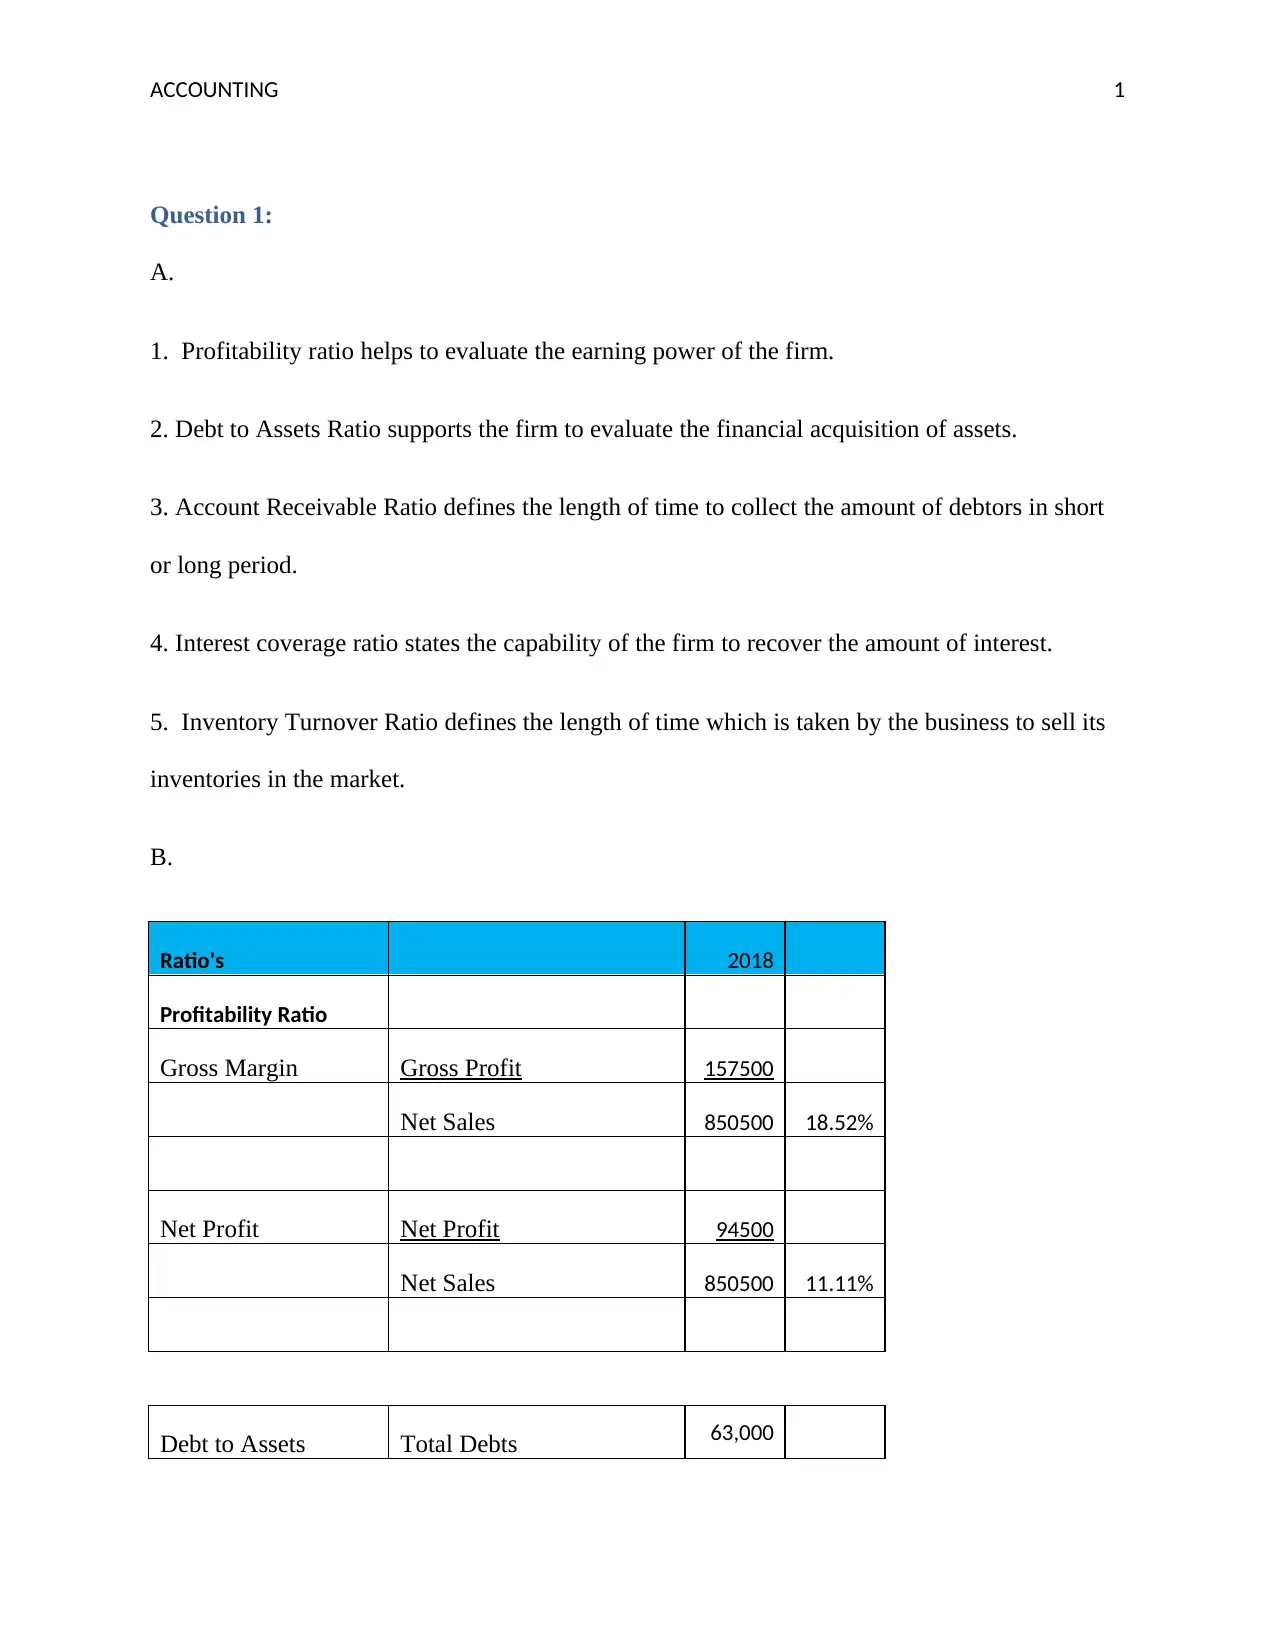
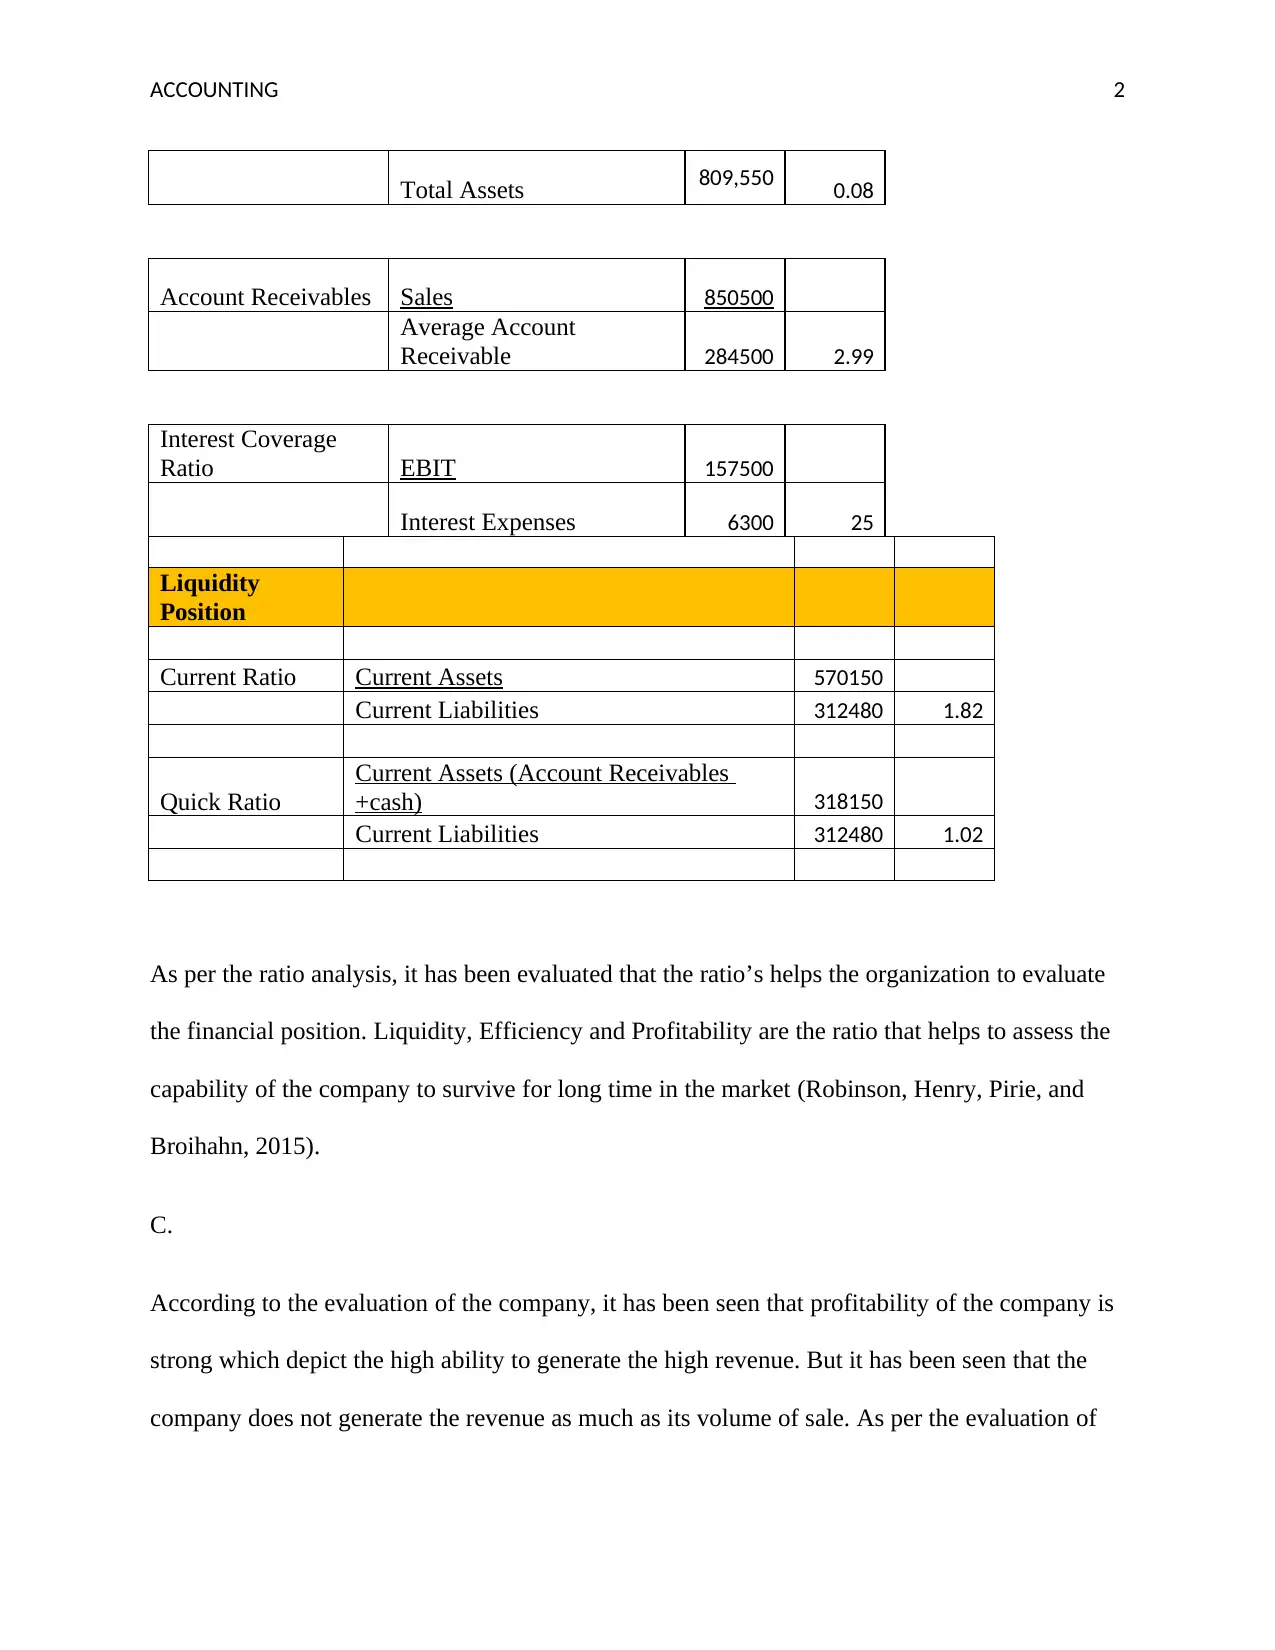
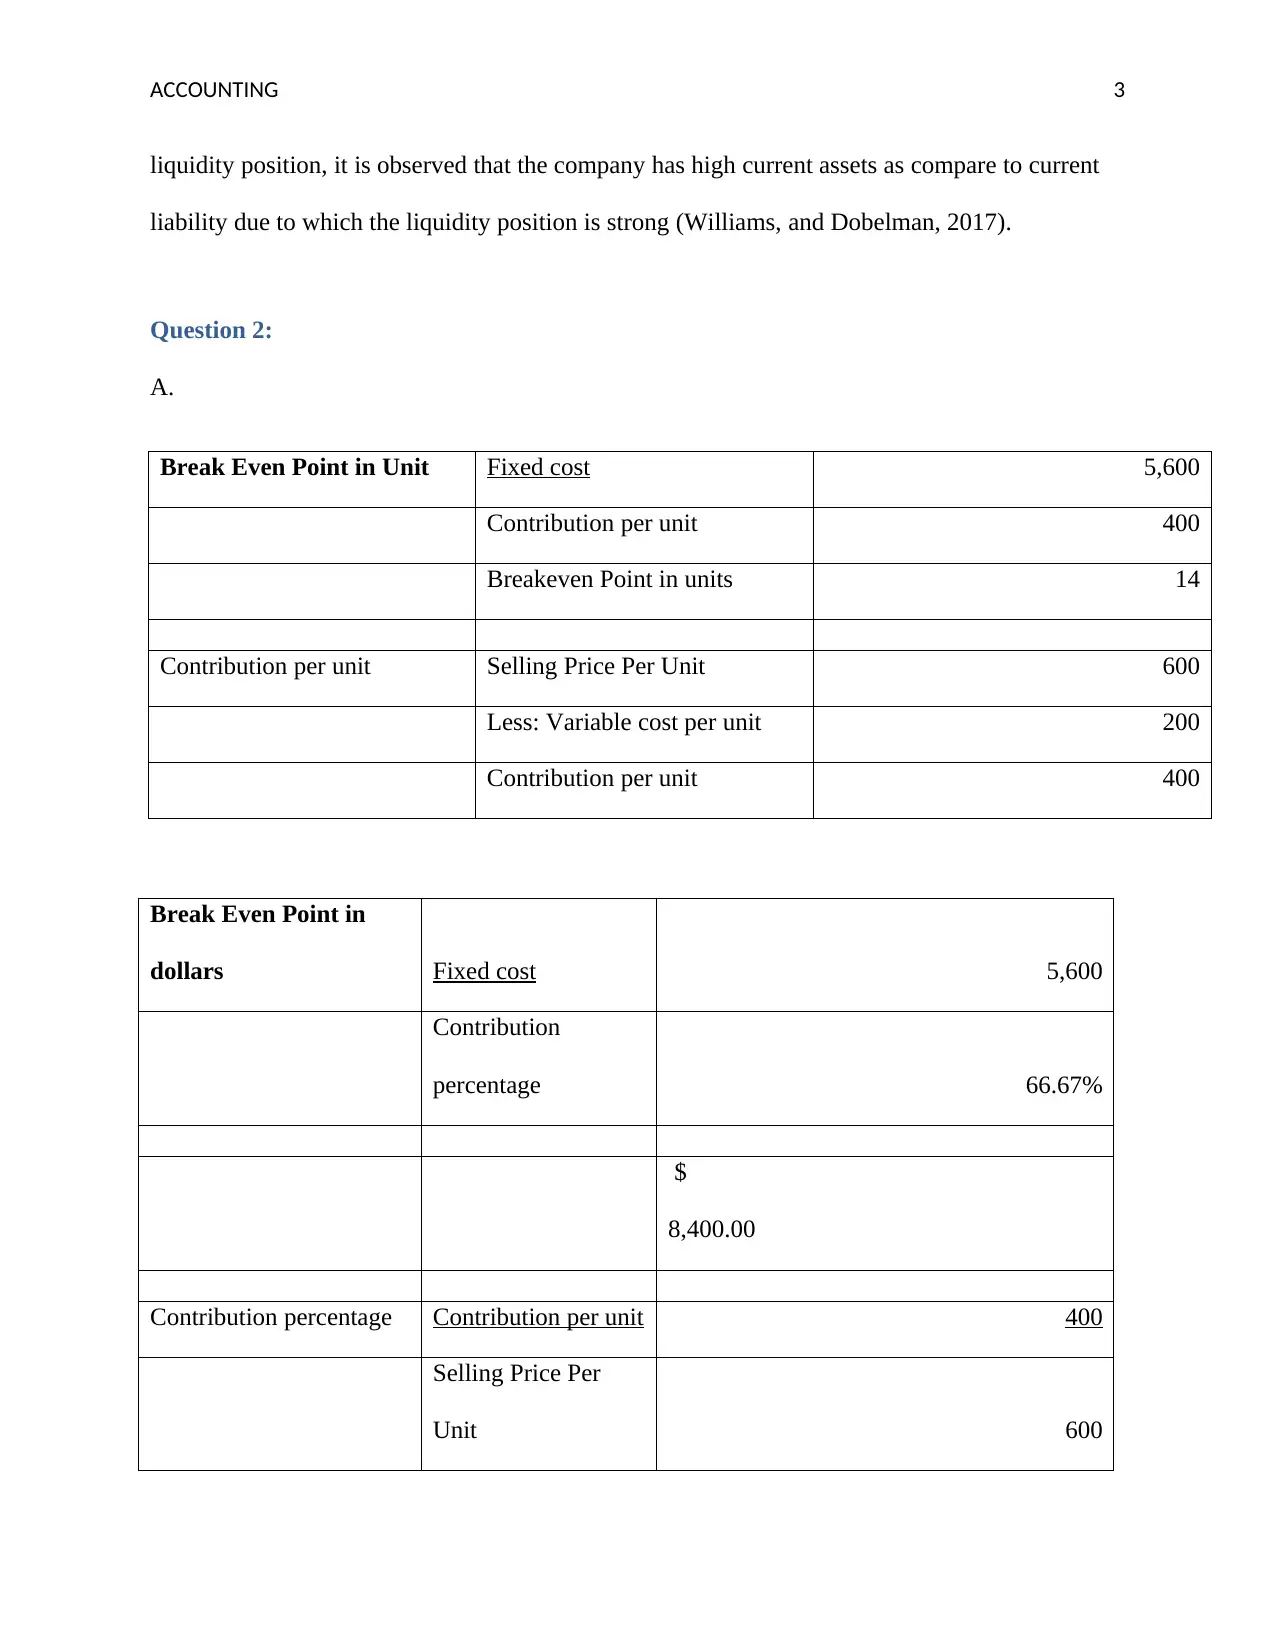
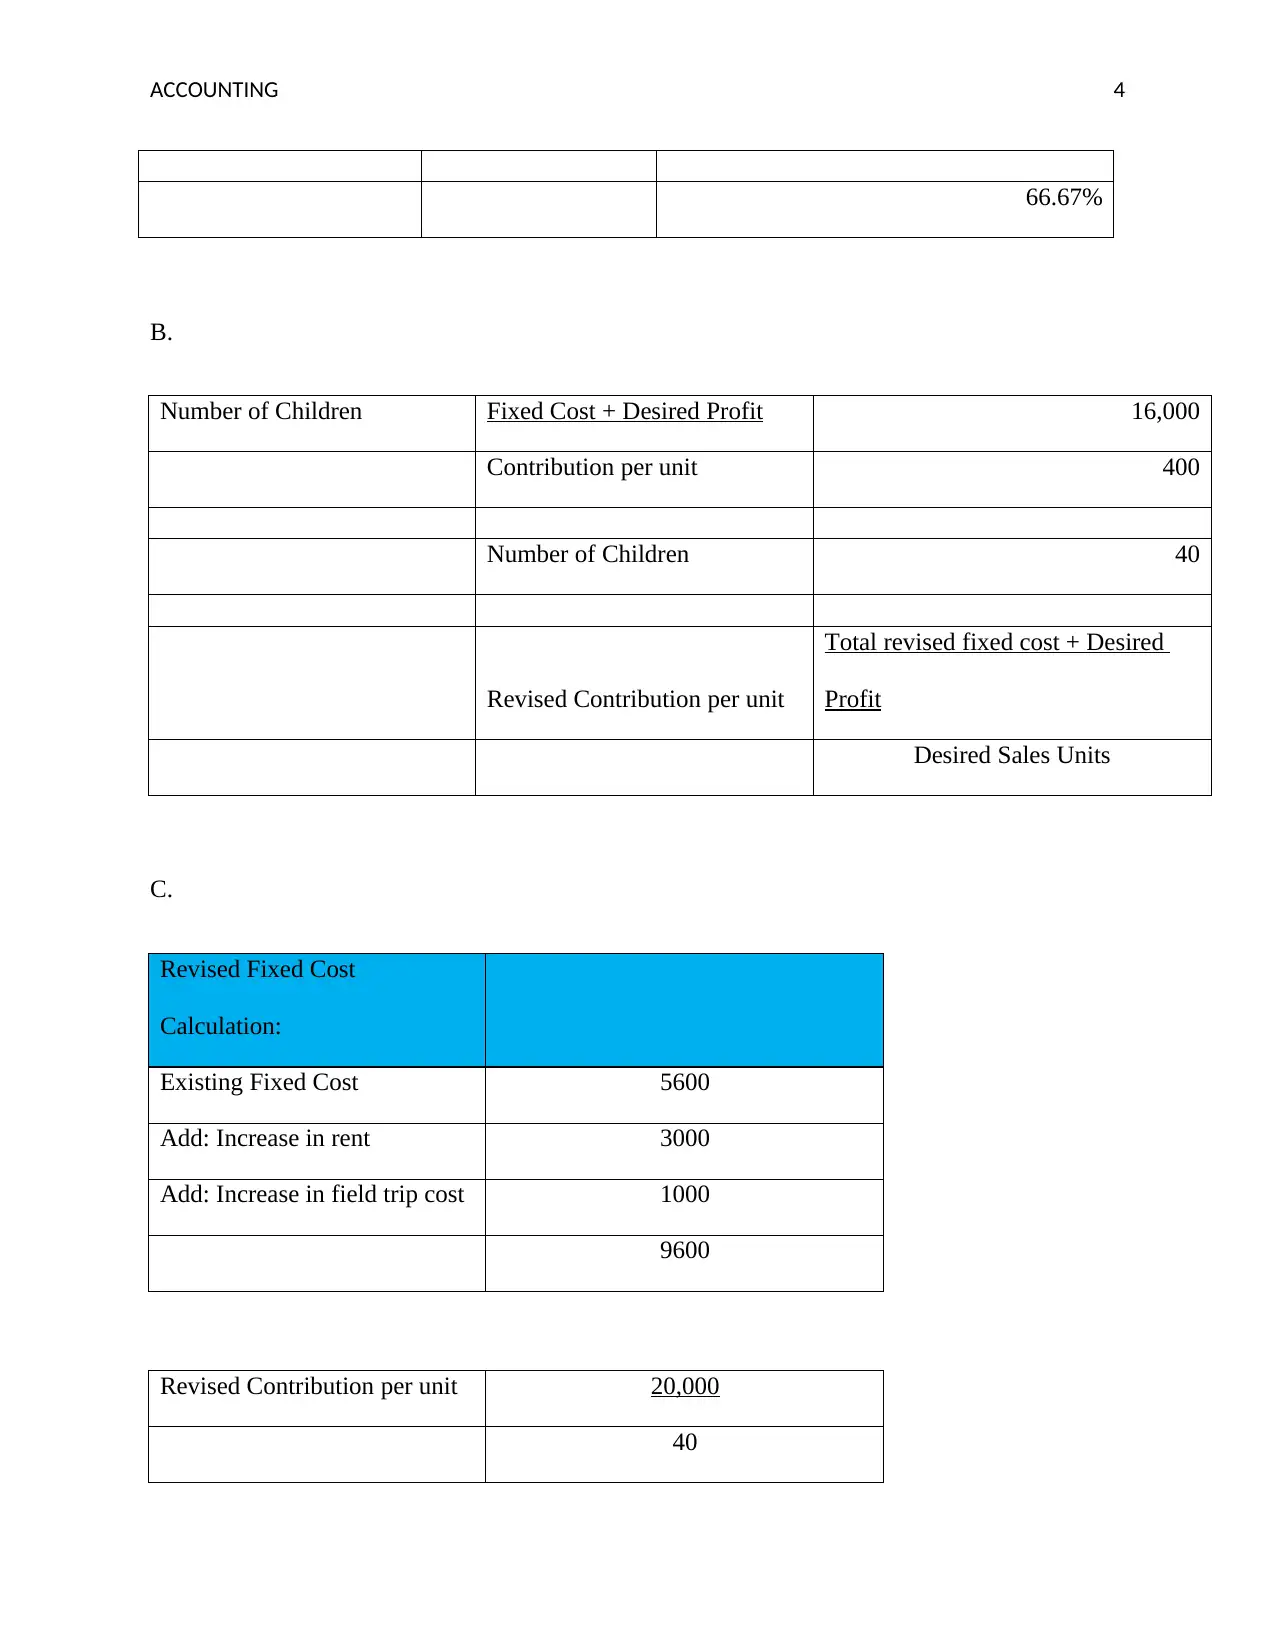
This assignment solution for Accounting for Managers (ACC00724) analyzes financial statements, covering profitability, liquidity, and efficiency ratios. It includes calculations for gross margin, net profit, debt-to-assets, account receivables, and interest coverage. The solution also addresses break-even analysis, calculating break-even points in units and dollars, and explores the impact of revised fixed costs and selling prices. Furthermore, the assignment delves into overhead allocation, differentiating between machine hours and direct labor cost, and detailing the process of calculating overhead recovery rates for different departments. The document uses examples to illustrate concepts and includes references to relevant accounting literature.

1 out of 9
Related Documents


Your All-in-One AI-Powered Toolkit for Academic Success.
+13062052269
info@desklib.com
Available 24*7 on WhatsApp / Email
![[object Object]](/_next/static/media/star-bottom.7253800d.svg)
Copyright © 2020–2025 A2Z Services. All Rights Reserved. Developed and managed by ZUCOL.