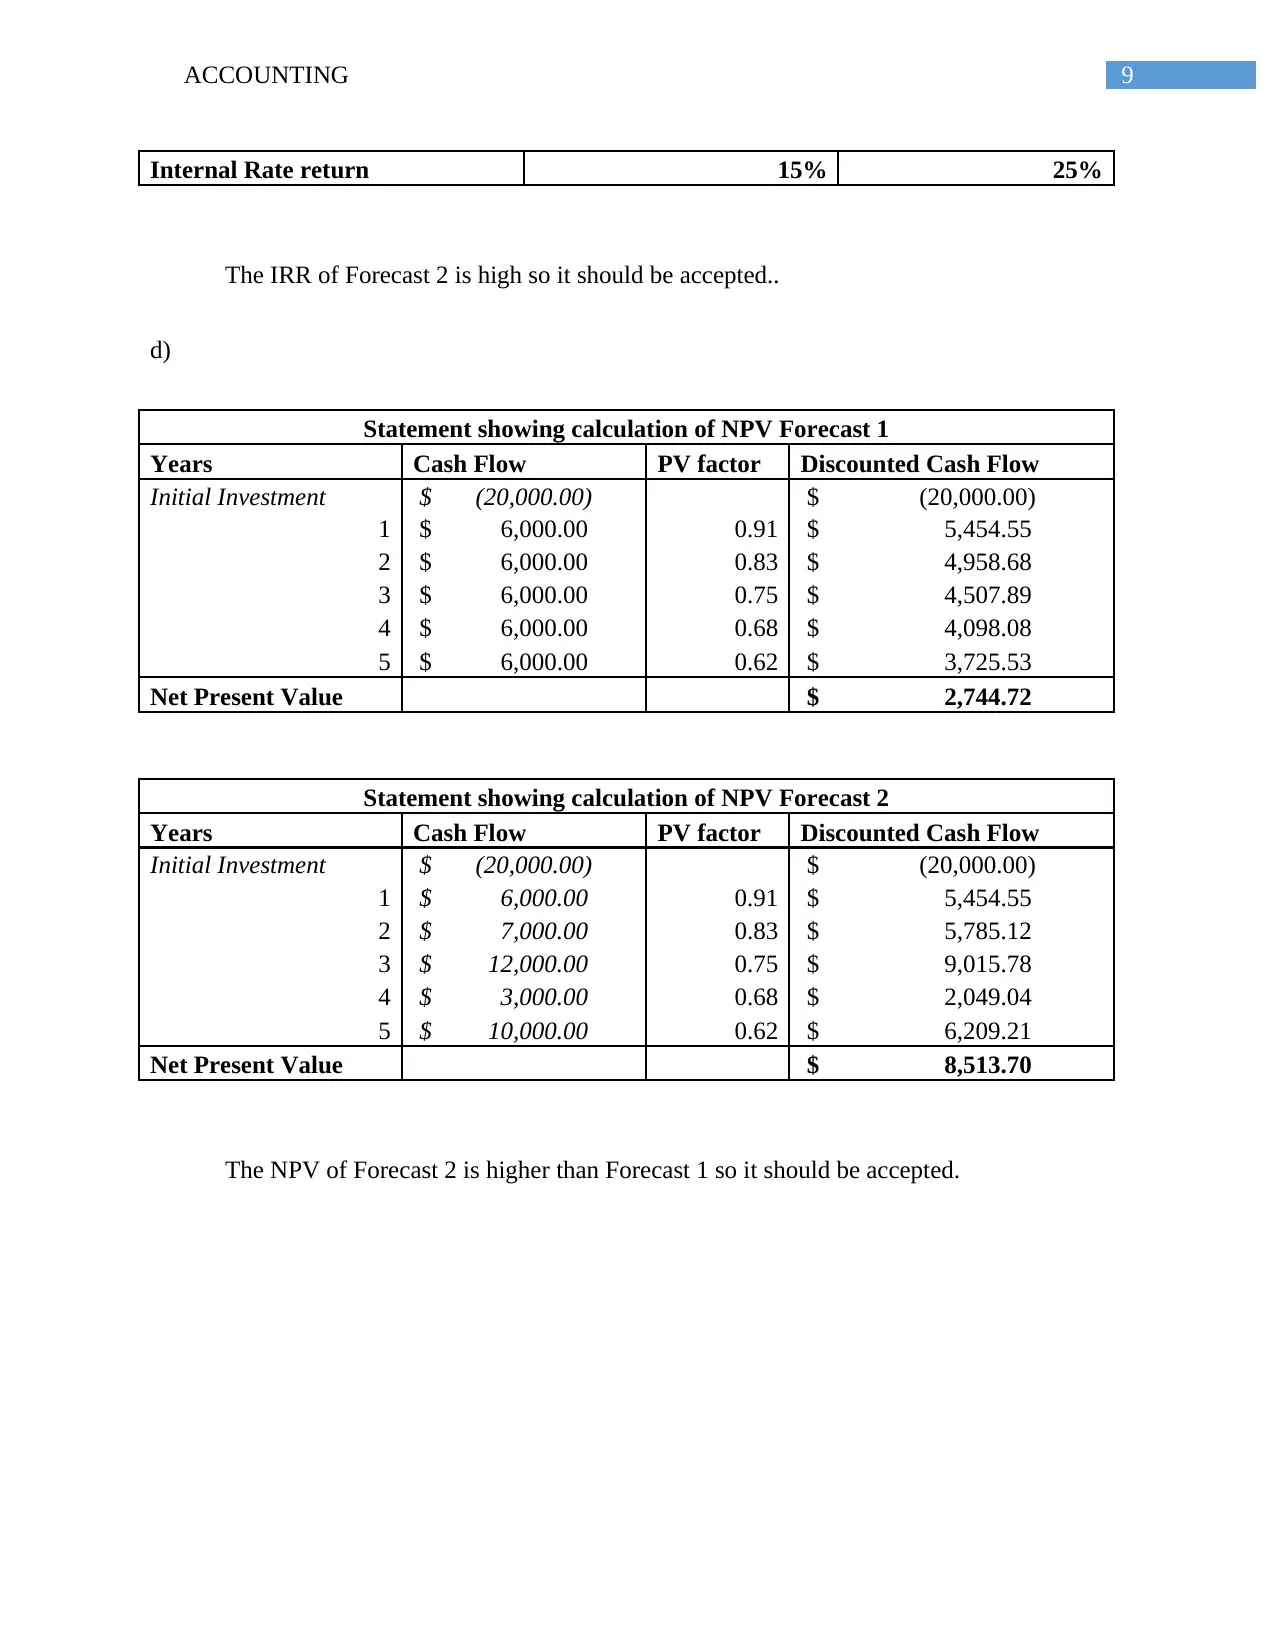
NPV Forecast Analysis and Decision Making

Verified

Added on  2020/05/04

|11
|1037
|47
AI Summary
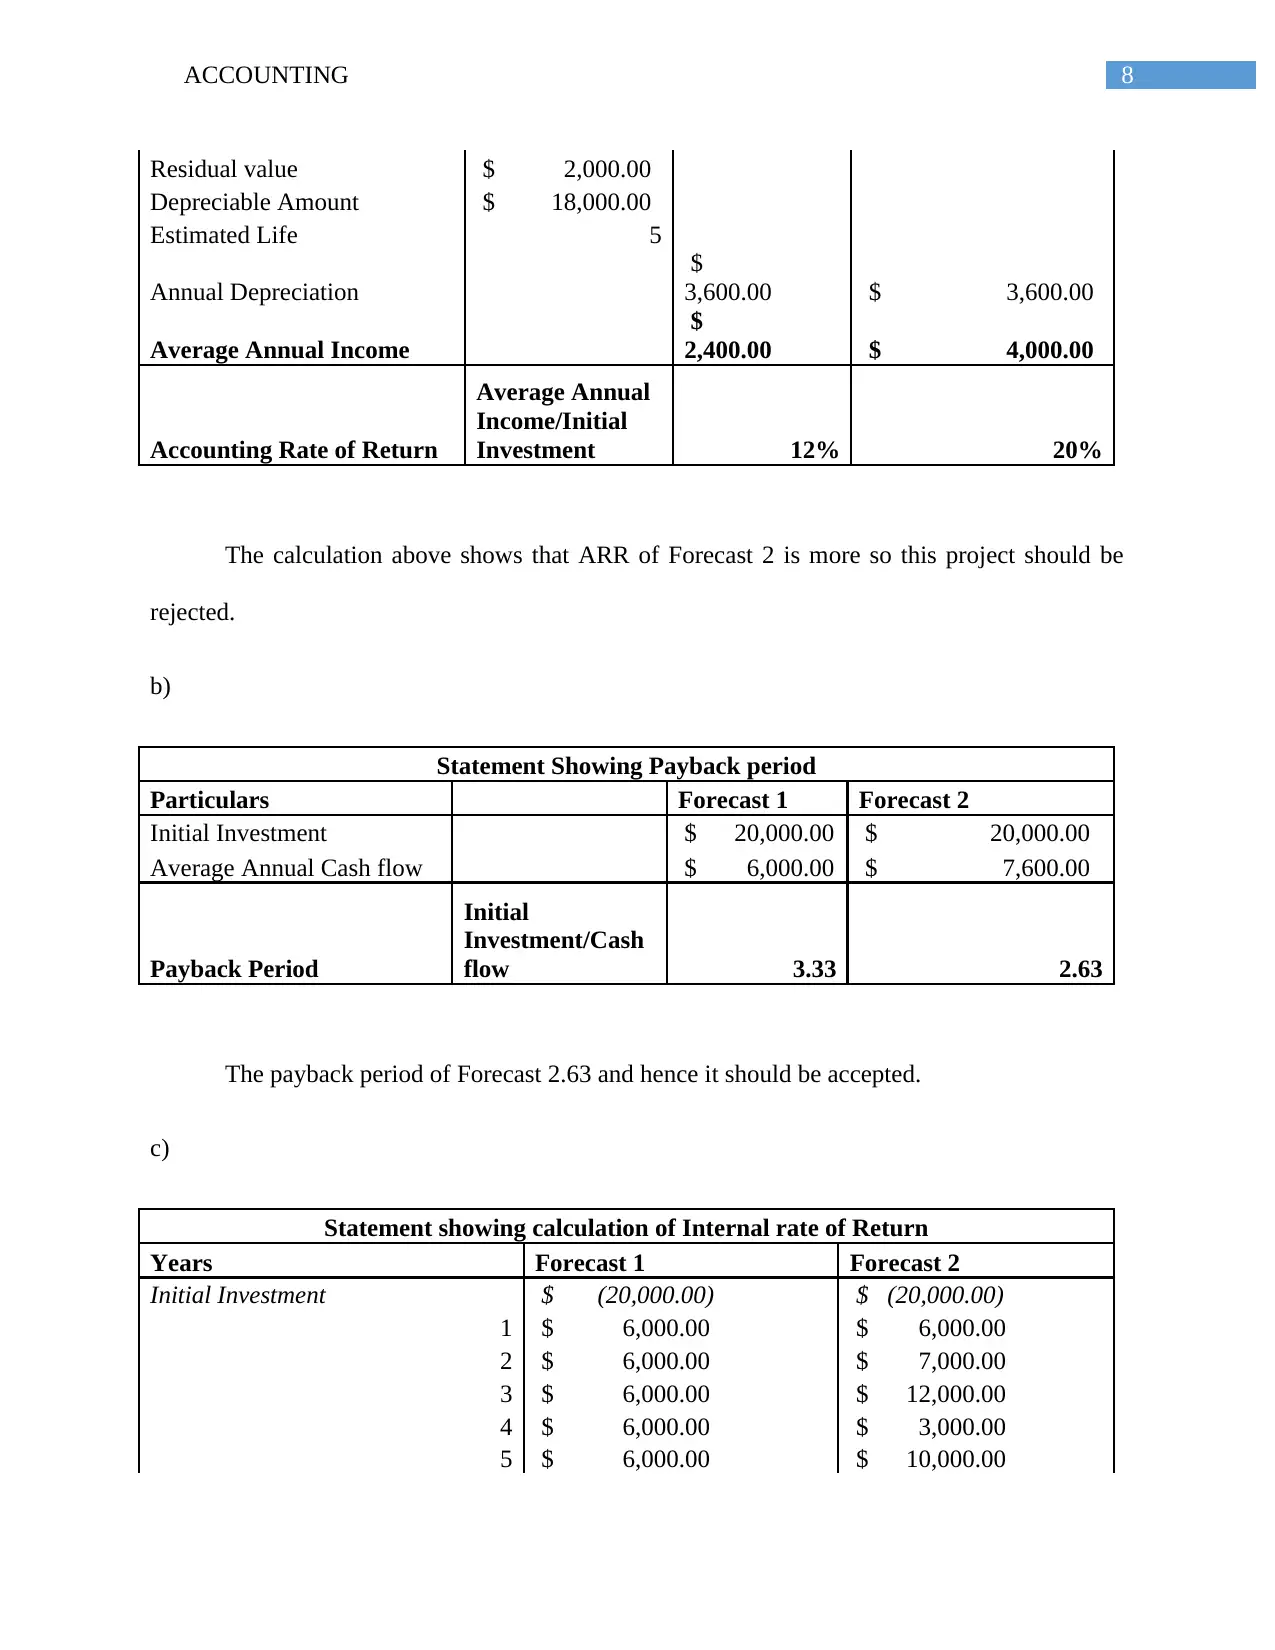
This assignment presents two financial forecasts (Forecast 1 and Forecast 2) with projected cash flows over five years. Students are tasked with calculating the Net Present Value (NPV) for each forecast using a discount rate and provided PV factors. The analysis should compare the NPVs of both forecasts and recommend the preferred forecast based on the results. The assignment emphasizes the practical application of NPV in making investment decisions.
tabler-icon-diamond-filled.svg

Contribute Materials

Your contribution can guide someone’s learning journey. Share your documents today.
Document Page
Running head: ACCOUNTING
Accounting
Name of the Student:
Name of the University:
Authors Note:
tabler-icon-diamond-filled.svg

Secure Best Marks with AI Grader

Need help grading? Try our AI Grader for instant feedback on your assignments.
Document Page
1ACCOUNTING
Table of Contents
Answer to Question 1......................................................................................................................2
Answer to Question 2......................................................................................................................3
Answer to Question 3......................................................................................................................5
Answer to Question 4......................................................................................................................7
Document Page
2ACCOUNTING
Answer to Question 1
a)
The major brand building and advertising spend is an operating KPI and it is an outcome.
b)
The loan approval times is a strategic KPI and it is a driver.
c)
The loan approved is an operating KPI and it is an outcome.
d)
The loan application number received online is an operating KPI and it is an outcome.
e)
The loan numbers sent for collection is an operating KPI and it is an outcome.
f)
The probability of the loan book is a strategic KPI and it is a driver.
g)
The percentage of loans funded against the loan approved a strategic KPI and it is a
driver.
Answer to Question 2
1.
Document Page
3ACCOUNTING
Statement showing Sales budget
Particulars Product A Product B
Budgeted Sales Unit 16200 11800
Price per unit $ 14.35 $ 12.20
Total Sales $ 232,470.00 $ 143,960.00
2.
Statement showing Production Budget
Particulars Product A Product B
Budgeted Sales Unit 16200 11800
Closing Inventory 8100 6600
Less:
Opening Inventory 5100 2600
Planned production 19200 15800
3.
Statement showing Purchase Budget
Particulars Component X Component Y
Units Required for production
Product A 96000 38400
Product B 47400 63200
Total 143400 101600
Add:
Closing inventory 46000 19500
Less:
Opening Inventory 38000 13500
Budgeted Purchase Unit 151400 107600
4.
Statement showing Purchase Budget
Particulars Component X Component Y
Budgeted Purchase Unit 151400 107600
tabler-icon-diamond-filled.svg

Secure Best Marks with AI Grader

Need help grading? Try our AI Grader for instant feedback on your assignments.
Document Page
4ACCOUNTING
Price $ 0.68 $ 0.24
Purchase Budget $ 102,952.00 $ 25,824.00
5.
Statement showing total labor hour and cost
Particulars Product A Product B
Hours Per unit 2 1
Production unit 19200 15800
Total Labor Hours required 38400 15800
Rate per hour $ 4.50 $ 4.00
Budgeted Labor Cost $ 172,800.00 $ 63,200.00
6.
Statement showing Contribution per unit
Particulars Product A Product B
Sales $ 232,470.00 $ 143,960.00
Less:
Purchase $ 74,496.00 $ 47,400.00
Labor $ 172,800.00 $ 63,200.00
Contribution $ (14,826.00) $ 33,360.00
Budgeted Sales Unit 16200 11800
Contribution/(loss) per unit $ (0.92) $ 2.83
7.
Statement showing Profit or loss forecast
Particulars Product A Product B
Contribution $ (14,826.00) $ 33,360.00
Less:
Overhead Expenses $ 25,000.00 $ 25,000.00
Profit or loss $ (39,826.00) $ 8,360.00
Document Page
5ACCOUNTING
Answer to Question 3
a)
Statement showing Breakeven point
Particular Amount
Sales Price $ 250.00
Less:
Variable Cost $ 185.00
Contribution $ 65.00
Fixed Costs $ 250,000.00
Break Even Units 3846
b)
Document Page
6ACCOUNTING
c)
Statement showing Calculation of profit
Particular Amount
Sales unit 5000
Sales $ 1,250,000.00
Less:
Variable Cost $ 925,000.00
Contribution $ 325,000.00
Less:
Fixed Costs $ 250,000.00
Profit $ 75,000.00
d)
Statement showing Calculation of profit
Particular Amount
tabler-icon-diamond-filled.svg

Paraphrase This Document

Need a fresh take? Get an instant paraphrase of this document with our AI Paraphraser
Document Page
7ACCOUNTING
Sales unit 8100
Sales $ 2,025,000.00
Less:
Variable Cost $ 1,498,500.00
Contribution $ 526,500.00
Less:
Fixed Costs $ 250,000.00
Lease Cost $ 200,000.00
Profit $ 76,500.00
The calculation above shows that leasing of new equipment will help in increasing profit
by $1500 (76500-75000). Therefore, it can be said that company should lease the new
equipment.
Answer to Question 4
a)
The Accounting rate of return is a capital budgeting technique that does not consider time
value of money. The formula for calculation is:
ARR= Average Annual Income / Initial Investment
The main strength of ARR is that it is easy to calculate and simple to understand. The
primary weakness is that is ignores the time factor of money.
Statement showing Accounting Rate of Return
Particulars Forecast 1 Forecast 2
Average cash flow
$
6,000.00 $ 7,600.00
Less:
Annual Depreciation
Project Cost $ 20,000.00
Document Page
8ACCOUNTING
Residual value $ 2,000.00
Depreciable Amount $ 18,000.00
Estimated Life 5
Annual Depreciation
$
3,600.00 $ 3,600.00
Average Annual Income
$
2,400.00 $ 4,000.00
Accounting Rate of Return
Average Annual
Income/Initial
Investment 12% 20%
The calculation above shows that ARR of Forecast 2 is more so this project should be
rejected.
b)
Statement Showing Payback period
Particulars Forecast 1 Forecast 2
Initial Investment $ 20,000.00 $ 20,000.00
Average Annual Cash flow $ 6,000.00 $ 7,600.00
Payback Period
Initial
Investment/Cash
flow 3.33 2.63
The payback period of Forecast 2.63 and hence it should be accepted.
c)
Statement showing calculation of Internal rate of Return
Years Forecast 1 Forecast 2
Initial Investment $ (20,000.00) $ (20,000.00)
1 $ 6,000.00 $ 6,000.00
2 $ 6,000.00 $ 7,000.00
3 $ 6,000.00 $ 12,000.00
4 $ 6,000.00 $ 3,000.00
5 $ 6,000.00 $ 10,000.00
Document Page
9ACCOUNTING
Internal Rate return 15% 25%
The IRR of Forecast 2 is high so it should be accepted..
d)
Statement showing calculation of NPV Forecast 1
Years Cash Flow PV factor Discounted Cash Flow
Initial Investment $ (20,000.00) $ (20,000.00)
1 $ 6,000.00 0.91 $ 5,454.55
2 $ 6,000.00 0.83 $ 4,958.68
3 $ 6,000.00 0.75 $ 4,507.89
4 $ 6,000.00 0.68 $ 4,098.08
5 $ 6,000.00 0.62 $ 3,725.53
Net Present Value $ 2,744.72
Statement showing calculation of NPV Forecast 2
Years Cash Flow PV factor Discounted Cash Flow
Initial Investment $ (20,000.00) $ (20,000.00)
1 $ 6,000.00 0.91 $ 5,454.55
2 $ 7,000.00 0.83 $ 5,785.12
3 $ 12,000.00 0.75 $ 9,015.78
4 $ 3,000.00 0.68 $ 2,049.04
5 $ 10,000.00 0.62 $ 6,209.21
Net Present Value $ 8,513.70
The NPV of Forecast 2 is higher than Forecast 1 so it should be accepted.
tabler-icon-diamond-filled.svg

Secure Best Marks with AI Grader

Need help grading? Try our AI Grader for instant feedback on your assignments.
Document Page
10ACCOUNTING
Reference
Collier, P.M., 2015. Accounting for managers: Interpreting accounting information for decision
making. John Wiley & Sons.
Dhamija, S., 2015. Financial Accounting for Managers, 2/e. Pearson Education India.
DRM13, M., 2016. ACCOUNTING FOR MANAGERS.
Webster, W.H., 2016. Accounting for managers.
chevron_up_icon
1 out of 11
circle_padding
hide_on_mobile
zoom_out_icon
[object Object]

Your All-in-One AI-Powered Toolkit for Academic Success.

Available 24*7 on WhatsApp / Email

[object Object]